
Figure 7.
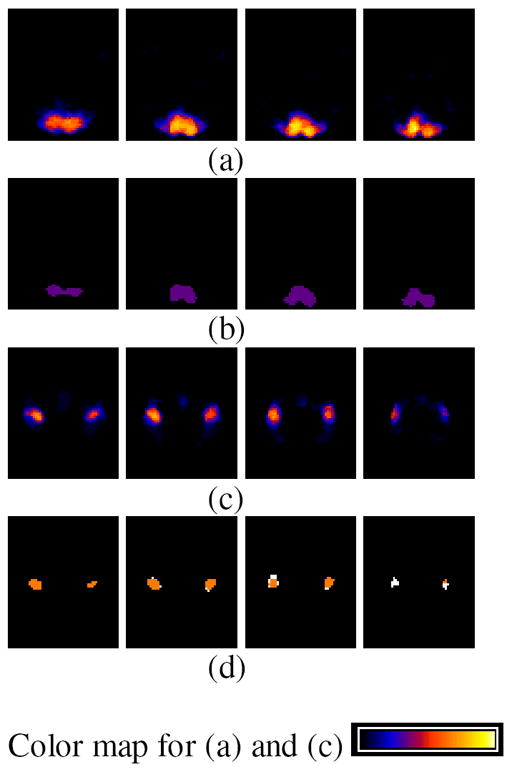
The summation of activation maps for all subjects and the label field Λmode for the simulated data. The summation map shows the probability of voxel activation in the activation maps. (a) summation map in region A; slice numbers from left to right are 14, 16, 18, 20, respectively. (b) cluster 1 (purple) in Λmode. (c) summation map in region B; slice numbers from left to right are 35, 37, 39, 41, respectively. (d) cluster 2 (yellow) and 3 (white) in Λmode.