

Abstract
Human iris color was one of the first traits for which Mendelian segregation was established. To date, the genetics of iris color is still not fully understood and is of interest, particularly in view of forensic applications. In three independent genome-wide association (GWA) studies of a total of 1406 persons and a genome-wide linkage study of 1292 relatives, all from the Netherlands, we found that the 15q13.1 region is the predominant region involved in human iris color. There were no other regions showing consistent genome-wide evidence for association and linkage to iris color. Single nucleotide polymorphisms (SNPs) in the HERC2 gene and, to a lesser extent, in the neighboring OCA2 gene were independently associated to iris color variation. OCA2 has been implicated in iris color previously. A replication study within two populations confirmed that the HERC2 gene is a new and significant determinant of human iris color variation, in addition to OCA2. Furthermore, HERC2 rs916977 showed a clinal allele distribution across 23 European populations, which was significantly correlated to iris color variation. We suggest that genetic variants regulating expression of the OCA2 gene exist in the HERC2 gene or, alternatively, within the 11.7 kb of sequence between OCA2 and HERC2, and that most iris color variation in Europeans is explained by those two genes. Testing markers in the HERC2-OCA2 region may be useful in forensic applications to predict eye color phenotypes of unknown persons of European genetic origin.
Introduction
Human iris color is considered a polygenic trait and exists on a continuum from the lightest shades of blue to the darkest of brown or black, although often just three categories (i.e., blue, intermediate or green, and brown) are used.1 The physical basis of iris color variation is the amount of melanin pigment and the number of melanosomes in the outermost layer of the iris (anterior iridal stroma). Brown irides contain more melanin pigment and more melanosomes than blue ones, whereas the number of melanocytes is similar.1–3 The melanin pigment in the melanosomes can occur in two forms: eumelanin, a brown-black form responsible for dark iris colors, and pheomelanin, a red-yellow form of melanin.1 Although human iris color is subject to adrenergic regulation and may change resulting from medication,4,5 the trait usually remains constant past early childhood. Most human populations around the world have brown iris color. Blue and green colors are found almost exclusively in people of European descent.
Human iris color has been linked to chromosome 15.6,7 This region harbors the OCA2 gene (MIM 611409), the human homolog of the mouse pink-eye dilution locus encoding the P-protein. The OCA2 gene is involved in oculocutaneous albinism type II (MIM 203200),8–11 and various genetic variants in OCA2 are associated with human iris color variation.12–15 A detailed study of the OCA2 gene suggested that three SNPs within intron 1 for a large part explain the association to iris color.16 Other candidate genes that have been implicated in iris color include SLC45A2 or MATP (MIM 606202), ASIP (MIM 600201), TYRP1 (MIM 115501), CYP1A2 (MIM 124060), CYP2C8 (MIM 601129), and CYP2C9 (MIM 601130), but findings of these studies have not been replicated consistently.13,17,18
To date, all searches for genes involved in human iris color have been based on linkage studies and candidate gene studies. Although linkage analysis is the most powerful tool to identify rare genetic variants with strong effects, GWA is the preferred strategy for identifying common genetic variants with only small effects. No genome-wide association (GWA) study has been conducted for iris color in humans. We used GWA and linkage analysis in a comprehensive study of human iris color in two distinct populations: (1) the Erasmus Rucphen Family (ERF) study, an inbred and isolated population from the southwest of the Netherlands,19 and (2) the Rotterdam study, an outbred population study in a suburb of Rotterdam, the Netherlands.20
Material and Methods
Erasmus Rucphen Family Study
The Erasmus Rucphen Family (ERF) study is part of the Genetic Research in Isolated Population (GRIP) program and is based in a region in the southwest of the Netherlands. Genealogical relationships of inhabitants are known up to the middle of the 18th century. The population shows increased linkage disequilibrium and inbreeding.21,22 For the ERF study, all living descendants and spouses of 22 couples living in the 19th century in the GRIP region and parenting a minimum of six children were invited. The Medical Ethics Committee of the Erasmus Medical Center approved the study protocol, and all participants provided written informed consent. Information on iris color was collected for all participants, and genomic DNA was extracted from peripheral venous blood utilizing the salting-out method.23 For genome-wide linkage analysis (GWL-ERF6K), we used 1292 ERF individuals that had iris color data and were genotyped for the Illumina 6K linkage panel. For GWA-ERF250K (step 1, Figure 1), we selected 192 distantly related (≥5 generations) individuals for a study of height. Within the ERF population, height and iris color were not associated based on linear regression adjusted for age and sex in the population studied (p = 0.82). We therefore assumed that the genes involved in human height and iris color are independently inherited and thus used the GWA-ERF250K data for the project on iris color. For the second GWA study in ERF, GWA-ERF318K, we randomly drew 733 persons from the ERF study, not selecting on any phenotype. For regional verification (step 2), we used 2217 ERF participants for whom data on iris color were available (see Table 1 for characteristics).
Figure 1.
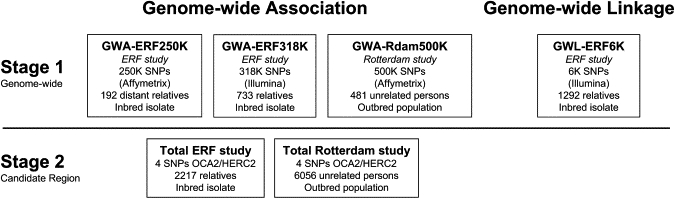
Design of the Study
Table 1.
Characteristics of the Study Populations
| Iris Color |
||||
|---|---|---|---|---|
| n | Blue | Intermediate | Brown | |
| Independent GWA Screens | ||||
| GWA-ERF250K: family-based sample of ERF study, only distant relatives | 192 | 40.6 | 16.2 | 43.2 |
| GWA-ERF318K: family-based sample of ERF study including close relatives | 733 | 37.6 | 22.9 | 39.5 |
| GWA-Rdam500K: population-based sample of Rotterdam study | 481 | 67.3 | 10.0 | 22.7 |
| Regional Verifications | ||||
| Total ERF study (family based) | 2217 | 41.1 | 20.9 | 38.0 |
| Total Rotterdam study (population-based) | 6056 | 67.6 | 9.7 | 22.7 |
Values are percentages unless otherwise indicated.
The Rotterdam Study Population
The Rotterdam Study is a population-based prospective study of 7983 subjects aged 55 years and older residing in Ommoord, a suburb of Rotterdam, that aims to assess the occurrence and determinants of chronic diseases.20 This is an outbred population, predominantly of Dutch origin. In 1990–1993, the participants were invited to visit the research center for a clinical examination. The Medical Ethics Committee of the Erasmus Medical Center approved the study protocol, and all participants provided written informed consent. Information on iris color was collected for all participants, and genomic DNA was extracted from peripheral venous blood utilizing the salting-out method.23 We selected 509 unrelated women aged between 60 and 75 years for an independent GWA-Rdam500K screen (see Table 1 for characteristics). Women with a history of myocardial infarction, stroke, cancer, or hip fractures and those using medication for hypertension, diabetes, dyslipidemia, or hormone replacement therapy were excluded. Although these women were selected for a pilot GWA study for osteoporosis and other disorders, we also assumed here that iris color was segregating independently from these traits in the population. For 481 women, GWA and data on iris color were available (GWA-Rdam500K, Figure 1), and for regional verification (step 2, Figure 1), we used 6056 participants with known iris color phenotypes and DNA (see Table 1).
Phenotype Collection
The ERF and the Rotterdam studies are based on the same study protocol. In both studies, each eye was examined by slit lamp examination by an ophthalmological medical researcher, and iris color was graded by standard images showing various degrees of iris pigmentation. Three categories of iris color (blue, intermediate, and brown) were distinguished based on predominant color and the amount of yellow or brown pigment present in the iris. Iris color phenotypes are summarized in Table 1. Differences between blue and brown iris color frequencies between the ERF study and the Rotterdam study can most likely be explained by the influence of the Spanish occupation of the southern region of the Netherlands that includes the region of the ERF study in the 16th and 17th centuries. This occupation lasted for almost hundred years.
Microarray Genotyping and Data Cleaning
For the Rotterdam study (GWA-Rdam500K), the GeneChip Human Mapping 500K Array Set (Affymetrix) was utilized. Because of the marked linkage disequilibrium in ERF,19,22 for GWA-ERF250K we applied the 250K Nsp array from the GeneChip Human Mapping 500K Array Set. For GWA-ERF318K, we applied the 318K array of the Illumina Infinium whole-genome genotyping assay (HumanHap300-2). Microarray-based genotyping according to the manufacturer's instructions was performed for GWA-ERF250K and GWA-Rdam500K at Erasmus MC and for GWA-ERF318K at the Leiden Genome Technology Center of the Leiden University Medical Center. Markers were excluded if they deviated significantly from Hardy-Weinberg equilibrium (p < 0.001), if they had low minor allele frequency (MAF < 0.025), or if they had a call rate <95% in all samples. Further, we excluded 10 women from GWA-Rdam500K who did not cluster with the otherwise homogeneous sample containing 98% of the participants (p < 0.0001).24 For the linkage analysis in the ERF cohort, we used the Illumina Infinium Linkage assay. This panel includes markers distributed evenly across the human genome (median distance between the marker 301 kb), of which we finally used 5661, after quality control and excluding X-chromosomal SNPs. The genotyping of this microarray was performed at the Centre National de Génotypage in France according to the manufacturer's instruction.
TaqMan Genotyping
For replication (step 2; Figure 1), four SNPs were genotyped in the total ERF (n = 2217) and the total Rotterdam (n = 6056) study. For rs11855019, rs7495174, and rs6497268, we used Custom TaqMan assays (Applied Biosystems), and for rs916977, we used the TaqMan genotyping assay C_2567831_10 (Applied Biosystems). Primer and probe sequences of the first three SNPs are available on request from the authors, whereas the assay for rs916977 is commercially available from the manufacturer. 1–2 ng genomic DNA was dispensed into 384-wells plates by a Caliper Sciclone ALH3000 pipetting robot (Caliper LS). All assays were run in a total volume of 2 μl with 2–5 ng of genomic DNA, 0.025–0.05 μl of 40× assay mix, and 1 μl ABSOLUTE QPCR mix (ABgene) or TaqMan Universal PCR Master Mix (Applied Biosystems). Reagents were dispensed in a 384-well plate with the Deerac Equator NS808 (Deerac Fluidics). PCR programs were 95°C 15 min, 95°C 15 s, and 60°C 1 min for 40 cycles (ABSOLUTE QPCR Mix) or 94°C 10 min, 94°C 15 s, 60°C 1 min for 40 cycles (TaqMan Universal PCR Master Mix) on Dual 384-well GeneAmp PCR system 9700 (Applied Biosystems) with subsequent end point reading on ABI 7900HT Real-Time PCR System (Applied Biosystems).
Association and Linkage Analysis
For the GWA analysis, we used the R library GenABEL version 1.1-8.25 We used the Armitage's test to estimate p values with brown, intermediate, and blue as a codominant outcome by linear regression analysis. To adjust for multiple testing with a large number of correlated markers, we derived the empirical distribution of the chi-square statistics after 1000 genome-wide permutations. Genome-wide significance was defined with an empirical p value smaller than 0.05. The relative contribution of each SNP adjusting for linkage disequilibrium was investigated by linear regression analyses with brown, intermediate, and blue as a codominant trait. We additionally performed the analyses in a categorical way with blue versus nonblue and brown versus nonbrown, and the findings and conclusions did not differ from the outcomes of the linear regression analysis. We used the genomic control method26 to adjust for the relationship between ERF participants and for population substructure in the Rotterdam study participants.27 Based on the Illumina Infinium Linkage Assay, the inflation factor was estimated to be 1.12 for the GWA-ERF250K and 1.31 for GWA-ERF318K. After exclusion of the 10 women that did not cluster, no inflation of test statistics was observed in GWA-Rdam500K (Lambda = 1.00) by the Affymetrix GeneChip Human Mapping 500K Array, suggesting that there is no residual confounding by population stratification. Additionally, we repeated the analyses with the EIGENSTRAT method28 and the first 10 principal axes of variation as implemented in GenABEL. This yielded similar results as with the adjustments with the genomic control method. Haplotype analysis was conducted with sliding windows of 2 and 3 neighboring SNPs with the R library haplo.stats version 1.3.29 For haplotype block analysis, we used Haploview version 3.32, where the blocks were defined with 95% confidence bounds of D′.30 Variance-component models as implemented in the SOLAR (Sequential Oligogenic Linkage Analysis Routines) computer package were used for the genome-wide linkage (GWL) study in ERF.31 The GWL analysis was repeated, including as covariate the SNP that showed the strongest linkage signal in the first analysis to test for variants that are masked by loci with large effects. Prior to the analysis, ERF pedigrees were split into 18-bit pedigrees by PedSTR software. Cutting complex pedigrees may lead to false positive linkage because the true kinship is underestimated. Therefore, instead of pedigree-based kinship estimates from the genealogy, we estimated the null kinship as an average of marker IBD across the genome. Power calculations showed that for the ERF study, linkage analysis has 80% power to reach a LOD score ≥ 3.3 for a variant, explaining approximately 17% of eye color variance. In order to achieve 80% power at a 5% genome-wide significance for the GWA series, a SNP is required to explain 18% of eye-color variance GWA-ERF250K (corrected for 250K tests), 8% of the variance in GWA-Rdam500K (500K tests), and 5% in GWA-ERF318K (300K tests). GWA analyses were repeated in all three studies while adjusting for the SNPs that showed genome-wide significant association with iris color in the initial analyses. SNP-SNP interaction analysis was performed. General linear modeling was conducted where all possible multiplicative interaction terms were added to the model including the SNPs as main effects.
Analysis of Predictive Value
To investigate the value of the SNPs identified for the prediction of iris color, we constructed a prediction model in a random 50% sample of the Rotterdam study population (derivation data set) by logistic regression analysis. Separate models were constructed for brown and blue iris color (yes/no). The model was validated in the remaining 50% of the Rotterdam study (internal validation) and in the ERF study (external validation). For each individual, we calculated the probabilities of brown, intermediate, and blue irides. The predictive value was assessed by the area under the receiver operating characteristic curve (AUC),32 which is a measure of discriminative accuracy indicating the degree to which the predicted probabilities of having brown (or blue) irides can discriminate between individuals with brown (or blue) irides and those without. AUC ranges from 0.5 representing total lack of discrimination to 1.0 representing perfect discrimination.32
Spatial Autocorrelation and Correlation Analysis
Allele frequencies of rs916977 were obtained from genome-wide SNP data of 23 European populations (of which the Rotterdam study was one) as part of a different project described elsewhere (M.K., A.G.U., M. Balascakova, C. Becker, J. Bertranpetit, L.A. Bindoff, D. Comas, U. Gether, C. Gieger, G. Holmlund, A. Kouvatski, M. Krawczak, M. Macek, I. Mollet, M. Nelson, P. Nürnberg, W. Parson, R. Ploski, A. Ruether, A. Sajantila, S. Schreiber, A. Tagliabracci, T. Werge, and E. Wichmann, unpublished data). The spatial pattern of the allelic frequencies of the SNP rs916977 was analyzed by means of spatial autocorrelation33 with the PASSAGE program. This method plots the amount of autocorrelation (expressed as Moran's I index) between pairs of populations against their geographic distance. The shape of the autocorrelogram describes the geographical pattern of rs916977 allelic frequencies. Positive Moran's I values for short distances and negative for large geographic distances indicate a clinal pattern of the genetic data, starting from one side of the map to the opposite one. For correlation analysis, European iris color frequency distribution was obtained from a map published elsewhere,34 and the mean values of iris color frequency classes were assigned to each of the 23 populations studied genetically based on their geographic origin. A Pearson's correlation was performed between this inferred value of iris color phenotypes and the frequency of the C allele of rs916977 in each population.
Results
Genome-wide Association and Linkage Analysis
The design of our study is outlined in Figure 1. In the discovery step 1 of the study, we have conducted three genome-wide association and a genome-wide linkage analyses of iris color in inbred and outbred populations from the Netherlands. In our study design that targeted various quantitative trait loci, we aimed to combine the replication step of the GWA within our discovery step 1. The rationale of the design is that although false-positive findings may occur in the individual GWAs, it is unlikely that they have occurred at the same locus in the separate tiers unless there is a systematic bias within all GWAs. For GWA-ERF250K, we genotyped 250,000 SNPs of the Nsp array from the GeneChip Human Mapping 500K Array Set in a series of 192 distant relatives of the ERF study. For GWA-ERF318K, we genotyped 733 persons including close relatives of the ERF study with 318,000 markers of the Illumina Infinium whole-genome genotyping assay (HumanHap300-2). For GWA-Rdam500K, a total of 481 persons of the Rotterdam study were characterized with 500,000 SNPs of the GeneChip Human Mapping 500K Array Set. By combining the Affymetrix array, which includes random markers, with the Illumina tagging SNP array, we aimed to obtain to fine type the regions of interest in the gene discovery stage for the quantitative trait studied. To study the role of rare variants with a major effect, a whole-genome linkage analysis (GWL-ERF6K) was conducted additionally in a series of 1292 persons, including close relatives from the ERF study with 6000 SNPs (Illumina linkage panel) (although common variants can also show up in linkage analysis).
In GWA-ERF250K and GWA-Rdam500K, rs916977 located at 26.19 Mb of chromosome 15 showed the strongest association to iris color, reaching genome-wide significance (Figures 2, 3A, and 3B; Table 2). The SNP marker rs916977 is located in intron 12 of the HERC2 gene (MIM 605837). In GWA-Rdam500K, seven other HERC2 SNPs flanking rs916977 reached genome-wide significance (Figures 2 and 3B; Table 2). GWA-ERF318K showed genome-wide significant iris color association for 8 SNPs in HERC2 and 11 in OCA2 (Figures 2 and 3C; Table 2). The association was again strongest for markers in the HERC2 gene relative to those in the OCA2 gene (Figure 3C; Table 2). All together, we observed 26 SNPs, 15 in the HERC2 and 11 in the OCA2 gene, which showed genome-wide significant association to iris color in at least one of the three independent GWA studies. Markers overlapping between arrays with genome-wide significance in one GWA also showed genome-wide or nominal significance in the other GWAs (see Table 2). No other marker outside the HERC2 and OCA2 genes revealed genome-wide significant association to iris color in the three GWA studies. Also, the genome-wide linkage analysis (GWL-ERF6K) in 1292 participants of the ERF study showed only evidence for linkage with iris color to chromosome 15q13.1 with a LOD score of 29.4, spanning a large 38 cM region that includes the OCA2 and HERC2 genes (see Figure S1 available online). For no other region in the genome a LOD score of 3 or higher was reached. None of the genes previously implicated with iris color including MATP, ASIP, TYRP1, CYP1A2, CYP2C8, and CYP2C913,17,18 reached genome-wide significance in our three independent GWA studies, nor showed convincing evidence for linkage in the ERF linkage analysis. We repeated all GWA and the GWL analysis while conditioning on the significant effect of the SNPs in the OCA2/HERC2 region. No additional region with significant association to iris color was revealed in two of the GWAs (GWA-ERF250K and GWA-Rdam500K). In GWA-ERF318K, a SNP on chromosome 1 (rs2256956, not on Affymetrix arrays) appeared marginally significant on the genome-wide level (nominal p = 1.56 × 10⁻⁷, genome-wide p = 0.041). However, this region was not confirmed in the other two GWAs or in the GWL analysis. Performing the GWL analysis by including the SNP with the most significant linkage signal (rs4778137 in OCA2, LOD = 29.47) as covariate did not identify any additional linkage signals with LOD score > 3.3 (Figure S1).
Figure 2.
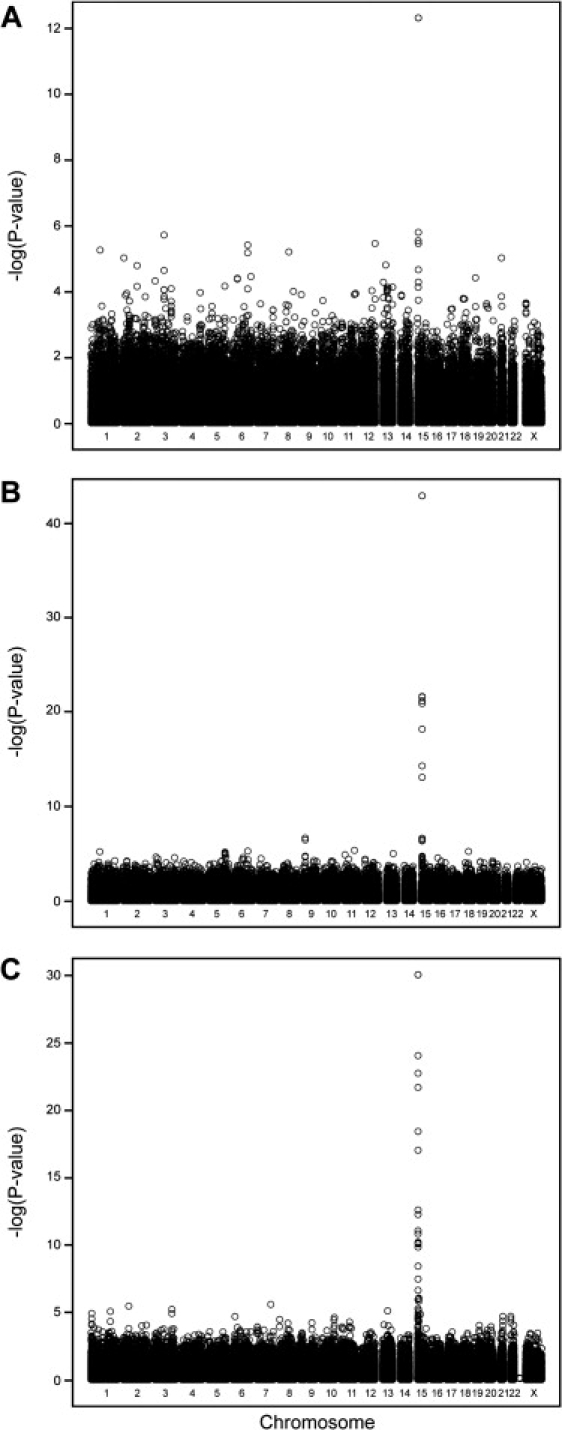
Genome-wide Association for Human Iris Color in Three Independent Population Samples from The Netherlands
(A) GWA-ERF250K: the ERF study (n = 192, distant relatives) with Affymetrix 250K SNPs.
(B) GWA-ERF318K: the ERF study (n = 733, related) with Illumina 318K SNPs.
(C) GWA-Rdam500K: the Rotterdam study (n = 481, unrelated) with Affymetrix 500K SNPs.
The x axis represents the chromosome, and the y axis shows −log10P in respect of iris color association.
Figure 3.

Single SNP and Haplotype Association Analysis for Human Iris Color in Three Independent Population Samples from The Netherlands in Region 25.0–26.8 Mb of Chromosome 15
(A) GWA-ERF250K.
(B) GWA-Rdam500K.
(C) GWA-ERF318K (no haplotypes were estimated in this family-based study).
The x axis represents the regional position on chromosome 15, and the y axis shows −log10P in respect of iris color association. The OCA2 and the HERC2 genes are highlighted with green and blue boxes, respectively. The −log10 P-values for haplotype analysis were truncated at 20.
(D) Number of regionally genotyped SNPs in HapMap Europeans and their locations.
(E) Regional genes and hypothetical proteins as well as their locations.
Table 2.
SNPs Reaching Genome-wide Significance to Iris Color in at Least One of the Three Independent GWAs
| GWA-ERF250K |
GWA-Rdam500K |
GWA-ERF318K |
||||||
|---|---|---|---|---|---|---|---|---|
| SNP | Position | Gene | p value | MAF | p value | MAF | p value | MAF |
| rs2594935 | 25858633 | OCA2 | NA | NA | 1.45E-10 | 0.30 | ||
| rs728405 | 25873448 | OCA2 | NA | NA | 3.75E-09 | 0.19 | ||
| rs3794604 | 25945660 | OCA2 | NA | NA | 8.50E-12 | 0.17 | ||
| rs4778232 | 25955360 | OCA2 | NA | NA | 2.47E-13 | 0.29 | ||
| rs1448485 | 25956336 | OCA2 | NA | 4.48E-07 | 0.13 | 3.39E-08 | 0.20 | |
| rs8024968 | 25957284 | OCA2 | NA | 3.33E-07 | 0.11 | 1.48E-11 | 0.17 | |
| rs1597196 | 25968517 | OCA2 | NA | NA | 9.10E-18 | 0.23 | ||
| rs7179994 | 25997365 | OCA2 | NA | NA | 5.35E-13 | 0.15 | ||
| rs4778138a | 26009415 | OCA2 | NA | NA | 8.58E-25 | 0.19 | ||
| rs4778241b | 26012308 | OCA2 | NA | NA | 3.66E-19 | 0.18 | ||
| rs7495174 | 26017833 | OCA2 | NA | NA | 1.97E-22 | 0.10 | ||
| rs7183877 | 26039328 | HERC2 | NA | NA | 6.18E-11 | 0.06 | ||
| rs6497287 | 26113882 | HERC2 | 5.20E-05 | 0.08 | 5.05E-15 | 0.06 | NA | |
| rs8041209 | 26117253 | HERC2 | 1.58E-06 | 0.06 | 6.60E-22 | 0.06 | NA | |
| rs8028689 | 26162483 | HERC2 | 3.48E-06 | 0.06 | 1.22E-21 | 0.06 | 7.15E-11 | 0.06 |
| rs2240204 | 26167627 | HERC2 | NA | NA | 7.15E-11 | 0.06 | ||
| rs6497292 | 26169790 | HERC2 | NA | 8.16E-14 | 0.12 | NA | ||
| rs2240202 | 26184490 | HERC2 | NA | 2.23E-22 | 0.06 | NA | ||
| rs916977 | 26186959 | HERC2 | 4.73E-13 | 0.18 | 1.19E-43 | 0.13 | 1.24E-39c | 0.22c |
| rs8039195 | 26189679 | HERC2 | NA | NA | 1.78E-23 | 0.13 | ||
| rs16950979 | 26194101 | HERC2 | NA | NA | 7.02E-11 | 0.06 | ||
| rs2346050 | 26196279 | HERC2 | 2.20E-05 | 0.05 | 6.32E-19 | 0.06 | NA | |
| rs16950987 | 26199823 | HERC2 | NA | NA | 8.28E-11 | 0.06 | ||
| rs1667394 | 26203777 | HERC2 | NA | NA | 8.47E-31 | 0.15 | ||
| rs12592730 | 26203954 | HERC2 | NA | 2.58E-22 | 0.06 | NA | ||
| rs1635168 | 26208861 | HERC2 | NA | NA | 1.48E-11 | 0.06 | ||
Genome-wide significance was defined with an empirical p value smaller than 0.05 as derived from 1000 genome-wide permutations. SNP positions according to Ensembl release 44, April 2007 (NCBI 36), NA = SNP not available in the corresponding array (GWA-ERF250K Affymetrix 250K Nsp, GWA-Rdam500K Affymetrix 500K, GWA-ERF318K Illumina 318K).
Identical to rs11855019.
Identical to rs6497268.
p value and MAF were derived by additional genotyping.
Next, we evaluated whether the association of the SNPs in the HERC2-OCA2 region could be explained by linkage disequilibrium between the markers tested or with the three SNPs in intron 1 of the OCA2 gene that were previously reported to be the most important determinants of iris color (rs11855019 identical to rs4778138, rs6497268 identical to rs4778241, and rs7495174).16 For this, we used the Affymetrix data of GWA-Rdam500K and the Illumina data of GWA-ERF318K and additionally genotyped rs11855019, rs6497268, and rs7495174 in both sample series if not included already. When analyzing only SNPs within OCA2 in the GWA-Rdam500K data, rs11855019 (nominal p = 5.39 × 10⁻⁹) and rs7495174 (nominal p = 5.72 × 10⁻⁵) showed the strongest evidence for association, confirming earlier findings.16 However, when we included HERC2 rs916977 in the regression analysis, it was by far the strongest determinant of iris color (p = 2.83 × 10⁻¹³), and OCA2 rs11855019 was the second strongest determinant with a much lower level of significance (p = 4.85 × 10⁻⁵). When all tagging SNPs of Illumina were tested simultaneously in a single regression model based on the GWA-ERF318K data, rs7495174 in OCA2 was found to be the marker most strongly associated to iris color (nominal p = 1.20 × 10⁻¹⁰), while the rs1667394 in HERC2 was the second-best SNP (nominal p = 4.66 × 10⁻⁶). HERC2 rs916977 was not genotyped in GWA-ERF318K. After genotyping of HERC2 rs916977 in the GWA-ERF318K samples, a strongly significant association to iris color was observed also in this population (p = 1.24 × 10−39) (Table 2). When analyzing HERC2 rs916977 together with OCA2 rs11855019, rs6497268, and rs7495174 in GWA-ERF318K, association remained significant on the genome-wide level only for HERC2 rs916977 (p = 3.53 × 10⁻¹⁸) but not for the three OCA2 SNPs (rs7495174, p = 1.17 × 10⁻⁴; rs11855019, p = 0.01; rs6497268, p = 0.17). Combining the evidence of GWA-Rdam500K and GWA-ERF318K, we observed that HERC2 shows association to iris color independent of OCA2. This finding is in line with the LD patterns in the GWA-ERF250K and the GWA-Rdam500K data sets (LD analysis was not performed for the GWA-ERF318K data set because it includes close relatives). The HERC2 SNP with strongest association to iris color (rs916977) appeared to be in a separate haploblock (Block 3) that was not in strong linkage disequilibrium with block 2 in both populations, the latter being closer to intron 1 of OCA2 (ERF study, r2 = 0.40; Rotterdam study, r2 = 0.39) (see Figure 4).
Figure 4.

Patterns of Linkage Disequilibrium in Region 25.86–26.19 Mb of Chromosome 15
Data from (A) HapMap Europeans, (B) GWA-ERF250K, and (C) GWA-Rdam500K. Locations of the OCA2 and the HERC2 genes are depicted on top. LD plots are arranged to each other according to the physical positions of the SNPs involved. The same SNP and block numbers were used for (B) and (C).
Population Studies and Prediction Analysis
To confirm the Step 1 findings described above, we genotyped in Step 2 all participants of the total ERF (n = 2217) and the total Rotterdam (n = 6056) study populations for HERC2 rs916977 and OCA2 rs11855019, rs6497268, and rs7495174.16 Ignoring linkage disequilibrium, all SNPs were strongly associated with iris color in both populations (5.0 × 10−76 < nominal p < 1.0 × 10−300; Table 3). When including all four SNPs together in the regression model, rs916977 (ERF, p < 2.02 × 10⁻³³; Rotterdam study, p < 5.84 × 10−113), rs11855019 (ERF, p < 2.63 × 10⁻⁹; Rotterdam study, p < 6.75 × 10⁻⁶), and rs7495174 (ERF, p < 9.71 × 10⁻⁹; Rotterdam study, p < 5.09 × 10⁻⁹) remained significantly associated to iris color, with HERC2 rs916977 being the most informative marker. rs6497268 was no longer significant (ERF, p = 0.097; Rotterdam study, p = 0.09). Additionally, we tested for epistasis between these four SNPs in the total Rotterdam study via a full model approach. rs916977 in HERC2 remained the strongest determinant (p = 7.9 × 10⁻⁸). rs11855019 and rs6497268 in OCA2 showed evidence for interaction (p = 2.2 × 10⁻⁴), the latter also with rs916977 in HERC2, although marginally (p = 0.04). All three markers also appeared in significant interaction (p = 0.01). The interaction may in part be explained by the existence of haplotypes. A haplotype analysis based on these four SNPs showed that the TGTC haplotype (rs11855019, rs6497268, rs7495174, and rs916977) was mostly found in individuals with blue irides, and in significantly lower frequency in those with brown and intermediate iris color (Table 4). Ten additional haplotypes were observed in the ERF and the Rotterdam study, of which nine had a higher frequency in individuals with brown iris color than in those with blue iris color in both populations.
Table 3.
Confirmation of Iris Color Association of Four SNPs from the OCA2-HERC2 Region in the Total ERF and Rotterdam Studies, Stage 2, and HapMap Genotype Frequencies for the SNPs Studied
| HapMap |
|||||||||||||||||
|---|---|---|---|---|---|---|---|---|---|---|---|---|---|---|---|---|---|
| ERF Study (n = 2217) |
Rotterdam Study (n = 6056) |
Europeans |
East Asiansa |
Africans |
|||||||||||||
| SNP | Geno type | n (%) | Blue | Intermediate | Brown | p Value | n (%) | Blue | Intermediate | Brown | p Value | n | Freq. (%) | n | Freq. (%) | n | Freq. (%) |
| rs11855019b,c | TT | 1440 (66.7) | 88.4 | 72.1 | 40.0 | 4.4 × 10−100 | 4580 (77.3) | 88.1 | 69.4 | 47.9 | 5.4 × 10−211 | 49 | 81.7 | 5 | 5.5 | 3 | 5.0 |
| TC | 655 (30.3) | 11.1 | 27.0 | 53.1 | 1250 (21.1) | 11.5 | 29.0 | 46.6 | 11 | 18.3 | 32 | 35.6 | 26 | 43.3 | |||
| CC | 64 (3.0) | 0.5 | 0.9 | 6.9 | 97 (1.6) | 0.4 | 1.6 | 5.5 | 0 | 0 | 53 | 58.9 | 31 | 51.7 | |||
| rs6497268b,d | GG | 1441 (66.7) | 86.8 | 68.1 | 44.2 | 5.0 × 10−76 | 4233 (72.1) | 85.7 | 57.5 | 38.0 | 2.8 × 10−267 | 45 | 75.0 | 2 | 2.2 | 8 | 13.3 |
| GT | 652 (30.2) | 12.6 | 29.7 | 49.5 | 1486 (25.3) | 13.6 | 39.5 | 54.0 | 15 | 25.0 | 24 | 26.7 | 30 | 50.0 | |||
| TT | 67 (3.1) | 0.6 | 2.2 | 6.3 | 151 (2.6) | 0.7 | 3.0 | 8.0 | 0 | 0 | 64 | 71.1 | 22 | 36.7 | |||
| rs7495174b | TT | 1749 (81.4) | 98.4 | 82.8 | 62.3 | 4.3 × 10−79 | 5273 (88.4) | 97.4 | 82.2 | 64.3 | 1.4 × 10−239 | 54 | 90.0 | 7 | 7.8 | 43 | 71.7 |
| TC | 382 (17.8) | 1.5 | 17.2 | 35.7 | 659 (11.0) | 2.6 | 17.5 | 33.4 | 6 | 10.0 | 38 | 42.2 | 16 | 26.7 | |||
| CC | 17 (0.8) | 0.1 | 0 | 2.0 | 34 (0.6) | 0 | 0.3 | 2.3 | 0 | 0 | 45 | 50.0 | 1 | 1.6 | |||
| rs916977e | CC | 1543 (70.9) | 94.4 | 71.9 | 44.8 | 1.9 × 10−113 | 4572 (77.4) | 94.2 | 58.6 | 35.2 | <1.0 × 10−300 | 44 | 73.3 | 2 | 2.2 | 0 | 0 |
| CT | 573 (26.3) | 5.4 | 27.7 | 48.4 | 1229 (20.8) | 5.6 | 39.8 | 58.1 | 16 | 26.7 | 28 | 31.1 | 6 | 10.0 | |||
| TT | 60 (2.8) | 0.2 | 0.4 | 6.8 | 105 (1.8) | 0.2 | 1.6 | 6.7 | 0 | 0 | 60 | 66.7 | 54 | 90.0 | |||
Combines Japanese and Chinese data.
Located in intron 1 of the OCA2 gene.
Identical to rs4778138.
Identical to rs4778241.
Located in intron 12 of the HERC2 gene.
Table 4.
Haplotype Distribution of Four SNPs from the OCA2-HERC2 Region in the Total ERF and Rotterdam Studies and HapMap
| ERF Study (n = 2217) |
Rotterdam Study (n = 6056) |
HapMap |
|||||||||
|---|---|---|---|---|---|---|---|---|---|---|---|
| Haplotype | All | Blue | Intermediate | Brown | All | Blue | Intermediate | Brown | Europeans | East Asiansa | Africans |
| TGTC | 75.5 | 92.0 | 79.4 | 55.6 | 81.2 | 91.2 | 72.1 | 55.3 | 82.5 | 11.6 | 5.0 |
| CTCT | 5.5 | 0.6 | 6.0 | 10.5 | 4.5 | 0.9 | 6.7 | 14.5 | 4.2 | 65.8 | 13.3 |
| TTTT | 4.6 | 1.6 | 5.2 | 7.6 | 4.3 | 1.5 | 8.7 | 10.5 | 5.8 | 10.1 | 18.0 |
| CTCC | 4.0 | 0.2 | 2.7 | 9.0 | 1.2 | 0.3 | 1.6 | 3.5 | 0 | 3.4 | 0 |
| TGCT | 0.1 | 0 | 0 | 0.3 | 0.3 | 0 | 0.5 | 1.1 | 0.8 | 1.2 | 1.7 |
| TGTT | 1.3 | 0.3 | 0.7 | 2.7 | 0.9 | 0.3 | 1.5 | 2.6 | 0 | 0.4 | 2.0 |
| CGTT | 3.9 | 0.3 | 2.2 | 8.7 | 1.7 | 0.3 | 2.7 | 5.5 | 2.5 | 1.7 | 29.7 |
| CGTC | 1.0 | 0.5 | 0.6 | 1.7 | 0.8 | 0.7 | 0.8 | 0.8 | 1.7 | 0 | 0 |
| TTTC | 0.3 | 0.1 | 0.3 | 0.4 | 1.0 | 0.8 | 0.8 | 1.9 | 1.7 | 0 | 0 |
| CTTC | 3.3 | 4.2 | 2.8 | 2.5 | 3.5 | 3.9 | 3.2 | 2.6 | 0.8 | 2.7 | 0 |
| CTTT | 0.5 | 0.1 | 0.3 | 1.0 | 0.6 | 0.1 | 1.4 | 1.7 | 0 | 2.4 | 30.3 |
| CGCT | 0 | 0 | 0 | 0 | 0 | 0 | 0 | 0 | 0 | 0.7 | 0 |
Haplotypes consist of SNPs in the following order: rs11855019 (identical to rs4778138), rs6497268 (rs4778241), rs7495174—all in the OCA2 gene—and rs916977 in the HERC2 gene. All haplotypes observed in either of the populations are shown; ERF study, p = 1.55 × 10−64; Rotterdam study, p = 5.07 × 10−253.
Combines Japanese and Chinese data.
We determined the predictive value of the three SNPs that remained associated with iris color (rs916977, rs11855019, and rs7495174). The AUC for the prediction of brown iris color was 0.80 in the derivation (or test) data set (50% of the Rotterdam Study), 0.82 in the internal validation data set of the Rotterdam study (remaining individuals), and 0.78 in the total ERF population. For blue iris color, these values were slightly lower but comparable (0.79, 0.79, and 0.75; data not shown). Based on the Rotterdam study, the predicted probability of brown iris color was 10.3% for homozygous carriers of the major rs916977 C allele, 63.3% for heterozygotes, and 84.7% for noncarriers. Figure 5 presents the predicted probabilities of brown iris color based for all combinations of the HERC2 rs916977 and the two OCA2 rs11855019 and rs7495174 markers, providing evidence for the strong effect of HERC2 rs916977.
Figure 5.

Step-wise Prediction Probabilities for Brown Iris Color
Analysis is based on three SNPs: rs916977 (HERC2), rs11855019 (OCA2), and rs7495174 (OCA2).
Spatial Distribution of rs916977 across Europe
We studied the allele frequencies of HERC2 rs916977 in 23 European populations (of which the Rotterdam study was one). We found that the C allele, associated with blue iris color in the ERF and Rotterdam study, was most frequent in northern Europe. The T allele, associated with brown iris color, was more frequent in southern Europe (Figure 6). To formally test the geographic distribution of HERC2 rs916977 across Europe, a spatial autocorrelation was performed. This analysis showed that HERC2 rs916977 follows a statistically significant gradient-wise (or clinal) distribution across Europe (Figure 6B). We furthermore inferred the iris color phenotypes from Figure 6A for the 23 populations genotyped and found a highly positive correlation between the allele distribution of HERC2 rs916977 and the distribution of iris color across Europe (Pearson's adjusted r2 = 0.59; p = 1.12 × 10−05).
Figure 6.

Allele Frequency Distribution of rs916977 across 23 European Populations and Spatial Autocorrelation Analysis
(A) HERC2 rs916977 allele frequencies superimposed on a map of Europe with indication of classes of human iris color phenotypes. Sizes of the pie charts indicate sample size. Map (without data on rs916977) published previously34 by Allyn and Bacon, Boston, MA. Copyright 1965 by Pearson Education. Reprinted by permission of the publisher.
(B) Spatial autocorrelation analysis of rs916977 allele frequencies across Europe.
Discussion
There are two main findings of our paper. First, our three independent GWA studies in the ERF and Rotterdam populations and our genome-wide linkage analysis in the ERF population showed that 15q13.1 is the most important region involved in human iris color. Although our findings confirm earlier microsatellite-based genome scans in twins,6,7 these are, to our knowledge, the first GWA studies addressing iris color in humans. Second, our two independent population-based studies and our correlation analysis in Europe showed that rs916977 in intron 12 of the HERC2 gene is a new and important determinant of human iris color variation. We observed a total of 15 SNPs in the HERC2 gene with genome-wide significant association to iris color in at least one of the three independent GWAs. HERC2 rs916977 and rs1667394 were the SNPs with the strongest association in the GWA-ERF318K study. However, taking into account the linkage disequilibrium in the region, HERC2 rs916977 appears the most important variant. rs916977 is located in intron 12 of the HERC2 gene and maps 169 kb 5′ proximal of the OCA2 gene, which was previously reported to be associated with human iris color.12,14–16,35 When we analyzed the HERC2 SNP rs916977 and the three most important OCA2 intron 1 SNPs reported in a previous study (rs11855019, rs6497268, and rs7495174),16 rs916977 of the HERC2 gene showed the lowest p value in both populations. Furthermore, of the three OCA2 SNPs tested, only two (rs11855019 and rs7495174) remained significantly associated to iris color when the HERC2 rs916977 was included in the model. Our analysis of epistatic effects suggests that there is evidence for interaction between OCA2 and HERC2. There were no other regions showing consistent genome-wide evidence for iris color association. The SNPs in genes suggested earlier with involvement in iris color did not contribute (MATP, ASIP, CYP1A2, TYRP1, CYP2C8, and CYP2C9).13,17,18
To date, we have no data on the functionality of HERC2 rs916977. The function of the HERC2 gene is still largely unknown. This gene encodes the HECT domain and RCC1-like domain containing protein 2 (or probable E3 ubiquitin-protein ligase HERC2) involved in protein trafficking. HERC2 might play a structural role in the genome and was identified as ancestral gene in regional duplication events leading to Prader-Willi syndrome (PWS [MIM 176270]) and Angelman syndrome (AS [MIM 105830]) in humans.36–38 Noteworthy, hypopigmentation is commonly described in both Prader-Willi as well as Angelman syndrome.39–41 The OCA2 gene, located 11.7 kb from the HERC2 gene, is known to be involved in oculocutaneous albinism Type II and encodes the P-protein.11 The most likely interpretation of our findings is that genetic variants regulating expression of the OCA2 gene exist in the HERC2 gene or, alternatively, within the 11.7 kb of sequence between the OCA2 and HERC2 genes. Examples of regulatory elements located distant of the regulated gene are known.42,43
In our study, iris color was classified as blue, intermediate, or brown by an ophthalmologist researcher at the center. A more detailed color variation exists for human irides. Because of the simplification of the phenotype to three color classes, we may have lost statistical power. However, it is unlikely that this classification has introduced false-positive findings. We showed a significant relation between the estimated frequency of the HERC2 rs916977 C allele and the prevalence of blue iris color as well as between the T allele and brown iris color in two populations from the Netherlands. We also showed a significant correlation between the distribution of HERC2 rs916977 allele frequencies and inferred iris color phenotypes in 23 European populations. Further, we showed that adding HERC2 genotypes to those of OCA2 improved the prediction of iris color substantially in two Dutch populations that differ in iris color distribution, suggesting that the predictive value of the markers is robust. It should be noted that our findings are limited to individuals of European descent. It remains to be determined whether our markers are also associated with brown iris color in non-European populations.
The CC genotype of HERC2 rs916977, associated with blue iris color in the two Dutch populations, occurred in 73.3% of the Hapmap Europeans (who are of northern and western origin) but only in 2.2% in the Asians and was not observed in the Africans (HapMap database). The C allele represents the derived state of rs916977. Together, our findings suggest that along with blue iris color, the HERC2 rs916977C genotype distribution was driven by positive selection in ancestral Europeans. This hypothesis is further supported by the haplotype data considering HERC2 rs916977 and the three SNPs from intron 1 of OCA2. The TGTC haplotype represents the derived alleles of all SNPs and is associated with blue iris color in our studies. This haplotype was found in 82.5% of the HapMap Europeans but only 11.6% of the Asians and 5% of the Africans (Table 4). In line with our findings, it was previously suggested that human iris (and hair) color variation evolved via sexual selection in early European hunter-gatherer populations.44,45 Our finding that the T allele of HERC2 rs916977, which represents the ancestral state of the marker, was associated with brown iris color corroborates with the view that brown iris color represents the ancestral phenotype in humans.
Searching for genes involved in human iris color, we followed successfully a two-step approach in which three GWA series with increasing numbers of persons and SNPs genotyped were studied simultaneously and the findings of two different genome-wide SNP arrays were combined. We identified the HERC2 gene as a novel and important determinant of human iris color variation on a genome-wide level in three independent studies from The Netherlands, in addition to OCA2 known before. Our findings suggest that genetic variants regulating expression of the OCA2 gene exist in the HERC2 gene or, alternatively, within the short sequence between the OCA2 and HERC2 genes, determining the variation in human iris color. Our data also suggest that markers from the HERC2 and OCA2 genes, in particular HERC2 rs916977, are of great value for the prediction of eye color in unknown persons, e.g., for forensic applications of human identification. However, until more data become available, such a DNA-based iris color prediction test shall only be considered in individuals of whom a European genetic origin has been verified with appropriate ancestry-informative genetic markers.
Supplemental Data
One supplemental figure can be found with this article online at http://www.ajhg.org/.
Supplemental Data
Web Resources
The URLs for data presented herein are as follows:
GenABEL (an R library for fast Genome-wide association analysis), http://mga.bionet.nsc.ru/nlru/GenABEL/ or from http://cran.r-project.org
haplo.stats (R library), http://mayoresearch.mayo.edu/mayo/research/schaid_lab/software.cfm
Haploview, http://www.broad.mit.edu/mpg/haploview
Online Mendelian Inheritance in Man (OMIM), http://www.ncbi.nlm.nih.gov/Omim
PedSTR, http://mga.bionet.nsc.ru/
Acknowledgments
We thank the patients and relatives from the ERF study and the Rotterdam study, the local healthcare centers, and the municipalities for making this study possible. Yavuz Ariyurek and Rudy Pijpers are acknowledged for expert technical assistance and Tom de Vries Lentsch for technical help with some figures. We are grateful to the following colleagues for their agreement in the use of rs916977 allele frequency data from various European populations: M. Balascakova, C. Becker, J. Bertranpetit, L.A. Bindoff, D. Comas, U. Gether, C. Gieger, G. Holmlund, A. Kouvatski, M. Krawczak, M. Macek, I. Mollet, M. Nelson, P. Nürnberg, W. Parson, R. Ploski, A. Ruether, A. Sajantila, S. Schreiber, A. Tagliabracci, T. Werge, and E. Wichmann. This study was supported by the Netherlands Forensic Institute and the Erasmus University Medical Center Rotterdam, and in part by the Translational Medicine Program of Affymetrix and Erasmus MC. The ERF and the Rotterdam study were supported by the Netherlands Organization for Scientific Research (NWO, 91203014, 175.010.2005.011, 91103012). The ERF study received additional support from the Center of Medical Systems Biology, Centre National de Genotypage, Evry Cedex, France, EUROSPAN, and the Swart van Essen and the Henkes Foundation, Rotterdam. The following participants in the Rotterdam study are acknowledged for financial contribution to the genome scan: M. Simoons, E. Sijbrands, A. van Belkum, J. Laven, E. Knipers, and B. Stricker. The Rotterdam study received additional support from the Foundations Neyenburgh and Bunnik; the Physico Therapeutic Institute, Rotterdam; and Topcon Europe BV, Capelle aan de IJssel, all in The Netherlands. None of the sponsors had any influence on the design or conduct of the study or the preparation of the manuscript.
References
- 1.Sturm R.A., Frudakis T.N. Eye colour: portals into pigmentation genes and ancestry. Trends Genet. 2004;20:327–332. doi: 10.1016/j.tig.2004.06.010. [DOI] [PubMed] [Google Scholar]
- 2.Imesch P.D., Bindley C.D., Khademian Z., Ladd B., Gangnon R., Albert D.M., Wallow I.H. Melanocytes and iris color. Electron microscopic findings. Arch. Ophthalmol. 1996;114:443–447. doi: 10.1001/archopht.1996.01100130439015. [DOI] [PubMed] [Google Scholar]
- 3.Wielgus A.R., Sarna T. Melanin in human irides of different color and age of donors. Pigment Cell Res. 2005;18:454–464. doi: 10.1111/j.1600-0749.2005.00268.x. [DOI] [PubMed] [Google Scholar]
- 4.Imesch P.D., Wallow I.H., Albert D.M. The color of the human eye: a review of morphologic correlates and of some conditions that affect iridial pigmentation. Surv. Ophthalmol. 1997;41(Suppl 2):S117–S123. doi: 10.1016/s0039-6257(97)80018-5. [DOI] [PubMed] [Google Scholar]
- 5.Bito L.Z., Matheny A., Cruickshanks K.J., Nondahl D.M., Carino O.B. Eye color changes past early childhood. The Louisville Twin Study. Arch. Ophthalmol. 1997;115:659–663. doi: 10.1001/archopht.1997.01100150661017. [DOI] [PubMed] [Google Scholar]
- 6.Zhu G., Evans D.M., Duffy D.L., Montgomery G.W., Medland S.E., Gillespie N.A., Ewen K.R., Jewell M., Liew Y.W., Hayward N.K. A genome scan for eye color in 502 twin families: most variation is due to a QTL on chromosome 15q. Twin Res. 2004;7:197–210. doi: 10.1375/136905204323016186. [DOI] [PubMed] [Google Scholar]
- 7.Posthuma D., Visscher P.M., Willemsen G., Zhu G., Martin N.G., Slagboom P.E., de Geus E.J., Boomsma D.I. Replicated linkage for eye color on 15q using comparative ratings of sibling pairs. Behav. Genet. 2006;36:12–17. doi: 10.1007/s10519-005-9007-x. [DOI] [PubMed] [Google Scholar]
- 8.Ramsay M., Colman M.A., Stevens G., Zwane E., Kromberg J., Farrall M., Jenkins T. The tyrosinase-positive oculocutaneous albinism locus maps to chromosome 15q11.2-q12. Am. J. Hum. Genet. 1992;51:879–884. [PMC free article] [PubMed] [Google Scholar]
- 9.Rinchik E.M., Bultman S.J., Horsthemke B., Lee S.T., Strunk K.M., Spritz R.A., Avidano K.M., Jong M.T., Nicholls R.D. A gene for the mouse pink-eyed dilution locus and for human type II oculocutaneous albinism. Nature. 1993;361:72–76. doi: 10.1038/361072a0. [DOI] [PubMed] [Google Scholar]
- 10.Spritz R.A., Fukai K., Holmes S.A., Luande J. Frequent intragenic deletion of the P gene in Tanzanian patients with type II oculocutaneous albinism (OCA2) Am. J. Hum. Genet. 1995;56:1320–1323. [PMC free article] [PubMed] [Google Scholar]
- 11.Brilliant M.H. The mouse p (pink-eyed dilution) and human P genes, oculocutaneous albinism type 2 (OCA2), and melanosomal pH. Pigment Cell Res. 2001;14:86–93. doi: 10.1034/j.1600-0749.2001.140203.x. [DOI] [PubMed] [Google Scholar]
- 12.Rebbeck T.R., Kanetsky P.A., Walker A.H., Holmes R., Halpern A.C., Schuchter L.M., Elder D.E., Guerry D. P gene as an inherited biomarker of human eye color. Cancer Epidemiol. Biomarkers Prev. 2002;11:782–784. [PubMed] [Google Scholar]
- 13.Frudakis T., Thomas M., Gaskin Z., Venkateswarlu K., Chandra K.S., Ginjupalli S., Gunturi S., Natrajan S., Ponnuswamy V.K., Ponnuswamy K.N. Sequences associated with human iris pigmentation. Genetics. 2003;165:2071–2083. doi: 10.1093/genetics/165.4.2071. [DOI] [PMC free article] [PubMed] [Google Scholar]
- 14.Duffy D.L., Box N.F., Chen W., Palmer J.S., Montgomery G.W., James M.R., Hayward N.K., Martin N.G., Sturm R.A. Interactive effects of MC1R and OCA2 on melanoma risk phenotypes. Hum. Mol. Genet. 2004;13:447–461. doi: 10.1093/hmg/ddh043. [DOI] [PubMed] [Google Scholar]
- 15.Frudakis T., Terravainen T., Thomas M. Multilocus OCA2 genotypes specify human iris color. Hum. Genet. 2007;122:311–326. doi: 10.1007/s00439-007-0401-8. [DOI] [PubMed] [Google Scholar]
- 16.Duffy D.L., Montgomery G.W., Chen W., Zhao Z.Z., Le L., James M.R., Hayward N.K., Martin N.G., Sturm R.A. A three-single-nucleotide polymorphism haplotype in intron 1 of OCA2 explains most human eye-color variation. Am. J. Hum. Genet. 2007;80:241–252. doi: 10.1086/510885. [DOI] [PMC free article] [PubMed] [Google Scholar]
- 17.Kanetsky P.A., Swoyer J., Panossian S., Holmes R., Guerry D., Rebbeck T.R. A polymorphism in the agouti signaling protein gene is associated with human pigmentation. Am. J. Hum. Genet. 2002;70:770–775. doi: 10.1086/339076. [DOI] [PMC free article] [PubMed] [Google Scholar]
- 18.Graf J., Hodgson R., van Daal A. Single nucleotide polymorphisms in the MATP gene are associated with normal human pigmentation variation. Hum. Mutat. 2005;25:278–284. doi: 10.1002/humu.20143. [DOI] [PubMed] [Google Scholar]
- 19.Aulchenko Y.S., Heutink P., Mackay I., Bertoli-Avella A.M., Pullen J., Vaessen N., Rademaker T.A., Sandkuijl L.A., Cardon L., Oostra B., van Duijn C.M. Linkage disequilibrium in young genetically isolated Dutch population. Eur. J. Hum. Genet. 2004;12:527–534. doi: 10.1038/sj.ejhg.5201188. [DOI] [PubMed] [Google Scholar]
- 20.Hofman A., Grobbee D.E., de Jong P.T., van den Ouweland F.A. Determinants of disease and disability in the elderly: the Rotterdam Elderly Study. Eur. J. Epidemiol. 1991;7:403–422. doi: 10.1007/BF00145007. [DOI] [PubMed] [Google Scholar]
- 21.Pardo L.M., MacKay I., Oostra B., van Duijn C.M., Aulchenko Y.S. The effect of genetic drift in a young genetically isolated population. Ann. Hum. Genet. 2005;69:288–295. doi: 10.1046/j.1529-8817.2005.00162.x. [DOI] [PubMed] [Google Scholar]
- 22.Service S., DeYoung J., Karayiorgou M., Roos J.L., Pretorious H., Bedoya G., Ospina J., Ruiz-Linares A., Macedo A., Palha J.A. Magnitude and distribution of linkage disequilibrium in population isolates and implications for genome-wide association studies. Nat. Genet. 2006;38:556–560. doi: 10.1038/ng1770. [DOI] [PubMed] [Google Scholar]
- 23.Miller S.A., Dykes D.D., Polesky H.F. A simple salting out procedure for extracting DNA from human nucleated cells. Nucleic Acids Res. 1988;16:1215. doi: 10.1093/nar/16.3.1215. [DOI] [PMC free article] [PubMed] [Google Scholar]
- 24.Purcell S., Neale B., Todd-Brown K., Thomas L., Ferreira M.A.R., Bender D., Maller J., de Bakker P.I.W., Daly M.J., Sham P.C. PLINK: a toolset for whole-genome association and population-based linkage analyses. Am. J. Hum. Genet. 2007;81:559–575. doi: 10.1086/519795. [DOI] [PMC free article] [PubMed] [Google Scholar]
- 25.Aulchenko Y.S., Ripke S., Isaacs A., van Duijn C.M. GenABEL: an R library for genome-wide association analysis. Bioinformatics. 2007;23:1294–1296. doi: 10.1093/bioinformatics/btm108. [DOI] [PubMed] [Google Scholar]
- 26.Devlin B., Roeder K. Genomic control for association studies. Biometrics. 1999;55:997–1004. doi: 10.1111/j.0006-341x.1999.00997.x. [DOI] [PubMed] [Google Scholar]
- 27.Steinthorsdottir V., Thorleifsson G., Reynisdottir I., Benediktsson R., Jonsdottir T., Walters G.B., Styrkarsdottir U., Gretarsdottir S., Emilsson V., Ghosh S. A variant in CDKAL1 influences insulin response and risk of type 2 diabetes. Nat. Genet. 2007;39:770–775. doi: 10.1038/ng2043. [DOI] [PubMed] [Google Scholar]
- 28.Patterson N., Price A.L., Reich D. Population structure and eigenanalysis. PLoS Genet. 2006;2:e190. doi: 10.1371/journal.pgen.0020190. [DOI] [PMC free article] [PubMed] [Google Scholar]
- 29.Schaid D.J., Rowland C.M., Tines D.E., Jacobson R.M., Poland G.A. Score tests for association between traits and haplotypes when linkage phase is ambiguous. Am. J. Hum. Genet. 2002;70:425–434. doi: 10.1086/338688. [DOI] [PMC free article] [PubMed] [Google Scholar]
- 30.Gabriel S.B., Schaffner S.F., Nguyen H., Moore J.M., Roy J., Blumenstiel B., Higgins J., DeFelice M., Lochner A., Faggart M. The structure of haplotype blocks in the human genome. Science. 2002;296:2225–2229. doi: 10.1126/science.1069424. [DOI] [PubMed] [Google Scholar]
- 31.Almasy L., Blangero J. Multipoint quantitative-trait linkage analysis in general pedigrees. Am. J. Hum. Genet. 1998;62:1198–1211. doi: 10.1086/301844. [DOI] [PMC free article] [PubMed] [Google Scholar]
- 32.Hanley J.A., McNeil B.J. The meaning and use of the area under a receiver operating characteristic (ROC) curve. Radiology. 1982;143:29–36. doi: 10.1148/radiology.143.1.7063747. [DOI] [PubMed] [Google Scholar]
- 33.Sokal R.R., Oden N.L. Spatial autocorrelation in biology 1. Methodology. Biol. J. Linnean Soc. 1978;10:199–228. [Google Scholar]
- 34.Beals R.L., Hoijer H. Allyn and Bacon; Boston, MA: 1965. An Introduction to Anthropology. [Google Scholar]
- 35.Jannot A.S., Meziani R., Bertrand G., Gerard B., Descamps V., Archimbaud A., Picard C., Ollivaud L., Basset-Seguin N., Kerob D. Allele variations in the OCA2 gene (pink-eyed-dilution locus) are associated with genetic susceptibility to melanoma. Eur. J. Hum. Genet. 2005;13:913–920. doi: 10.1038/sj.ejhg.5201415. [DOI] [PubMed] [Google Scholar]
- 36.Ji Y., Walkowicz M.J., Buiting K., Johnson D.K., Tarvin R.E., Rinchik E.M., Horsthemke B., Stubbs L., Nicholls R.D. The ancestral gene for transcribed, low-copy repeats in the Prader-Willi/Angelman region encodes a large protein implicated in protein trafficking, which is deficient in mice with neuromuscular and spermiogenic abnormalities. Hum. Mol. Genet. 1999;8:533–542. doi: 10.1093/hmg/8.3.533. [DOI] [PubMed] [Google Scholar]
- 37.Ji Y., Rebert N.A., Joslin J.M., Higgins M.J., Schultz R.A., Nicholls R.D. Structure of the highly conserved HERC2 gene and of multiple partially duplicated paralogs in human. Genome Res. 2000;10:319–329. doi: 10.1101/gr.10.3.319. [DOI] [PMC free article] [PubMed] [Google Scholar]
- 38.Chai J.H., Locke D.P., Greally J.M., Knoll J.H., Ohta T., Dunai J., Yavor A., Eichler E.E., Nicholls R.D. Identification of four highly conserved genes between breakpoint hotspots BP1 and BP2 of the Prader-Willi/Angelman syndromes deletion region that have undergone evolutionary transposition mediated by flanking duplicons. Am. J. Hum. Genet. 2003;73:898–925. doi: 10.1086/378816. [DOI] [PMC free article] [PubMed] [Google Scholar]
- 39.Butler M.G. Hypopigmentation: a common feature of Prader-Labhart-Willi syndrome. Am. J. Hum. Genet. 1989;45:140–146. [PMC free article] [PubMed] [Google Scholar]
- 40.Wiesner G.L., Bendel C.M., Olds D.P., White J.G., Arthur D.C., Ball D.W., King R.A. Hypopigmentation in the Prader-Willi syndrome. Am. J. Hum. Genet. 1987;40:431–442. [PMC free article] [PubMed] [Google Scholar]
- 41.King R.A., Wiesner G.L., Townsend D., White J.G. Hypopigmentation in Angelman syndrome. Am. J. Med. Genet. 1993;46:40–44. doi: 10.1002/ajmg.1320460109. [DOI] [PubMed] [Google Scholar]
- 42.Staehling-Hampton K., Proll S., Paeper B.W., Zhao L., Charmley P., Brown A., Gardner J.C., Galas D., Schatzman R.C., Beighton P. A 52-kb deletion in the SOST-MEOX1 intergenic region on 17q12-q21 is associated with van Buchem disease in the Dutch population. Am. J. Med. Genet. 2002;110:144–152. doi: 10.1002/ajmg.10401. [DOI] [PubMed] [Google Scholar]
- 43.Lettice L.A., Heaney S.J., Purdie L.A., Li L., de Beer P., Oostra B.A., Goode D., Elgar G., Hill R.E., de Graaff E. A long-range Shh enhancer regulates expression in the developing limb and fin and is associated with preaxial polydactyly. Hum. Mol. Genet. 2003;12:1725–1735. doi: 10.1093/hmg/ddg180. [DOI] [PubMed] [Google Scholar]
- 44.Cavalli-Sforza L.L., Menozzi P., Piazza A. Princeton University Press; Princeton: 1994. The History and Geography of Human Genes. [Google Scholar]
- 45.Frost P. European hair and eye color. A case of frequency-dependent sexual selection? Evol. Hum. Behav. 2006;27:85–103. [Google Scholar]
Associated Data
This section collects any data citations, data availability statements, or supplementary materials included in this article.