

Abstract
Osteoarthritis (OA), the most prevalent form of arthritis in the elderly, is characterized by the degradation of articular cartilage and has a strong genetic component. Our aim was to identify genetic variants involved in risk of knee OA in women. A pooled genome-wide association scan with the Illumina550 Duo array was performed in 255 controls and 387 cases. Twenty-eight variants with p < 1 × 10⁻⁵ were estimated to have probabilities of being false positives ≤0.5 and were genotyped individually in the original samples and in replication cohorts from the UK and the U.S. (599 and 272 cases, 1530 and 258 controls, respectively). The top seven associations were subsequently tested in samples from the Netherlands (306 cases and 584 controls). rs4140564 on chromosome 1 mapping 5′ to both the PTGS2 and PLA2G4A genes was associated with risk of knee OA in all the cohorts studied (overall odds ratio ORmh = 1.55 95% C.I. 1.30–1.85, p < 6.9 × 10⁻⁷). Differential allelic expression analysis of PTGS2 with mRNA extracted from the cartilage of joint-replacement surgery OA patients revealed a significant difference in allelic expression (p < 1.0 × 10⁻⁶). These results suggest the existence of cis-acting regulatory polymorphisms that are in, or near to, PTGS2 and in modest linkage disequilibrium with rs4140564. Our results and previous studies on the role of the cyclooxygenase 2 enzyme encoded by PTGS2 underscore the importance of this signaling pathway in the pathogenesis of knee OA.
Introduction
Osteoarthritis (OA [MIM 165720]) of the knee is a common complex disorder resulting in joint disability with known constitutional and environmental risk factors for development and progression, such as age, obesity, hormonal status, bone density, physical activity, and past history of trauma.1 Knee OA also has an important genetic component, and several studies have investigated the role of candidate genes in the risk of hip and knee OA. Several genes with common polymorphisms consistently affecting risk of OA have been reported to date (e.g., 2–6). In general, the genetic variants involved do not have large attributable risks. Rather, in common with other complex traits, the increased risks for carrying a predisposing genetic variant appear to be fairly modest, with most of them having odds ratios between 1.3 and 2.0, suggesting that a large number of genes each with relatively modest effect are contributing to the genetic etiology of OA.7
To date, two large case-control association scans have been reported. Mototani and coworkers8 tested 72,000 markers for association with hip OA, and identified a variant in the calmodulin 1 (CALM1 [MIM 114180]) gene to be strongly associated in the Japanese population. However, studies in UK samples failed to show an association of this variant with hip9 or knee OA.3 Spector and coworkers10 examined 25,000 genic SNPs for association with radiographic knee osteoarthritis in men and women from the UK and identified a SNP in a gene of unknown function (the leucine-rich repeats and calponin homology domain-containing 1, LRCH1 [MIM 610368]). That genetic variant has failed to show an association in subsequent studies in both Asian and European samples.11,12 To our knowledge, to date no large-scale genome-wide association scan with extensive coverage (i.e., 100,000 or more markers) of knee OA has been carried out.
In this study, we report a large-coverage pooled genome-wide association scan (GWAS) of knee OA and the results of successively testing individually the most highly associated SNPs in five case-control studies.
Material and Methods
Study Subjects
We combined data from five independent cohorts into a discovery sample, a UK replication cohort, a U.S. replication cohort, and a Dutch replication cohort (see Figure 1). The numbers of cases and controls from each cohort used in the discovery and replication samples is shown in Table 1. All study subjects were of self-reported white ethnicity.
Figure 1.
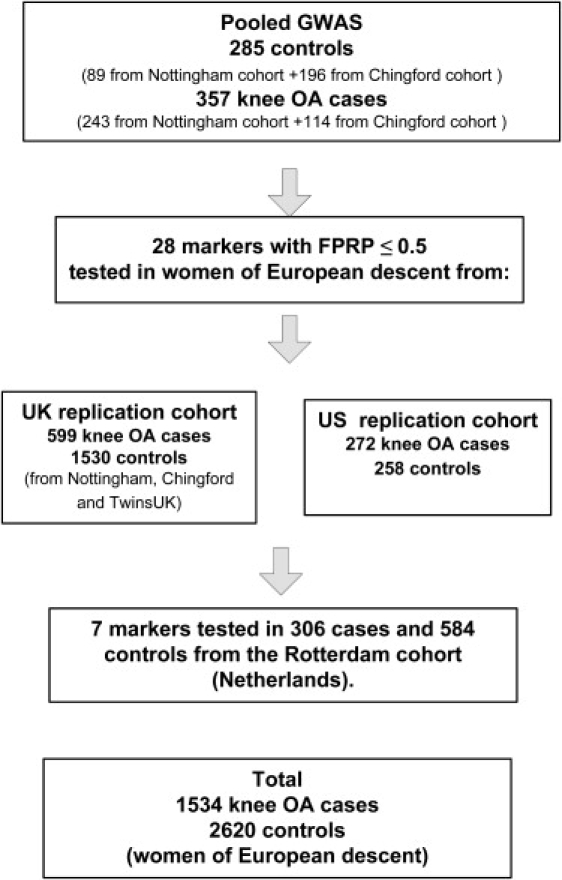
Study Strategy Used for Discovery and Replication
Table 1.
Descriptive Characteristics of Study Subjects by Cohort of Origin
| Cohort (Country of Origin) | Diagnosis Criteria | Number in Discovery Sample (Pooled GWAS) | Number in Replication Studies | Number in Meta-analysis | Age Years (SD) | BMI kg/m2 (SD) |
|---|---|---|---|---|---|---|
| Chingford study (UK) | Population-based, radiographic knee OA | 114 Fa OA, 196 F controls | 146 F OA, 243 F controls | 260 F OA, 439 F controls | 64.0 years (SD = 6.0) | 26.7 kg/m2 (SD = 4.6). |
| Case control (UK) | Clinical knee OA and age-matched controls | 243 F OA, 52 F controls, 37 Ma controls | 258 F OA, 402 F controls | 501 F OA, 454 F OA | 73.0 years (SD = 8.5) | 27.7 kg/m2 (SD = 4.7) |
| TwinsUK (UK) | Population-based, radiographic knee OA | 0 | 195 F OA, 885 F controls | 165b F OA, 679b F controls | 65.0 years (SD = 13.1) | 25.1 kg/m2 (SD = 4.4) |
| Case control (US) | Clinical knee OA and age-matched controls | 0 | 272 F OA, 258 F controls | 272 F OA, 258 F controls | 60.5 years (SD = 8.9) | 28.8 kg/m2 (SD = 4.9) |
| Rotterdam study (Netherlands) | Population-based, radiographic knee OA | 0 | 306 F OA, 584 F controls | 306 F OA, 584 F controls | 68.3 years (SD = 8.0) | 26.7 kg/m2 (SD = 4.1) |
F, female; M, male.
Number of singletons.
Definitions of OA
All affected individuals taking part in this study had standardized extended weight bearing anteroposterior radiographs of their knees. Two different definitions of OA were used, clinical OA for the UK and US case controls and radiographic OA for the TwinsUK, Chingford, and Rotterdam population-based studies (Table 1).
Clinical OA was defined by American College of Rheumatology criteria,13 namely, patients had knee pain due to OA on most days during at least 1 month in a 3 month period prior to screening, with the addition of at least one of the following: age >50 years, morning knee stiffness lasting >30 min, or knee crepitus.
For radiographic OA, the description of scoring of the radiographs is described elsewhere in detail.14,15 Radiographs were scored for the presence of radiographic OA (ROA) of the knee according to the Kellgren/Lawrence (K/L) score.16 Knee OA was defined as a K/L score ≥2 of one or both joints.
The number of patients and controls from each cohort taking part in the discovery and replication studies, the diagnosis criteria, and their descriptive characteristics are shown in Table 1. Specific characteristics of each cohort are summarized below.
UK Case-Control Study
Women affected by knee OA cases were recruited in Nottingham both from families with a history of OA and from clinic populations. All research participants gave written informed consent to take part. The study protocol was approved by the Leicestershire, Northamptonshire and Rutland Research Ethics Committee.
U.S. Case-Control Study
Female knee OA patients attending clinics in the mid-Atlantic region of the U.S. (Maryland and North Carolina) provided written informed consent before entering the study, which was conducted in accordance with International Conference on Harmonization of Technical Requirements for Registration of Pharmaceuticals for Human Use Guidelines for Good Clinical Practice and was administered by the institutional review boards. Controls were U.S. white women over the age of 50 not diagnosed for OA.
The Rotterdam Study
The Rotterdam study is a prospective, population-based cohort investigating determinants, incidence, and progression of chronic disabling diseases in the elderly. The rationale and study design have been described previously.17 The medical ethics committee of Erasmus University Medical School approved the study, and written informed consent was obtained from each participant.
The Chingford Study
The Chingford study is a prospective population-based longitudinal cohort of women who were derived from the age/sex register of a large general practice in North London and who are representative of the general UK population in terms of weight, height, and smoking characteristics.18 The study design and rationale are described elsewhere in detail.19 The Guys and St Thomas' Trust and Waltham Forest Trust ethics committees approved the study protocol. After study procedures were explained to participants, they gave written consent.
TwinsUK
Participants were derived from the TwinsUK Adult Twin Registry (Twin Research and Genetic Epidemiology Unit, St Thomas Hospital, London, UK), a volunteer sample previously developed to study the heritability and genetics of age-related diseases. These twins, without selecting for particular diseases or traits, were recruited from the general population through a series of national media campaigns in the UK20 and were shown to be comparable with age-matched population singletons in terms of disease-related and lifestyle characteristics.21 The study was approved by St Thomas' Hospital Research Ethics Committee, and all twins provided informed written consent.
Statistical Methods
Detection of Association from Pools
The difference in allele frequency between pools was expressed as a Z score given by z = |fcases − fcontrols|/σ where fcases is the estimated frequency of a SNP allele in cases, fcontrols is the same in controls, and σ is a standard deviation given by both the sampling error and the error owing to imprecise measurement of the allele frequency in a pool as described in detail in 22.
False-Positive Report Probabilities
False-positive report probabilities were computed for the highest Z scores coming out of the GWAS pooled analysis as described by Wacholder et al.23 with the estimated allele frequencies from pools to estimate odds ratios and confidence intervals and the p value corresponding to the Z scores.
Individual Polymorphism Genetic Associations
The association between individual SNP genotypes and OA was tested by comparing SNP allele frequencies among cases and controls with a Pearson's chi-square test. Odds ratios with the corresponding 95% confidence intervals were also computed. Twins in a pair are not independent and 255 twin pairs are part of the samples from the TwinsUK cohort, to account for nonindependence; the family of origin was included as a random effect in a mixed effects logistic regression model, with affected status being the outcome variable.
Correction for Multiple Testing
The false discovery rate probability method (FDR)24 was used to adjust for multiple testing for the replication genotypes carried out.
Fixed Effect Meta-analyses
To assess the overall evidence of association, we constructed a Mantel-Haenszel meta-analysis of data from all cohorts. We used the Mantel-Haenszel chi-square test and the Mantel-Haenszel estimate of the odds ratio25 to provide a summary test and odds ratio. Because twins in a pair are not independent for the TwinsUK sample, the average value of both twins (both affected or both controls) of the 255 twin pairs included was used, so that each of the 255 twin pairs counted as a single individuals for the meta-analysis (Table 1).
Laboratory Methods
Pooled Genotyping
The pools compared consisted of 255 controls and 387 cases affected with either radiographic or clinical OA of the knee (Table 1).
Genomic DNA samples were electrophoresed on 1.5% agarose gels, and samples with intact genomic DNA showing no evidence of contamination by RNA or of DNA degradation as revealed by smearing on agarose-gel electrophoresis were selected for pooling. Intact genomic DNA was diluted to 50 ng/ul concentration on the basis of Quant-iT Picogreen (Invitrogen, Eugene, OR, USA) quantitation, and then concentration was confirmed by repeating the picogreen analysis. Concentrations were adjusted on the basis of these results, and picogreen analysis was repeated. This process was repeated until all samples consistently measured 50 ng/ul. We constructed pools by combining equal volumes of each DNA. All pipetting steps were of volumes greater than 2 ml for minimization of pipetting error. Four replicates from each pool were prepared and hybridized to the Illumina HumanHap550-Duo Genotyping BeadChip microarray (Illumina, San Diego, CA, USA), according to the manufacturer's protocols. The Illumina genotype calling algorithm was modified as previously described,22 in order to maximize its accuracy in the context of pooled DNA genotyping.
Estimates of allele frequencies were obtained on the basis of the hybridization intensities from the two probes corresponding to each SNP allele. Median signal was determined for both alleles for genotypes AA, AB, and BB for each SNP, enabling us to compute the corresponding relative allele signal, and this was then used to estimate the allele frequency as has been described in detail previously.22
Approximately 64,000 SNPs were removed from the list for different reasons: low informativeness among individuals of European descent (MAF ≤ 1%), high level of noise, which was determined by comparing allele frequency of the same SNP in the same pool but using data from the different chips (SNPs with a standard deviation of allele frequency above 10%), or because they were in total LD with other SNPs in the list. For some SNPs, when the allele frequency was measured on different chips, some strong outliers were observed and such SNPs were excluded. Because 37 men were part of the controls in the pools but no males were included in the cases, markers from the X chromosome were not considered for analysis. The total number of markers analyzed was therefore 413,461.
Individual Genotyping
All samples except those from the Rotterdam cohort were carried out by Kbioscience, Hertfordshire, UK. SNPs were genotyped with the KASPar chemistry, which is a competitive allele-specific PCR SNP genotyping system using FRET quencher cassette oligos. Genotyping accuracy, as determined from the genotype concordance between duplicate samples, was 99.6%. The genotyping success rate was 97.9%. All polymorphisms were in Hardy-Weinberg equilibrium in controls (all p > 0.05). Genotyping in the Rotterdam cohort was performed with the Illumina HumanHap 550 SNP array.
Gene-Expression Studies
For gene-expression studies, articular chondrocytes were isolated from femoral cartilage obtained from patients with osteoarthritis undergoing knee-replacement surgery (one female aged 70 years and four males, one aged 66, two aged 73, and one aged 89 years) as described previously.26 RNA from freshly isolated chondrocytes was obtained with QIAGEN RNAeasy (QIAGEN, Venlo, The Netherlands) kit according to the manufacturer's protocol. After reverse transcription with a RevertAid H Minus complementary DNA (cDNA) synthesis kit (Fermentas, St. Leon-Rot, Germany), cDNA templates were used for PCR. Primers were designed with Vector NTI (Invitrogen, Carlsbad, CA, USA). The expression of the prostaglandin endoperoxide synthase 2 (PTGS2 [MIM 600262]) and the phospholipase A2, group IVA (PLA2G4A [MIM 600522]) genes was investigated. Primer sequences were PTGS2 sense primer 5′-AAGTCCCTGAGCATCTACGG-3′, PTGS2 antisense primer 5′-ATGCCAGTGATAGAGGGTGTT-3′, PLA2G4A sense primer 5′-TTGCTGGTCTTTCTGGCTC-3′, and PLA2G4A antisense primer 5′-TTCATCATCACTGTCCGAGC-3′. Complementary DNA was mixed with 0.5 units of Taq polymerase (Eurogentec, Seraing, Belgium), 0.2 mM dNTP, 0.5 M specific primers, and 1.5 mM MgCl2. For PTGS2 and PLA2G4A, annealing temperatures of 55°C and 60°C were used, respectively. PCRs were run for 30 cycles and products were visualized on 1.2% agarose gels.
Allelic Expression Analysis
By using a protocol described previously,27 we extracted nucleic acid from articular cartilage of UK OA patients who had undergone hip- or knee-replacement surgery (THR and TKR, respectively). The cartilage genomic DNA was used to genotype the patients for SNP rs5275, which is located in the 3′ UTR of PTGS2, and for SNP rs4140564, which is located 5′ to PTGS2. Three THR (all females) and three TKR (two females and one male) patients were identified as compound heterozygous for both SNPs, whereas one THR (female) and two TKR (one female and one male) patients were identified as heterozygous for SNP rs5275 but homozygous (TT) for SNP rs4140564. The cartilage RNA from these nine patients was then taken forward for an allelic expression analysis using a single base extension (SBE) assay that we have described in detail previously.28 At least 240 ng of RNA was used for the cDNA synthesis with random hexamers and the SuperScript kit (Invitrogen, Paisley, UK). Two reverse transcription (RT) reactions were performed for each patient: with (+RT) and without (−RT) reverse transcriptase. From each +RT reaction, ≥19 individual PCR amplifications were carried out with forward primer 5′-ACTGTCGATGTTTCCAATGC-3′ and reverse primer 5′-CAAACAAGCTTTTACAGGTG-3′, both located in the 3′ UTR of PTGS2. The (−RT) controls did not yield detectable PCR products. The primer 5′-CTAATGTTTGAAATTTTAAAGTACTTTTGGT-3′, which is located immediately adjacent to SNP rs5275, was used for the SBE assay. To ascertain the peak pattern for an assumed 1:1 ratio between alleles, we performed five individual PCR and SBE reactions on the cartilage genomic DNA of each of the nine patients to yield a total of 45 individual genomic DNA measurements. The same PCR primers and SBE primer were used for the cDNA and genomic template. By employing the same analytic conditions for the cDNA and genomic DNA measurements, we were able to use the average of the 45 genomic DNA allelic ratio measurements (representing the assumed 1:1 ratio between alleles) to correct the allelic ratios obtained from the cDNA measurements and thus to account for differences in fluorescent yield and terminator-dye incorporation specific to the assay. Such correction allowed us to obtain exact values of the relative allelic expression of each cDNA measurement. To determine whether there was a significant difference in allelic expression for each patient, we compared the cDNA allelic ratios for that patient to the pooled genomic allelic ratios by using a two-tailed Mann-Whitney exact test.
Results
None of the SNPs tested in the pooled genome-wide scan achieved p values that could be considered as genome-wide significant with a Bonferroni correction for multiple tests i.e., log10p = −6.92 (not shown). We thus selected the genetic variants with a high likelihood of being truly associated with disease by using the false-positive rate probability method (FPRP) developed by Wacholder et al.23 In total, 28 SNPs resulted from this GWAS that had FPRP ≤ 0.5 (Table 2). These SNPs were individually genotyped in the samples used for the pools and also in an additional 1530 controls and 599 cases from the UK and 272 cases and 258 controls from the U.S. as shown in Figure 1. The 37 male controls in the pools were also individually genotyped, and allele frequencies were found to be the same as in female controls. However, for consistency we did not include data from male samples in any of the subsequent analyses (Table 1).
Table 2.
SNPs from Pooled GWAS Selected to be Tested in Additional Samples
| SNP | Odds Ratio | 95% | C.I. | Z Score | −log10 P | FPRP with π = 0.0005 | Chr | Position | Nearest Gene(s) |
|---|---|---|---|---|---|---|---|---|---|
| rs4140564 | 3.34 | 1.89 | 5.92 | 4.312 | 5.09 | 0.124 | 1 | 184991626 | PLA2G4A/PTGS2 |
| rs1539414 | 1.67 | 1.19 | 2.33 | 4.170 | 4.82 | 0.288 | 1 | 194475163 | DENND1B |
| rs12041748 | 2.39 | 1.59 | 3.59 | 4.654 | 5.79 | 0.104 | 1 | 235550588 | RYR2 |
| rs7581129 | 0.41 | 0.25 | 0.66 | 4.167 | 4.81 | 0.498 | 2 | 4160033 | TSSC1 |
| rs1207421 | 2.86 | 1.63 | 5.02 | 4.168 | 4.81 | 0.460 | 2 | 205976100 | PARD3B |
| rs749052 | 0.28 | 0.17 | 0.46 | 4.305 | 5.08 | 0.004 | 2 | 232622115 | NPPC |
| rs4955917 | 1.58 | 1.25 | 1.99 | 4.017 | 4.53 | 0.316 | 3 | 55021142 | CACNA2D3/WNT5A |
| rs7628387 | 1.98 | 1.30 | 2.78 | 3.745 | 4.05 | 0.227 | 3 | 178046256 | TBL1XR1 |
| rs1961397 | 0.50 | 0.35 | 0.72 | 4.352 | 5.17 | 0.416 | 3 | 189111629 | BCL6 |
| rs1990525 | 3.76 | 1.93 | 7.29 | 4.282 | 5.03 | 0.287 | 4 | 15097292 | C1QTNF7 |
| rs7774801 | 5.28 | 2.60 | 10.89 | 4.048 | 4.59 | 0.029 | 6 | 22248420 | PRL |
| rs1324089 | 2.37 | 1.49 | 3.78 | 4.095 | 4.68 | 0.089 | 6 | 85022001 | C6orf84 |
| rs7757372 | 1.83 | 1.18 | 2.83 | 4.094 | 4.67 | 0.203 | 6 | 143972097 | PHACTR2 |
| rs2057999 | 1.81 | 1.31 | 2.48 | 3.986 | 4.47 | 0.501 | 7 | 21147012 | SP4 |
| rs7005969 | 2.70 | 1.81 | 4.04 | 4.169 | 4.82 | 0.213 | 8 | 2926103 | CSMD1 |
| rs10504460 | 3.53 | 2.06 | 6.05 | 4.738 | 5.97 | 0.018 | 8 | 70886578 | SLCO5A1 |
| rs2453998 | 3.85 | 2.11 | 7.05 | 4.826 | 6.16 | 0.282 | 8 | 104158794 | ATP6V1C1 |
| rs2274699 | 2.47 | 1.61 | 3.79 | 4.182 | 4.84 | 0.114 | 9 | 71579586 | TMEM2 |
| rs7026263 | 1.77 | 1.20 | 2.63 | 4.114 | 4.71 | 0.099 | 9 | 133711962 | VAV2 |
| rs10823602 | 3.40 | 2.02 | 5.71 | 4.348 | 5.16 | 0.310 | 10 | 72145774 | ADAMTS14 |
| rs4531428 | 2.44 | 1.66 | 3.60 | 3.908 | 4.33 | 0.028 | 11 | 100917249 | TRPC6 |
| rs975162 | 0.50 | 0.36 | 0.68 | 4.785 | 6.07 | 0.039 | 12 | 125567785 | PGBD3P3 |
| rs3818287 | 1.94 | 1.35 | 2.78 | 4.196 | 4.87 | 0.203 | 14 | 102500300 | CDC42BPB |
| rs751837 | 0.42 | 0.26 | 0.67 | 3.913 | 4.34 | 0.496 | 14 | 102554578 | CDC42BPB |
| rs2896463 | 0.31 | 0.18 | 0.56 | 4.52 | 5.51 | 0.233 | 14 | 102560645 | CDC42BPB |
| rs333603 | 0.69 | 0.53 | 0.84 | 4.008 | 4.51 | 0.415 | 15 | 64126454 | MEGF11 |
| rs7172123 | 2.59 | 1.64 | 4.09 | 4.552 | 5.58 | 0.389 | 15 | 66813101 | CORO2B |
| rs6096822 | 2.83 | 1.73 | 4.61 | 3.957 | 4.42 | 0.433 | 20 | 35970860 | C20orf102 |
The 28 SNPs had an average minor allele frequency (MAF) of 13%. Both replication cohorts combined had 80% power to detect as statistically significant odds ratios of 1.39 with p < 0.0017 (Bonferroni α = 0.05 for 28 tests) for MAFs of 13%.
From the individual genotyping of 28 SNPs, we estimated that the genotyping error in pools was 3.1% (SE ± 0.5%), although this estimate cannot be extrapolated to other markers in the pooled GWAS because SNPs with high Z scores had significantly lower errors due to imprecise measurement of the allele frequency in a pool than nonsignificant SNPs (not shown). Combining the test and replication samples, we found that 14 out of the 28 SNPs were nominally statistically significant (p < 0.05); this is consistent with the prior probability of 0.0005 used for the FPRP calculation. However, only one SNP rs4140564 was associated in both the U.S. and UK replication cohorts after adjusting for multiple testing (Table 3).
Table 3.
Association of 28 Markers with Knee OA in Two Replication Sets
| SNP ID | MAF % Controls/OA | OR | UK (95% CI) | p Value Nominal | p Value FDR | OR | US (95% CI) | p Value nominal | p Value FDR | Discovery + Replication ORMH (95% CI) | p Value Nominal |
|---|---|---|---|---|---|---|---|---|---|---|---|
| rs4140564a | 5.4/8.4 | 1.44 | (1.11–1.87) | 0.0056 | 0.0391 | 1.77 | (1.21–2.57) | 0.0026 | 0.0242 | 1.59 (1.31–1.94) | 3 × 10⁻⁶ |
| rs1539414 | 21.8/22.5 | 1.04 | (0.89–1.23) | n.s. | n.s. | 0.81 | (0.61–1.09) | n.s. | n.s. | 1.06 (0.94–1.21) | n.s. |
| rs12041748 | 12.7/14.6 | 1.02 | (0.84–1.24) | n.s. | n.s. | 1.16 | (0.88–1.54) | n.s. | n.s. | 1.17 (1.01–1.35) | 0.04 |
| rs7581129 | 6.3/6.7 | 0.92 | (0.7–1.22) | n.s. | n.s. | 2.30 | (1.40–3.77) | 0.0007 | 0.0105 | 0.99 (0.79–1.25) | n.s. |
| rs1207421 | 9.3/12.8 | 1.40 | (1.14–1.72) | 0.0012 | 0.0163 | 1.04 | (0.69–1.57) | n.s. | n.s. | 1.46 (1.24–1.73) | 6 × 10⁻⁶ |
| rs749052 | 7.2/7.0 | 1.11 | (0.85–1.44) | n.s. | n.s. | 1.20 | (0.76–1.89) | n.s. | n.s. | 0.93 (0.75–1.15) | n.s. |
| rs4955917 | 26.1 /27.6 | 1.06 | (0.92–1.23) | n.s. | n.s. | 0.85 | (0.61–1.17) | n.s. | n.s. | 1.05 (0.95–1.24) | n.s. |
| rs7628387 | 12.6/16.0 | 1.26 | (1.05–1.52) | 0.0154 | 0.0862 | 1.29 | (0.90–1.83) | n.s. | n.s. | 1.30 (1.12–1.51) | 0.0007 |
| rs1961397 | 10.7/10.1 | 0.98 | (0.78–1.23) | n.s. | n.s. | 1.02 | (0.69–1.52) | n.s. | n.s. | 0.91 (0.76–1.08) | n.s. |
| rs1990525 | 7.5/7.5 | 0.90 | (0.7–1.16) | n.s. | n.s. | 0.64 | (0.40–1.05) | 0.0755 | n.s. | 1.04 (0.85–1.28) | n.s. |
| rs7774801 | 9.5/12.7 | 1.18 | (0.95–1.47) | n.s. | n.s. | 1.34 | (1.00–1.80) | 0.0533 | n.s. | 1.38 (1.18–1.62) | 6 × 10⁻⁵ |
| rs1324089 | 22.1/23.6 | 1.01 | (0.85–1.18) | n.s. | n.s. | 0.98 | (0.74–1.30) | n.s. | n.s. | 1.11 (0.98–1.26) | 0.09 |
| rs7757372 | 22.7/26.6 | 1.13 | (0.97–1.31) | n.s. | n.s. | 1.09 | (0.82–1.44) | n.s. | n.s. | 1.24 (1.09–1.40) | 0.0007 |
| rs2057999 | 16.5/19.1 | 1.13 | (0.95–1.35) | n.s. | n.s. | 1.40 | (1.02–1.91) | 0.0343 | n.s. | 1.21 (1.05–1.39) | 0.006 |
| rs7005969 | 17.7/18.3 | 0.89 | (0.75–1.05) | n.s. | n.s. | 0.89 | (0.64–1.24) | n.s. | n.s. | 1.05 (0.91–1.20) | n.s. |
| rs10504460 | 8.4/10.1 | 1.05 | (0.84–1.32) | n.s. | n.s. | 0.96 | (0.58, 1.51) | n.s. | n.s. | 1.19 (1.00–1.51) | 0.050 |
| rs2453998 | 4.9/5.1 | 0.89 | (0.65–1.22) | n.s. | n.s. | 1.00 | (0.61–1.64) | n.s. | n.s. | 1.05 (0.81–1.36) | n.s. |
| rs2274699 | 8.0/8.8 | 1.04 | (0.83–1.31) | n.s. | n.s. | 0.71 | (0.43–1.17) | n.s. | n.s. | 1.11 (0.92–1.34) | n.s. |
| rs7026263 | 15.4/16.7 | 1.02 | (0.85–1.22) | n.s. | n.s | 1.08 | (0.77–1.51) | n.s. | n.s. | 1.11 (0.96–1.28) | n.s. |
| rs10823602 | 9.7/11.6 | 0.93 | (0.74–1.17) | n.s. | n.s. | 1.18 | (0.83–1.69) | 0.0272 | n.s. | 1.2 (1.02–1.41) | 0.025 |
| rs4531428 | 18.6/22.0 | 1.11 | (0.94–1.31) | n.s. | n.s. | 1.37 | (1.02–1.85) | 0.0388 | n.s. | 1.22 (1.07–1.40) | 0.003 |
| rs975162 | 14.2/12.1 | 0.99 | (0.81–1.21) | n.s. | n.s | 0.68 | (0.50–0.93) | 0.0145 | 0.1014 | 0.82 (0.70–0.95) | 0.009 |
| rs3818287 | 14.7/15.8 | 0.99 | (0.83–1.19) | n.s. | n.s. | 1.09 | (0.78–1.54) | n.s. | n.s. | 1.09 (0.94–1.27) | n.s. |
| rs751837 | 11.6/9.8 | 0.67 | (0.53–0.84) | 0.0007 | 0.0188 | 1.43 | (0.98–2.08) | 0.0601 | n.s. | 0.76 (0.63–0.90) | 0.0015 |
| rs2896463 | 8.7/7.1 | 0.68 | (0.52–0.89) | 0.0046 | 0.0432 | 1.33 | (0.87–2.05) | n.s. | n.s. | 0.74 (0.60–0.91) | 0.003 |
| rs333603 | 24.8/24.8 | 0.83 | (0.71–0.98) | 0.0238 | 0.0953 | 1.69 | (1.28–2.22) | 0.0002 | 0.0046 | 0.95 (0.84–1.08) | n.s. |
| rs7172123 | 9.0/12.2 | 1.31 | (1.04–1.64) | 0.0204 | 0.0954 | 1.34 | (1.01–1.77) | 0.0400 | n.s. | 1.37 (1.16–1.62) | 0.0001 |
| rs6096822 | 7.2/8.3 | 1.01 | (0.78–1.29) | n.s. | n.s. | 1.27 | (0.92–1.77) | n.s. | n.s. | 1.17 (0.97–1.41) | 0.10 |
Odds ratios and 95% confidence intervals are shown for each replication study along with the nominal and false discovery rate (FDR) adjusted p values (if ≤0.10). The summary Mantel-Haenszel odds ratio for all samples (discovery plus replication combined) is shown. Minor allele frequencies (MAF) are averaged over the U.S. and UK control and case samples.
SNPs with nominal overall p values < 0.002 are highlighted in bold.
We selected the seven markers with the smallest overall nominal p values (p < 0.002), and these were then tested for association in a population-based cohort from the Netherlands. Table 4 shows the odds ratios in the Rotterdam cohort for these variants as well as the overall Mantel-Haenszel odds ratio combining all samples, including those used for the GWAS. In addition, a Mantel-Haenszel odds ratio combining all replication samples, excluding those from the pools, is shown.
Table 4.
Association of Seven Markers in the Rotterdam Cohort and Meta-analysis in All Study Samples and in Replication Samples Only
| SNP ID | O.R. and Nominal p Value in Rotterdam Study | ORMH All | 95% CI | Nominal p Value, All Samples | ORMH Replication Samples Onlya | 95% CI | Nominal p Value Replication, Samples Onlya | |
|---|---|---|---|---|---|---|---|---|
| rs4140564 | 1.56 | (1.05–2.32), p < 0.026 | 1.55 | (1.30–1.85) | 6.9 × 10⁻⁷ | 1.54 | (1.28–1.86) | 5.6 × 10⁻⁶ |
| rs1207421 | 1.14 | (0.81–1.61), n.s. | 1.40 | (1.20–1.62) | 1.2 × 10⁻⁵ | 1.28 | (1.09–1.50) | 0.0028 |
| rs7628387 | 1.02 | (0.64–1.27), n.s. | 1.23 | (1.08–1.41) | 0.0022 | 1.19 | (1.03–1.38) | 0.014 |
| rs7774801 | 0.90 | (0.64–1.27), n.s. | 1.28 | (1.10–1.48) | 8.0 × 10⁻⁴ | 1.15 | (0.98–1.34) | 0.073 |
| rs7757372 | 1.03 | (0.82–1.30), n.s. | 1.19 | (1.07–1.32) | 0.0019 | 1.10 | (0.98–1.23) | n.s. |
| rs751837 | 1.06 | (0.76–1.49), n.s. | 0.81 | (0.69–0.95) | 0.0072 | 0.87 | (0.74–1.04) | n.s. |
| rs7172123 | 0.76 | (0.54–1.07), n.s. | 1.22 | (1.05–1.42) | 0.0070 | 1.13 | (0.99–1.29) | 0.077 |
With data from the UK, U.S., and Rotterdam replication cohorts and excluding all samples used for the pooled GWAS.
Only rs4140564 was nominally significantly associated in the Rotterdam cohort with an odds ratio of 1.56 (p < 0.026, Table 3). The summary Mantel-Haenszel odds ratio over all samples was ORmh = 1.55 (nominal p < 7 × 10⁻⁷) (Table 4). The association of rs4140564 with knee OA in the three replication cohorts, excluding the samples that had been used for the pooled GWAS, was also statistically significant with p < 5.6 × 10⁻⁶ (Table 4). Because the UK samples used for the GWAS and for replication are derived from three independent studies, we also estimated the odds ratio in each of this individual UK cohorts and found an OR = 1.54 (95% CI 1.05–2.27) for the UK case-control samples, OR = 1.54 (95% CI 1.03–2.31) for the Chingford samples, and OR = 1.56 (95% CI 1.04–2.34) for the TwinsUK samples.
Of the other six SNPs, after excluding the samples in the pools only rs1207421 and rs7628387 remained statistically significant overall (Table 4).
rs4140564 maps to a region in chromosome 1q25 that falls 5′ of both the PTGS2 and the PLA2G4A genes, which encode the cyclooxygenase 2 (COX-2) and the cytosolic phospholipase A2 enzymes, respectively. To assess whether PTGS2 and PLA2G4A were expressed in cartilage, we conducted an RT-PCR analysis for both genes on freshly isolated chondrocytes from knee OA cartilage. Both genes were abundantly expressed in all patients tested (Figure 2). On the other hand, expression of PTGS2 was minimal in placenta and normal synovium, and expression of PLA2G4A was minimal in placenta and was absent in normal synovium.
Figure 2.
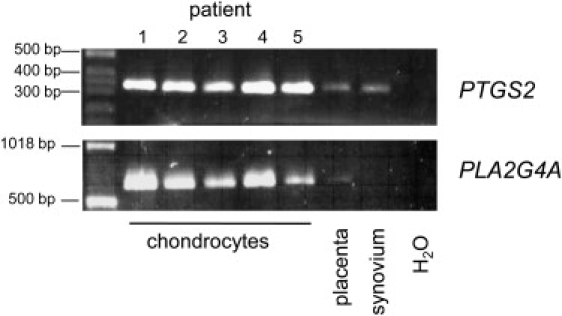
Expression of PLA2G4A and PTGS2 in Chondrocytes
PTGS2 and PLA2G4A gene expression was tested by RT-PCR on mRNA obtained from freshly isolated knee-cartilage chondrocytes from five OA patients. The primers amplified a 330 bp PTGS2 PCR product and a 650 bp PLA2G4A PCR product. Human placenta and normal synovium were used as noncartilage control tissues.
Water was used as negative control.
Analysis of the LD block (r2 ≥ 0.8) for individuals of European descent in the Perlegen Genome Browser (build 36) indicated that rs4140564 tags variation covering the whole of the PTGS2 gene, including its 3′ and 5′ untranslated regions SNP (Figure 3), but not the PLA2G4A gene. Because rs4140564 is tagging PTGS2 but only a distant 5′ region of PLA2G4A gene, we hypothesized that this variant, or a variant in LD with it, may affect the expression of PTGS2. To assess whether this was the case, we identified six OA patients (patients 1–6 in Figure 4) who had undergone joint replacement of a hip or of a knee and who were heterozygous both at SNP rs4140564 and at another SNP (rs5275). This second SNP was selected because, unlike rs4140564, it is part of the PTGS2 RNA transcript (Figure 3). rs5275 is located in the 3′ UTR of PTGS2 and thus enabled us to directly measure allelic expression at PTGS2 by comparing the mRNA allelic ratios of heterozygotes and DNA ratios. For an autosomal locus, DNA ratios for a heterozygote should always be 1.0, but if one of the alleles is in LD with a SNP that affects transcription or mRNA stability, the RNA ratios will be different from 1.0. Two of the six double-heterozygote individuals (patients 3 and 5 in Figure 4) demonstrated highly significant differences in allelic expression (p < 1.0 × 10⁻⁶). Patient 3 was a male who had undergone a knee replacement at 76 years of age, whereas patient 5 was a female who had undergone a hip replacement at 65 years of age. SNPs rs4140564 and rs5275 have different minor-allele frequencies and are not in complete LD (pair-wise r2 = 0.14) as seen by the haplotype frequencies in UK samples shown in Figure 4. However, we can conclude that for patients 3 and 5, marker rs4140564 is linked to a regulatory variant of PTGS2 whose alleles mediate different levels of PTGS2 expression.
Figure 3.
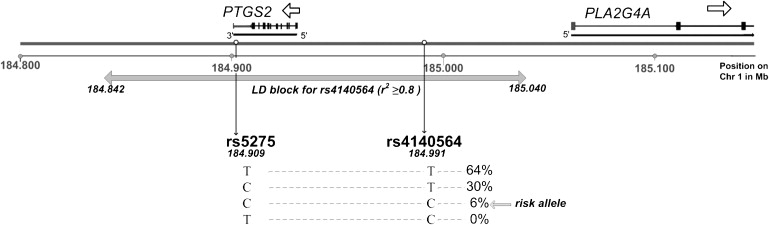
Position on Chromosome 1 of the PTGS2 and PLA2G4A Genes, rs4140564 and rs5275 SNPs
The LD block for rs4140564 (from Perlegen Genome browser build36) is shown, as are the frequencies of rs5275-rs4140564 haplotypes in UK samples.
Figure 4.
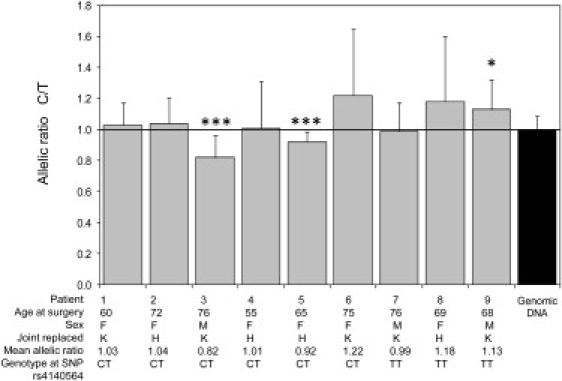
Allelic Expression Analysis at PTGS2 SNP rs5275
Expression analysis was carried out for nine UK patients who had severe end-stage OA with RNA extracted from articular cartilage. For each patient, 19 (patient 1) or 20 (patients 2–9) individual cDNA amplifications and SBE reactions were performed. Forty-five individual PCR and SBE reactions were performed for genomic DNA (five reactions per patient). The cDNA allelic ratios were compared with the 45 genomic ratios with a two-tailed Mann-Whitney exact test. Four patients had undergone a THR (H), and five patients had undergone TKR (K). Data shown are the mean +SD, ∗p < 0.005; ∗∗∗p < 1.0 × 10⁻⁶.
We also investigated three OA patients (patients 7–9 in Figure 4) who were heterozygous at rs5275 but homozygous (TT) for the marker associated with OA rs4140564. One of these patients (patient 9, a male who had undergone a knee replacement at age 68) demonstrated significant differences in allelic expression (p < 0.005).
Discussion
By using a pooled genome-wide scan approach and subsequently testing these variants in independent cohorts, we uncovered seven SNPs associated with knee OA but only one that is associated in the five cohorts studied. Two of those seven SNPs, rs7628387 and rs1207421 were overall significantly associated when samples used for the GWAS were excluded. rs1207421 maps to chromosome 2q33, not far from a previously reported linkage peak for hip OA at 2q31.1.4 Moreover, this SNP maps in the middle of a genome-wide linkage peak of extended early-onset OA families,29 making it likely that the genomic region near this marker harbors as-yet-unknown OA-susceptibility genes. rs7628387 on the other hand, maps to 3q26, which is not near any known linkage peak.
The effect sizes derived from the GWAS on a small subset were all overestimated. This pattern can be explained by the so-called “winner's curse,” which has been already discussed by other authors,30 but we note that the odds ratios for predisposing variants in the original GWAS were greater than 1.5 and as high as 5.6, whereas the actual ORs in the combined test plus replication samples were <1.6, consistent with other genetic associations with knee OA reported to date.
The pooled genome-wide scan presented here was underpowered as shown by the fact that no single variant achieved genome-wide significance. A true odds ratio of 2.4 or greater would have been required to achieve 80% power with α = 1.2 × 10⁻⁷ in the discovery sample size studied given a MAF that equaled 13% (average for the SNPs in Tables 2 and 3). Nevertheless, the approach utilized illustrates the value of using a pooled GWAS followed by the exclusion of markers that have a high probability of being false positives to uncover variants associated with disease. Several studies showing the validity of pooled GWAS for complex traits have recently been published, and this approach is considered by some authors as a valid cost-effective method for discovering associations of variants with disease.31
The polymorphism that is associated with OA in all samples studied, rs4140564, is located 5′ to PTGS2, and we hypothesized that it may be a regulatory polymorphism for this gene or that it may be in linkage disequilibrium (LD) with a regulatory polymorphism. Our allelic expression studies using RNA extracted from the cartilage of OA patients supports the existence of cis-acting polymorphisms that can modulate the expression of PTGS2. Not all six of the compound-heterozygote patients that we studied however demonstrated differential allelic expression, suggesting that rs4140564 is unlikely to be the regulatory polymorphism itself, but rather it is likely to be in modest LD with a marker-affecting expression. This is further supported by our observation that a patient who was homozygous at rs4140564 also demonstrated differential allelic expression. Identifying the functional regulatory polymorphism will require a comprehensive analysis of other variants within and close to PTGS2 to see which show the strongest correlation with differential allelic expression. This search may be expedited by an analysis of evolutionarily conserved sequences.
The two genes flanking rs4140564, PTGS2 and PLA2G4A, not only map nearby in the genome but are also both part of the prostaglandin E2 synthesis pathway. Prostaglandin E2 (PGE2) mediates the regulation of important biological processes such as proliferation and differentiation of articular chondrocytes in both normal and pathological states.32 The production of PGE2 involves a cascade of three enzyme reactions. First, arachidonic acid is liberated from its phospholipid storage sites by a phospholipase A2 (PLA2); it is then acted on by cyclooxygenases and finally by PGE synthase to produce PGE2.33
The COX-2 protein is the product of the PTGS2 gene in humans and has been reported to be expressed in OA meniscus, synovial membrane, and osteophytic fibrocartilage explants and at lower levels in OA articular cartilage, in particular during early OA.34 Our expression-analysis study confirms that the transcripts of two genes related to the synthesis of PGE2 are abundantly expressed in chondrocytes from OA patients.
Although OA is known to be a noninflammatory pathology, there is a growing body of evidence indicating that there is a significant inflammatory component to disease pathogenesis.35,36 Strong associations between PTGS2 variants and radiographic features of OA of the spine have been previously reported,37 and the results from the present study indicate that genetic variation near PTGS2 is important also for other forms of OA. Multiple reports have shown that PGE2 is involved in the pathogenesis of OA.38,39 Increased COX-2 expression has been reported in cartilage and synovial tissues from patients with OA and also in several models of cartilage degradation.39,40 However, the role of COX-2 in OA is still controversial. Animal studies have shown that during the early phase of inflammation, COX-2is clearly proinflammatory, but during the later phases of inflammation dominated by mononuclear cells, COX-2 appears to have anti-inflammatory effects by generating an alternate set of anti-inflammatory prostaglandins.41 Further, whereas some findings suggest that PGE2 mediates the interleukin 1 beta (IL-1β) effect on cartilage degradation,42 PGE2 may also have positive effects on cartilage by increasing the level of glucocorticoid receptors in chondrocyte cells, influencing cartilage differentiation and proliferation, and mediating the effects of vitamin D on cartilage.43,44 Recent in vitro studies in human chondrocytes provide evidence that both tumor necrosis alpha (TNF-α) and IL-1β differentially regulate the activation of the apoptotic pathway in human chondrocyte cells but that PGE2 does not modulate apoptosis.45 Other studies reported that TNF-α-mediated protection of chondrocytes from nitric-oxide-induced apoptosis requires COX-2 activity.44
Given the complex and multiple pathways of regulatory stimuli affecting COX-2 expression, and the discrepant effects that can be observed in vitro, genetic variants that result in either higher or lower expression of COX-2 in response to proinflammatory cytokines or nitric oxide have the potential of resulting in higher risk of OA. This would depend on how transcriptional regulation of the PTGS2 gene by cytokines and nitric oxide is influenced, on how regulatory loops of the COX enzymes are influenced, and on the stage during the pathogenesis of OA at which the differential response to transcriptional regulatory factors takes place. The data found in our study suggest that an allele in LD with the risk-associated allele at rs4140564 is involved in lower expression of mRNA encoding COX-2. More elaborate experiments are needed to understand the precise mechanism by which rs4140564 or other variants in LD with it are influencing risk of OA.
The expression differences that we observed between PTGS2 alleles in patients 3, 5, and 9 were relatively small, ranging from 8%–18%. However, these differences are comparable to those observed for the recently reported OA-associated functional SNP rs143383, which is located in the 5′ UTR of the growth/differentiation factor 5 (GDF5 [MIM 601146]),26 a gene which has been shown to affect risk of hip and knee OA in both Asian and European individuals.6 However, because only two of the six rs4140564 heterozygote patients showed decreased PTGS2 expression, and given the controversial role of COX-2 in OA, we can merely hypothesize that the mechanism involved in increased OA risk could be through differential modulation of PTGS2 expression. Other possible explanations, which we did not explore, are that rs4140564 or a polymorphism in LD with it might be affecting expression of PLA2G4A or that rs4140564 might be in LD with variants affecting the function of either the PLA2G4A or PTGS2 or both gene products.
In conclusion, our data indicate that a polymorphism in LD with variants affecting the expression of the PTGS2 gene are associated with susceptibility to knee OA in five independent populations and highlight the importance of inflammatory pathways in OA pathogenesis.
Web Resources
The URL for data presented herein is as follows:
Online Mendelian Inheritance in Man (OMIM), http://www.ncbi.nlm.nih.gov/Omim
Acknowledgments
This work was supported by EC framework 7 programme grant 200800 TREAT-OA to A.M.V., J.L., J.V.M., A.G.U., R.J.L., F.P.L., and T.D.S, by ARC project grant 17716 to A.M.V., J.L., M.D., and T.D.S., and by Research into Ageing programme grant 237 to J.L. S.G.W. and T.D.S. received funding from NHMRC grant 343603. T.D.S. is also funded by the Wellcome Trust. R.J.L. is the recipient of a post-doctoral fellowship from the Flanders Research Foundation (FWO-Vlaanderen). A.G.U., J.V.M., and A.H. were also supported by NWO Groot project 175.010.2005.011 and by the GEFOS consortium grant. R.J.E. is the recipient of a post-doctoral fellowship from the Swiss National Science Foundation (SNF) and the Hans-Neuenschwander Foundation, Switzerland.
References
- 1.Felson D.T. An update on the pathogenesis and epidemiology of osteoarthritis. Radiol. Clin. North Am. 2004;42:1–9. doi: 10.1016/S0033-8389(03)00161-1. [DOI] [PubMed] [Google Scholar]
- 2.Lane N.E., Lian K., Nevitt M.C., Zmuda J.M., Lui L., Li J., Wang J., Fontecha M., Umblas N., Rosenbach M. Frizzled-related protein variants are risk factors for hip osteoarthritis. Arthritis Rheum. 2006;54:1246–1254. doi: 10.1002/art.21673. [DOI] [PubMed] [Google Scholar]
- 3.Valdes A.M., Loughlin J., Oene M.V., Chapman K., Surdulescu G.L., Doherty M., Spector T.D. Sex and ethnic differences in the association of ASPN, CALM1, COL2A1, COMP, and FRZB with genetic susceptibility to osteoarthritis of the knee. Arthritis Rheum. 2007;56:137–146. doi: 10.1002/art.22301. [DOI] [PubMed] [Google Scholar]
- 4.Ikegawa S. New gene associations in osteoarthritis: What do they provide, and where are we going? Curr. Opin. Rheumatol. 2007;19:429–434. doi: 10.1097/BOR.0b013e32825b079d. [DOI] [PubMed] [Google Scholar]
- 5.Jiang Q., Shi D., Yi L., Ikegawa S., Wang Y., Nakamura T., Qiao D., Liu C., Dai J. Replication of the association of the aspartic acid repeat polymorphism in the asporin gene with knee-osteoarthritis susceptibility in Han Chinese. J. Hum. Genet. 2006;51:1068–1072. doi: 10.1007/s10038-006-0065-6. [DOI] [PubMed] [Google Scholar]
- 6.Miyamoto Y., Mabuchi A., Shi D., Kubo T., Takatori Y., Saito S., Fujioka M., Sudo A., Uchida A., Yamamoto S. A functional polymorphism in the 5′-UTR of GDF5 is associated with susceptibility to osteoarthritis. Nat. Genet. 2007;39:529–533. doi: 10.1038/2005. [DOI] [PubMed] [Google Scholar]
- 7.Valdes A.M., Doherty M., Spector T.D. The additive effect of individual genes in predicting risk of knee osteoarthritis. Ann. Rheum. Dis. 2008;67:124–127. doi: 10.1136/ard.2007.075838. [DOI] [PubMed] [Google Scholar]
- 8.Mototani H., Mabuchi A., Saito S., Fujioka M., Iida A., Takatori Y., Kotani A., Kubo T., Nakamura K., Sekine A. A functional single nucleotide polymorphism in the core promoter region of CALM1 is associated with hip osteoarthritis in Japanese. Hum. Mol. Genet. 2005;14:1009–1017. doi: 10.1093/hmg/ddi093. [DOI] [PubMed] [Google Scholar]
- 9.Loughlin J., Sinsheimer J.S., Carr A., Chapman K. The CALM1 core promoter polymorphism is not associated with hip osteoarthritis in a United Kingdom Caucasian population. Osteoarthritis Cartilage. 2006;14:295–298. doi: 10.1016/j.joca.2005.11.001. [DOI] [PubMed] [Google Scholar]
- 10.Spector T.D., Reneland R.H., Mah S., Valdes A.M., Hart D.J., Kammerer S., Langdown M., Hoyal C.R., Atienza J., Doherty M. Association between a variation in LRCH1 and knee osteoarthritis: A genome-wide single-nucleotide polymorphism association study using DNA pooling. Arthritis Rheum. 2006;54:524–532. doi: 10.1002/art.21624. [DOI] [PubMed] [Google Scholar]
- 11.Snelling S., Sinsheimer J.S., Carr A., Loughlin J. Genetic association analysis of LRCH1 as an osteoarthritis susceptibility locus. Rheumatology (Oxford) 2007;46:250–252. doi: 10.1093/rheumatology/kel265. [DOI] [PubMed] [Google Scholar]
- 12.Jiang Q., Shi D., Nakajima M., Dai J., Wei J., Malizos K.N., Qin J., Miyamoto Y., Kamatani N., Liu B. Lack of association of single nucleotide polymorphism in LRCH1 with knee osteoarthritis susceptibility. J. Hum. Genet. 2008;53:42–47. doi: 10.1007/s10038-007-0216-4. [DOI] [PubMed] [Google Scholar]
- 13.Altman R., Asch E., Bloch D., Bole G., Borenstein D., Brandt K., Christy W., Cooke T.D., Greenwald R., Hochberg M., for the Diagnostic and Therapeutic Criteria Committee of the American Rheumatism Association Development of criteria for the classification and reporting of osteoarthritis: Classification of osteoarthritis of the knee. Arthritis Rheum. 1986;29:1039–1049. doi: 10.1002/art.1780290816. [DOI] [PubMed] [Google Scholar]
- 14.Reijman M., Hazes J.M., Bierma-Zeinstra S.M., Koes B.W., Christgau S., Christiansen C., Uitterlinden A.G., Pols H.A. A new marker for osteoarthritis: Cross-sectional and longitudinal approach. Arthritis Rheum. 2004;50:2471–2478. doi: 10.1002/art.20332. [DOI] [PubMed] [Google Scholar]
- 15.Burnett S., Hart D.J., Cooper C., Spector T.D. Springer Verlag; London: 1994. A Radiographic Atlas of Osteoarthritis. [Google Scholar]
- 16.Kellgren J.H., Lawrence J.S., Bier F. Genetic factors in generalized osteoarthritis. Ann. Rheum. Dis. 1963;22:237–255. doi: 10.1136/ard.22.4.237. [DOI] [PMC free article] [PubMed] [Google Scholar]
- 17.Hofman A., Breteler M.M., van Duijn C.M., Krestin G.P., Pols H.A., Stricker B.H., Tiemeier H., Uitterlinden A.G., Vingerling J.R., Witteman J.C. The Rotterdam Study: Objectives and design update. Eur. J. Epidemiol. 2007;22:819–829. doi: 10.1007/s10654-007-9199-x. [DOI] [PMC free article] [PubMed] [Google Scholar]
- 18.Rosenbaum S., Skinner R.K., Knight I.B., Garrow J.S. A survey of heights and weights of adults in Great Britain, 1980. Ann. Hum. Biol. 1985;12:115–127. doi: 10.1080/03014468500007621. [DOI] [PubMed] [Google Scholar]
- 19.Hart D.J., Spector T.D. The relationship of obesity, fat distribution and osteoarthritis in women in the general population: The Chingford Study. J. Rheumatol. 1993;20:331–335. [PubMed] [Google Scholar]
- 20.Spector T.D., MacGregor A.J. The St. Thomas' UK Adult Twin Registry. Twin Res. 2002;5:440–443. doi: 10.1375/136905202320906246. [DOI] [PubMed] [Google Scholar]
- 21.Andrew T., Hart D.J., Snieder H., de Lange M., Spector T.D., MacGregor A.J. Are twins and singletons comparable? A study of disease-related and lifestyle characteristics in adult women. Twin Res. 2001;4:464–477. doi: 10.1375/1369052012803. [DOI] [PubMed] [Google Scholar]
- 22.Steer S., Abkevich V., Gutin A., Cordell H.J., Gendall K.L., Merriman M.E., Rodger R.A., Rowley K.A., Chapman P., Gow P. Genomic DNA pooling for whole-genome association scans in complex disease: Empirical demonstration of efficacy in rheumatoid arthritis. Genes Immun. 2007;8:57–68. doi: 10.1038/sj.gene.6364359. [DOI] [PubMed] [Google Scholar]
- 23.Wacholder S., Chanock S., Garcia-Closas M., El Ghormli L., Rothman N. Assessing the probability that a positive report is false: An approach for molecular epidemiology studies. J. Natl. Cancer Inst. 2004;96:434–442. doi: 10.1093/jnci/djh075. [DOI] [PMC free article] [PubMed] [Google Scholar]
- 24.Benjamini Y., Hochberg Y. Controlling the false discovery rate—a new and powerful approach to multiple testing. J. Roy. Statist. Soc. Ser. B. Methodological. 1995;57:289–300. [Google Scholar]
- 25.Kirkwood B.R. Blackwell Scientific; Oxford: 1988. Essentials of medical statistics. p. 27. [Google Scholar]
- 26.Dell'Accio F., De Bari C., Luyten F.P. Molecular markers predictive of the capacity of expanded human articular chondrocytes to form stable cartilage in vivo. Arthritis Rheum. 2001;44:1608–1619. doi: 10.1002/1529-0131(200107)44:7<1608::AID-ART284>3.0.CO;2-T. [DOI] [PubMed] [Google Scholar]
- 27.Wilkins J.M., Southam L., Price A.J., Mustafa Z., Carr A., Loughlin J. Extreme context specificity in differential allelic expression. Hum. Mol. Genet. 2007;16:537–546. doi: 10.1093/hmg/ddl488. [DOI] [PubMed] [Google Scholar]
- 28.Southam L., Rodriguez-Lopez J., Wilkins J.M., Pombo-Suarez M., Snelling S., Gomez-Reino J.J., Chapman K., Gonzalez A., Loughlin J. A SNP in the 5′UTR of GDF5 is associated with osteoarthritis susceptibility in Europeans and with in vivo differences in allelic expression in articular cartilage. Hum. Mol. Genet. 2007;16:2226–2232. doi: 10.1093/hmg/ddm174. [DOI] [PubMed] [Google Scholar]
- 29.Meulenbelt I., Min J.L., van Duijn C.M., Kloppenburg M., Breedveld F.C., Slagboom P.E. Strong linkage on 2q33.3 to familial early-onset generalized osteoarthritis and a consideration of two positional candidate genes. Eur. J. Hum. Genet. 2006;14:1280–1287. doi: 10.1038/sj.ejhg.5201704. [DOI] [PubMed] [Google Scholar]
- 30.Göring H.H., Terwilliger J.D., Blangero J. Large upward bias in estimation of locus-specific effects from genomewide scans. Am. J. Hum. Genet. 2001;69:1357–1369. doi: 10.1086/324471. [DOI] [PMC free article] [PubMed] [Google Scholar]
- 31.Docherty S.J., Butcher L.M., Schalkwyk L.C., Plomin R. Applicability of DNA pools on 500 K SNP microarrays for cost-effective initial screens in genomewide association studies. BMC Genomics. 2007;8:214. doi: 10.1186/1471-2164-8-214. [DOI] [PMC free article] [PubMed] [Google Scholar]
- 32.Goldring M.B., Berenbaum F. The regulation of chondrocyte function by proinflammatory mediators: Prostaglandins and nitric oxide. Clin. Orthop. Relat. Res. 2004;427(Suppl):S37–S46. doi: 10.1097/01.blo.0000144484.69656.e4. [DOI] [PubMed] [Google Scholar]
- 33.Gosset M., Berenbaum F., Levy A., Pigenet A., Thirion S., Saffar J.L., Jacques C. Prostaglandin E2 synthesis in cartilage explants under compression: mPGES-1 is a mechanosensitive gene. Arthritis Res. Ther. 2006;8:R135. doi: 10.1186/ar2024. [DOI] [PMC free article] [PubMed] [Google Scholar]
- 34.Hardy M.M., Seibert K., Manning P.T., Currie M.G., Woerner B.M., Edwards D., Koki A., Tripp C.S. Cyclooxygenase 2-dependent prostaglandin E2 modulates cartilage proteoglycan degradation in human osteoarthritis explants. Arthritis Rheum. 2002;46:1789–1803. doi: 10.1002/art.10356. [DOI] [PubMed] [Google Scholar]
- 35.Sakkas L.I., Platsoucas C.D. The role of T cells in the pathogenesis of osteoarthritis. Arthritis Rheum. 2007;56:409–424. doi: 10.1002/art.22369. [DOI] [PubMed] [Google Scholar]
- 36.Botha-Scheepers S.A., Watt I., Slagboom E., de Craen A.J., Meulenbelt I., Rosendaal F.R., Breedveld F.C., Huizinga T.W., Kloppenburg M. Innate production of Tumor Necrosis Factor-α and Interleukin-10 is associated with radiological progression of knee osteoarthritis. Ann. Rheum. Dis. 2007 doi: 10.1136/ard.2007.084657. Published online November 20, 2007. [DOI] [PubMed] [Google Scholar]
- 37.Valdes A.M., Hassett G., Hart D.J., Spector T.D. Radiographic progression of lumbar spine disc degeneration is influenced by variation at inflammatory genes: A candidate SNP association study in the Chingford cohort. Spine. 2005;30:2445–2451. doi: 10.1097/01.brs.0000184369.79744.a5. [DOI] [PubMed] [Google Scholar]
- 38.Amin A.R., Attur M., Patel R.N., Thakker G.D., Marshall P.J., Rediske J., Stuchin S.A., Patel I.R., Abramson S.B. Superinduction of cyclooxygenase-2 activity in human osteoarthritis-affected cartilage. Influence of nitric oxide. J. Clin. Invest. 1997;99:1231–1237. doi: 10.1172/JCI119280. [DOI] [PMC free article] [PubMed] [Google Scholar]
- 39.Martel-Pelletier J., Pelletier J.P., Fahmi H. Cyclooxygenase-2 and prostaglandins in articular tissues. Semin. Arthritis Rheum. 2003;33:155–167. doi: 10.1016/s0049-0172(03)00134-3. [DOI] [PubMed] [Google Scholar]
- 40.Kobayashi T., Okamoto K., Kobata T., Hasunuma T., Sumida T., Nishioka K. Tumor necrosis factor alpha regulation of the FAS-mediated apoptosis-signaling pathway in synovial cells. Arthritis Rheum. 1999;42:519–526. doi: 10.1002/1529-0131(199904)42:3<519::AID-ANR17>3.0.CO;2-Q. [DOI] [PubMed] [Google Scholar]
- 41.Gilroy D.W., Colville-Nash P.R., Willis D., Chivers J., Paul-Clark M.J., Willoughby D.A. Inducible cyclooxygenase may have anti-inflammatory properties. Nat. Med. 1999;5:698–701. doi: 10.1038/9550. [DOI] [PubMed] [Google Scholar]
- 42.Benito M.J., Veale D.J., FitzGerald O., van den Berg W.B., Bresnihan B. Synovial tissue inflammation in early and late osteoarthritis. Ann. Rheum. Dis. 2005;64:1263–1267. doi: 10.1136/ard.2004.025270. [DOI] [PMC free article] [PubMed] [Google Scholar]
- 43.DiBattista J.A., Martel-Pelletier J., Cloutier J.M., Pelletier J.P. Modulation of glucocorticoid receptor expression in human articular chondrocytes by cAMP and prostaglandins. J. Rheumatol. Suppl. 1991;27:102–105. [PubMed] [Google Scholar]
- 44.Relić B., Bentires-Alj M., Ribbens C., Franchimont N., Guerne P.A., Benoît V., Merville M.P., Bours V., Malaise M.G. TNF-alpha protects human primary articular chondrocytes from nitric oxide-induced apoptosis via nuclear factor-kappaB. Lab. Invest. 2002;82:1661–1672. doi: 10.1097/01.lab.0000041714.05322.c0. [DOI] [PubMed] [Google Scholar]
- 45.Caramés B., López-Armada M.J., Cillero-Pastor B., Lires-Dean M., Vaamonde C., Galdo F., Blanco F.J. Differential effects of tumor necrosis factor-alpha and interleukin-1beta on cell death in human articular chondrocytes. Osteoarthritis Cartilage. 2007 doi: 10.1016/j.joca.2007.10.006. Published online November 28, 2007. [DOI] [PubMed] [Google Scholar]