

Abstract
The Uyghur (UIG) population, settled in Xinjiang, China, is a population presenting a typical admixture of Eastern and Western anthropometric traits. We dissected its genomic structure at population level, individual level, and chromosome level by using 20,177 SNPs spanning nearly the entire chromosome 21. Our results showed that UIG was formed by two-way admixture, with 60% European ancestry and 40% East Asian ancestry. Overall linkage disequilibrium (LD) in UIG was similar to that in its parental populations represented in East Asia and Europe with regard to common alleles, and UIG manifested elevation of LD only within 500 kb and at a level of 0.1 < r2 < 0.8 when ancestry-informative markers (AIMs) were used. The size of chromosomal segments that were derived from East Asian and European ancestries averaged 2.4 cM and 4.1 cM, respectively. Both the magnitude of LD and fragmentary ancestral chromosome segments indicated a long history of Uyghur. Under the assumption of a hybrid isolation (HI) model, we estimated that the admixture event of UIG occurred about 126 [107∼146] generations ago, or 2520 [2140∼2920] years ago assuming 20 years per generation. In spite of the long history and short LD of Uyghur compared with recent admixture populations such as the African-American population, we suggest that mapping by admixture LD (MALD) is still applicable in the Uyghur population but ∼10-fold AIMs are necessary for a whole-genome scan.
Introduction
Xinjiang, China has been a contact zone of the peoples from Central Asia and East Asia. In particular, the presence of a Tocharian (an extinct Indo-European language)-speaking population during the first millennium, the discovery of mummies with European features dating from 3,000–4,000 YBP (Years Before Present), and the existence of West Eurasian mitochondrial-DNA lineages clearly indicate the influence of populations of European descent in this region, and the signature of admixture between East Asians and those of European descent is also evident.1–8 A full analysis of genetic structure of the admixed populations in this region would shed light on the understanding of human migratory history and the admixture of East Asians and those of European descent. Because many human populations settled at Central Asia, which has been a complex assembly of peoples, cultures, and habitats,9 The Uyghur population in Xinjiang demonstrates an array of mixed anthropological features of Europeans and Asians.10 We are interested in both its admixture history and its potential for gene mapping.
Admixture of populations often leads to an extended linkage disequilibrium (LD), which could greatly facilitate the mapping of human disease genes.11–14 Gene mapping by admixture linkage disequilibrium (MALD) has been shown to be of special value theoretically11,15–22 and empirically.1,23–36 However, typical admixture populations used for MALD often involve those formed by recent admixture between groups originating on different continents as a result of European maritime expansion during the past few hundred years. These include populations formed by two-way and three-way admixture between Europeans, West Africans, and Native Americans in the Americas, as well as populations formed by two-way admixture of Europeans with indigenous populations in Australia, the Pacific Islands, and Polar Regions.12 Because the admixture events happened a few hundred years ago, parental populations and the admixture histories of the aforementioned populations are relatively clear; it is easy to obtain the panels of markers informative for ancestry.28,34,35,37 Although Uyghur is a population presenting a typical admixture of Eastern and Western anthropological traits, its potential utility in MALD has been largely ignored because of its uncharacterized and suspected to be longer history of admixture as compared with other populations. It is more difficult to identify ancestry-informative markers (AIMs), and more such markers are required when admixture occurred beyond the time range which was considered ideal.12
Concerning the Uyghur population, there are many questions that remain unanswered: 1) What are the ancestral origins of Uyghur? 2) Was Uyghur formed by two-way or three-way admixture? 3) How much ancestry did each parental population contribute to Uyghur respectively? 4) How long ago did the admixture occur? 5) What is the LD pattern and magnitude in Uyghur? 6) Is Uyghur amiable to MALD? In this study, we try to answer these questions by dissecting the genetic structure of an Uyghur population sample at population, individual, and chromosome level by using a panel of high-density SNP markers on chromosome 21.
Subjects and Methods
Populations and Samples
Forty Uyghur samples were collected at Hetian of Xinjiang in China, where the Uyghur population was thought to be less affected by the recent migration of Han Chinese than are Uyghur populations in Northern Xinjiang. Genotype data of 60 CEU (Utah residents with ancestry from northern and western Europe) parents, 60 YRI (Yoruba in Ibadan, Nigeria) parents, 45 CHB (Han Chinese in Beijing) and 45 JPT (Japanese in Tokyo) were obtained from the database of the International HapMap Project.38–40
Markers and their Positions
A set of 26,112 SNPs on chromosome 21 was genotyped in 40 Uyghur. Illumina Beadlab technology was used in genotyping, and the method and the data of genotyping were previously described elsewhere.41 Genotyped SNPs on chromosome 21 of 60 CEU, 60 YRI, 45 CHB, and 45 JPT samples were obtained from the International HapMap Project38,39 (HapMap public released #21, 2006-07-20). After data filtration (e.g., deleting markers with missing data > 5% samples), we obtained 20,177 SNPs that were genotyped successfully in all five populations. Those SNPs that showed deviation from Hardy-Weinberg equilibrium within population were excluded with Fisher's exact test (p < 0.05), where p was estimated with Arlequin 3.0142 with 100,000 permutations.
The physical positions of SNPs were based on the Homo sapiens Genome Build 36. The total chromosome region covered by 20,177 SNPs was 33.36 Mb. The average spacing between adjacent markers was 1.6 kb, with a minimum of 69 bp and a maximum of 189 kb, and the median between marker distance (BMD) was 811 bp. The genetic map positions of SNPs were based on the Rutgers combined linkage-physical maps,43 which incorporate the latest human genome build, Build 36. We determined the genetic map positions of SNPs in centiMorgans by using a web-based linkage-mapping server that carried out a smoothing calculation to estimate genetic map positions, including those markers which were not mapped directly. The total recombination distance is 68.16 cM (from 0 cM to 68.16 cM), the average intermarker distance is 0.003 cM, the maximum is 0.49 cM, and the median is 0.001 cM.
Allele-Sharing Distance of Individuals, Analysis of Relatedness, and Estimates of FST
We used an allele sharing distance (ASD)15,44 as the genetic distance between individuals. Within each population, we estimated the chromosomal level of relatedness between all pairs of individuals. We used a method-of-moments approach, implemented in PLINK, to estimate the probability of sharing 0, 1, or 2 alleles identical-by-descent (IBD) for any two individuals from the same homogeneous and random-mating population. Unbiased estimates of FST were calculated following Weir and Hill.45
Marker-Information Content for Ancestry
Four measurements were used in this study to calculate marker-information content for ancestry: allele-frequency difference (δ),46 Wahlund's f,47 Rosenberg's In,48 and FST.45 FST is a measurement that considers the variation of sample size; given that the sample sizes of CHB (45) and CEU (60) are different, we used FST as the primary measurement for marker information in this study.
Although these measures are highly correlated, as shown in Figure S1 (available online), we calculated and showed information of all the measures so that our results are comparable for other studies. The distribution of marker information of 20,177 SNPs, according to the above measures, is shown in Figure S2. Of the markers, 5.1% had δ values > 0.5, 5.7% had In values > 0.2, 4.5% had f values > 0.3, and 5.4% had FST values > 0.3; these values can be considered as the signal of very great genetic difference between populations.
Select Ancestry-Informative Markers
SNPs that have large allele-frequency differences between CHB and CEU were selected as ancestry-informative markers (AIMs). One threshold proposed for declaring a SNP to be highly informative for ancestry inference is δ = 0.5,46 which corresponds to FST ∈ [0.250, 0.333] and. In ∈ [0.131, 0.216].48 Although FST, f, and In are all closely related to δ in the case of biallelic markers in two source populations, unlike δ they capture the dependence of information content on the position of allele frequencies in the unit interval. In this study, we selected AIMs according to FST value, with FST ≥ 0.35 (the upper bound of FST corresponding to δ > 0.5), from 20,177 SNPs and obtained 602 AIMs. However, we noted that in many regions, adjacent markers had the same or similar FST values and formed ‘blocks’ of FST. One example of this is shown in Figure S3. We examined these “FST block” regions and found that they were actually haplotype blocks in both CHB and CEU and contained very few haplotypes; therefore, markers within these “FST blocks” would provide redundant information if they were all included. Furthermore, for STRUCTURE analysis, the program was not designed to model the LD that occurs between nearby markers (so called “background LD”) within populations (i.e., the model is best suited for data on markers that are linked, but not so tightly linked).49 Therefore, we picked “tag AIMs” by controlling the between-marker distance and removing those redundant AIMs to avoid strong LD within CHB and CEU. At the same time, there were some greatly spanned chromosome regions (> 1 cM) without AIMs covered. We saturated these regions by selecting some AIMs with FST less than 0.35 but larger than 0.3. Finally, 83 of the original 602 AIMs were selected and used for further analysis. Distribution of marker information (FST, f, δ, and In) of 83 AIMs is shown in Figure 1. The average BMD of these 83 AIMs was 0.82 cM (398 kb), and median BMD was 0.57 cM (280 kb), with mean δ = 0.52, mean In = 0.20, mean f = 0.33, and mean FST = 0.47. The final length of the chromosomal region that was covered by AIMs was 67.37 cM (32.7 Mb).
Figure 1.
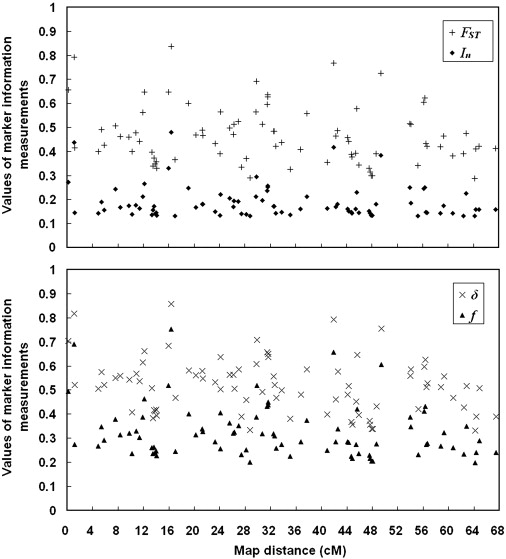
Distribution of Marker Information for 83 AIMs
Haplotype Inference
The linkage-disequilibrium analyses in this study were based on haplotypes generated from data with PHASE 2.1 software.50 PHASE implements a Bayesian statistical method for reconstructing haplotypes from population genotype data, which has been shown to be superior to the EM algorithm for haplotype reconstruction at the individual level.50 PHASE was run with the recombination model, 10,000 iterations, 100 thinning interval, and 10,000 burn-ins. The other parameters were set as the defaults.
Overall, 20,177 SNPs were broken into segments of 40 SNPs, with 20 overlapping SNPs between each two consecutive sections. Haplotypes were inferred by PHASE from each segment independently. Finally, the two haplotypes of each individual were reconstructed by combining all haplotypes segment by segment according to the inferred haplotypes of the 20 overlapping sites between consecutive sections. When the overlapping SNPs were inconsistent, we arbitrarily kept the results of the former segment.
The individual haplotypes for the panel of 602 AIMs that were informative for ancestry were reinferred, independent of the results of the 20,177 SNPs.
STRUCTURE Analysis
For analyzing the ancestry of Uyghur, the program STRUCTURE 49,51 was used. STRUCTURE implements a model-based clustering method for inferring population structure with genotype data. However, the model implemented in the program is best suited to data on markers that are linked, but not so tightly linked; therefore, we screened the markers by controlling space between adjacent markers larger than at least 200 kb (averaging about 0.5 cM for chromosome 21). We obtained ten data sets (S1∼S10) by random sampling markers with BMD > 500 kb. The basic statistics of the ten data sets are described in Table S1. We used an admixture-model option and assumed that allele frequencies were correlated. The program was run with 100,000 iterations and 100,000 burn-ins.
For the inference of ancestry origin of chromosomal segments, STRUCTURE was used. In version 2.2, the program implements a model that allows for “admixture linkage disequilibrium,”49 which performs better than the original admixture model when using linked loci to study admixed populations. It achieves more accurate estimates of the ancestry vector and can extract more information from the data. In this model, STRUCTURE reports not only the overall ancestry for each individual but also the probability of origin of each allele. We selected a panel of 83 AIMs for estimating the ancestry of alleles (see “Select Ancestry-Informative Markers” section for details). The estimated haplotypes from the 40 UIG individuals were examined together with the phased data from the 60 CEU and 45 CHB subjects. We used distances between the markers determined by both genomic-sequence and recombination-based data (Rutgers combined linkage-physical maps)43 as map distances. We used a linkage-model option and assumed that allele frequencies were correlated. The program was run with 1000,000 iterations, 1000,000 burn-ins, and 500,000 admixture burn-ins.
Measures of LD
Several statistics have been used to measure the LD between a pair of loci.52 The two most common measures are the absolute value of D' (denoted by |D'|) and r2, both derived from Lewontin's D.53 It was shown that in association studies, the sample size must be increased by roughly 1/r2 when compared with the sample size for detection of association with the susceptibility locus itself.54,55 r2 has a relatively clear interpretation in terms of the power to detect an association, and intermediate values of r2 are also easily interpretable.54,56 It is therefore more sensible to use r2 to study LD. In addition, r2 also shows much less inflation in small samples than does |D'|.56,57 In this study, we used r2 to measure LD between two SNPs.
Results
Genetic Diversity and Relatedness of Individuals
Heterozygosity measures the genetic diversity within each population, and both expected heterozygosity (He) and observed heterozygosity (Ho) were calculated for each population by use of genotypes of 20,177 SNPs (Table 1). As expected, the East Asian populations (CHB and JPT) and the European population (CEU) show lower He and Ho than does the African population (YRI). However, UIG has even an higher He and Ho than does YRI. Distribution of minor-allele frequency (MAF) of 20,177 SNPs in five populations (Figure S4) also showed that UIG has a higher proportion of common alleles (high MAF SNPs) than does YRI, a finding which is expected in admixture populations. Genetic difference between populations was estimated by pairwise FST (Table 2). Notably, FST between UIG and CEU (0.028) is much smaller than FST between UIG and CHB (0.037). Within each population, we further estimated the chromosomal level of relatedness between all pairs of individuals, as measured by the probability of identical-by-descent (IBD). Table 3 shows the IBD-sharing probability of individuals within each population. CEU and JPT have the highest average IBD (0.035), and UIG has the lowest average IBD (0.026). Both higher heterozygosity and lower IBD suggested the presence of substructure in UIG genomes and different origins of chromosomal segments.
Table 1.
Observed Heterozygosity and Expected Heterozygosity within Populations
| Observed Heterozygosity | Expected Heterozygosity | |||
|---|---|---|---|---|
| JPT | 0.288 | ± 0.190 | 0.285 | ± 0.182 |
| CHB | 0.286 | ± 0.189 | 0.285 | ± 0.180 |
| UIG | 0.312 | ± 0.177 | 0.311 | ± 0.167 |
| CEU | 0.304 | ± 0.177 | 0.302 | ± 0.171 |
| YRI | 0.307 | ± 0.174 | 0.303 | ± 0.167 |
Table 2.
Pairwise FST between Populations
| JPT | CHB | UIG | CEU | |
|---|---|---|---|---|
| CHB | 0.007 | |||
| UIG | 0.036 | 0.037 | ||
| CEU | 0.105 | 0.107 | 0.028 | |
| YRI | 0.182 | 0.185 | 0.146 | 0.166 |
Table 3.
Pairwise Identity-by-State (IBS) Sharing and Identity-by-Descent (IBD) Sharing within Populations
| IBS Sharing | IBD Sharing | |||
|---|---|---|---|---|
| JPT | 0.703 | ± 0.012 | 0.035 | ± 0.046 |
| CHB | 0.706 | ± 0.011 | 0.029 | ± 0.041 |
| UIG | 0.704 | ± 0.011 | 0.026 | ± 0.039 |
| CEU | 0.709 | ± 0.012 | 0.035 | ± 0.044 |
| YRI | 0.712 | ± 0.009 | 0.030 | ± 0.039 |
Principal-Coordinate Analysis of Individuals
Principal-coordinate analysis (PCO) provides a useful means of revealing relationships among individuals. Figure 2 is a two-dimensional plot displaying the first two PCO axes for all individuals, with allele-sharing distance (ASD) used for all pairwise combinations of individuals. Individuals from one population cluster tightly, to the exclusion of individuals from other populations. The first two axes together explain 25.8 % of the total variation, and each of the remaining axes explains less than 1.5 % of the total variation. The first PCO axis shows a separation of the African and non-African populations and explains 17.57 % of the total variation; the second PCO axis explains 8.27 % of the total variation and shows a separation of the European and East Asian populations, with UIG individuals lying between them. This is also an expected result of UIG as an admixed population.
Figure 2.

Principal-Coordinate-Analysis Representation of the Allele-Sharing Distance
Populations included are indicated by the symbols listed in the legend. The first two axes together explain 25.8 percent of the total variation (17.57 percent by the first axis and 8.27 percent by the second), and the rest of the axes each explain less than 1.5 percent of the total variation.
STRUCTURE Analysis and Estimation of Admixture Proportion of Individuals
Evidence of Two-Way Admixture
Given the large number of markers in our dataset, genetic analyses can be performed at the level of individual, making no presumption of group membership. We applied a model-based clustering algorithm, implemented by the computer program STRUCTURE, to infer the genetic ancestry of individuals. Our approach is solely based on genotype, without incorporation of any information on sampling location or population affiliation of each individual. For each data set of which markers were randomly selected by controlling BMD > 200 kb, we ran STRUCTURE from K = 2 to K = 6. Ten repeats were done for each K and each data set. According to the distribution of Ln(Pr), as shown in Figure 3, the most probable and appropriate number of clusters should be three in our dataset. The three clusters correspond to African, European, and Asian populations. The middle plots in Figure 4 are the average results of ten data sets at K = 3 (there were some variations of the estimations of admixture proportion of UIG, as shown in Figures S5 and S6; each cluster depicted by one color corresponds to an ethnic group). The results showed that individuals from the same population often shared membership coefficients in the inferred cluster, with UIG individuals displaying strong admixture of both European and Asian clusters. The admixture proportion of populations are shown in Table 4. The UIG population has average of 56.2% of admixture from European ancestry and 41.7% of admixture from East Asian ancestry, and the other populations were dominated by single East Asian, European, or African cluster. Notably, the distribution of admixture proportions among UIG individuals is relatively even, with 48.7% the lowest admixture from European ancestry and the highest 62.2%. The standard deviation is only 3.8%, which is much smaller than the estimation for the African-American (AfA) population,58 suggesting a much longer history of admixture events for the Uyghur population compared with the AfA population.
Figure 3.
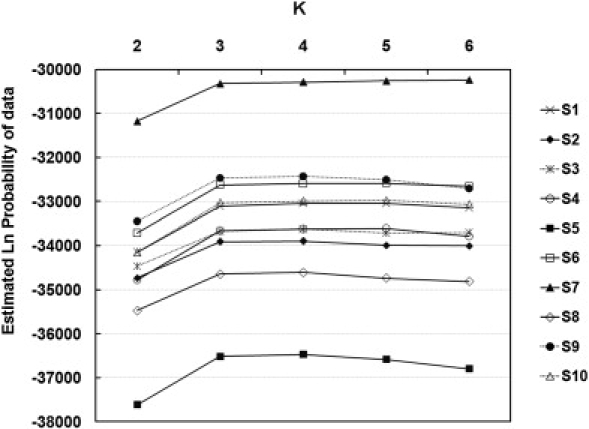
Probability Estimations for the Number of Clusters, with Ten Randomly Selected Data Sets
The ordinate shows the Ln probability corresponding to the number of clusters (K) shown on the abscissa.
Figure 4.
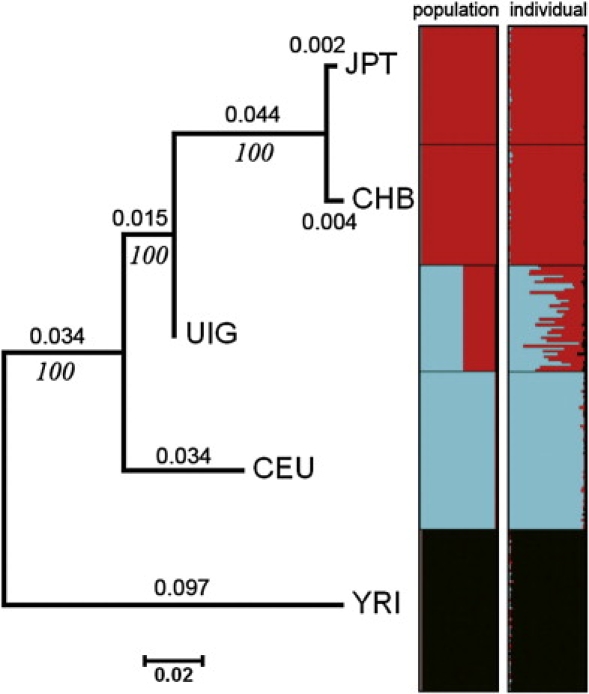
Phylogenetic Analysis and Structure Analysis of UIG and Four HapMap Population Samples
The left population tree is based on pairwise FST between populations, the middle plot shows admixture proportion at population level, and the right plot shows the admixture level at individual level.
Table 4.
Population Admixture-Proportion Percentages Estimated from Random Markers
| Cluster1 | Cluster2 | Cluster3 | ||||
|---|---|---|---|---|---|---|
| JPT | 0.6 | ± 0.2 | 1.2 | ± 0.3 | 98.1 | ± 0.4 |
| CHB | 0.7 | ± 0.2 | 1.4 | ± 0.4 | 97.9 | ± 0.5 |
| UIG | 2.1 | ± 0.8 | 56.2 | ± 3.8 | 41.7 | ± 3.9 |
| CEU | 0.8 | ± 0.2 | 97.8 | ± 0.3 | 1.4 | ± 0.2 |
| YRI | 97.9 | ± 0.6 | 1.1 | ± 0.3 | 1.0 | ± 0.3 |
Cluster1 corresponds to African ancestry.
Cluster2 corresponds to European ancestry.
Cluster3 corresponds to East Asian ancestry.
Admixture Proportion and Time of Admixture
The STRUCTURE results from random markers showed that UIG was an admixed population with contributions from both European and East Asian ancestries. We thus selected AIMs according to allele frequency of CHB and CEU for further estimation of the admixture proportion of UIG. Table 5 shows the admixture proportions estimated from 83 AIMs. The UIG population has 60% of admixture from European ancestry and 40% of admixture from East Asian ancestry. Individual admixture proportion was estimated for each UIG individual, and Figure 5 shows the distribution of admixture proportions of UIG individuals. The proportion of East Asian ancestry in UIG individuals ranges from 15.7% to 59.7%, and the proportion of European ancestry in UIG individuals ranges from 40.3% to 84.3%. We ran a linkage model for 83 AIMs and obtained the estimation of recombination parameter r (breakpoints per cM). The posterior distribution of r is shown in Figure 6. On average, there were 1.26 breakpoints per cM, with a 90% confidence interval of [1.07, 1.46]. Under the assumption of a hybrid-isolation (HI) model, the admixture event of UIG was estimated to have taken place about 126 [107∼146] generations or 2520 [2140∼2920] years ago, assuming 20 years per generation.
Table 5.
Population Admixture-Proportion Percentages Estimated from 83 AIMs
| Cluster1 | Cluster2 | |||
|---|---|---|---|---|
| CHB | 3.1 | ± 0.1 | 96.9 | ± 0.1 |
| UIG | 60.0 | ± 0.1 | 40.0 | ± 0.1 |
| CEU | 97.1 | ± 0.1 | 2.9 | ± 0.1 |
Cluster1 corresponds to European ancestry.
Cluster2 corresponds to East Asian ancestry.
Note: estimations from ten repeat runs are of very little difference.
Figure 5.
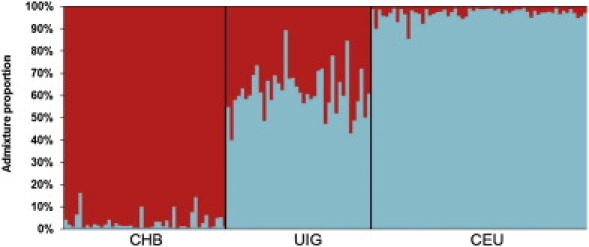
Summary Plot of Individual Admixture Proportions
The results of individual admixture proportions estimated from 83 AIMs. Each individual is represented by a single vertical line broken into two colored segments, with lengths proportional to each of the two inferred clusters. Red indicates East Asian ancestry proportion, and blue indicates European ancestry proportion. The predefined population IDs (CHB, UIG, and CEU) are presented on the abscissa. The ordinate indicates the proportion unit.
Figure 6.

Posterior Distribution of the Recombination Parameter r, per Centimorgan
Both the mean and median of r are 1.26, with a 90% confidence level of [1.07, 1.46], so the admixture event happened about 126 [107, 146] generations or 2520 [2140, 2920] years ago, assuming 20 years per generation.
Inferred Ancestral Origins of Chromosomal Segments in UIG
Using selected AIMs, we further inferred the ancestral origins of chromosomal segments in 40 UIG individuals. We selected a panel of 83 AIMs encompassing an overall area of 63.37 cM on chromosome 21 for estimation of the ancestry of alleles. The STRUCTURE program49 was run under the linkage model with the option of correlated allele frequency. The estimated haplotypes from the 40 UIG individuals were examined together with the phased data from the 60 CEU and 45 CHB subjects under a two-population model (K = 2).
With the assumption that East Asian and European populations were the only two parental populations, STRUCTURE provided the probability of an allele being derived from either the East Asian cluster or the European cluster. The natural logarithms of the probability ratio (LnPR) that an allele was derived from the East Asian cluster over the European cluster were estimated, and the results are depicted in Figure 7. The results provide information on the ancestry of the chromosome segments for each individual (see Supplemental Data for details). As expected, the UIG haplotypes showed contributions from both parental populations (Figure 7). The contribution from European ancestry was greater than that from East Asian ancestry in UIG. The mean contributions of ancestry were 60% (minimum 40.3% and maximum 84.3%) from European ancestry and 40% (minimum 15.7% and maximum 59.7%) from East Asian ancestry. Some segments existed for which ancestry was uncertain (shown in gray in Figure 7), because it is difficult to precisely define the length of the segments in UIG derived from each population sample. Notably, most ambiguous segments were distributed in the region with few or even no AIMs (AIM “deserts”). The cumulative frequencies of segment sizes that were derived from East Asian ancestry and from European ancestry are shown in Figure S7. The first quartile of segment size with East Asian ancestry was 0.55 cM, the second quartile was 1.68 cM, and the third quartile was 3.24 cM. For chromosomal segments with European ancestry, the first quartile of segment size was 0.83 cM, the second quartile was 3.14 cM, and the third quartile was 5.09 cM. The average sizes of chromosomal segments that were derived from East Asian ancestry and European ancestry were 2.43 cM and 4.07 cM, respectively.
Figure 7.
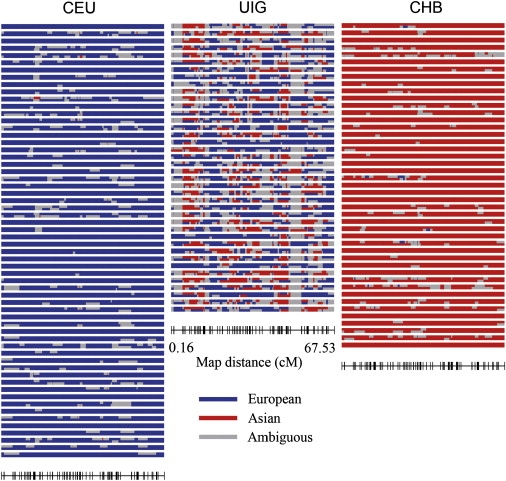
Inferred Ancestral Origins of a 67.37 cM Segment of Chromosome 21 in Three Populations
Each column represents a population. The first column shows 60 CEU subjects, the second column shows 40 UIG subjects, and the third column shows 45 CHB subjects. Chromosome pairs are depicted with spaces between individual subjects. The Ln of the ratio of the probability that each locus on each haplotype in each individual derived from either Asian or European ancestry was determined for each individual and coded as red (Ln Asian/European > 1.0), blue (Ln Asian/European < −1.0), or gray lines (Ln Asian/European < 1.0, > −1.0). The marker positions (Rutgers map) are depicted in the bottom of UIG plot, and are the same in the three populations.
Overall LD in Uyghur and its Parental Populations
The extent of LD was examined across Chromosome 21 in UIG, Han Chinese (CHB), and European (CEU) samples for markers with minor-allele frequency (MAF) ≥ 0.05 (Figure 8a; Tables S2 and S3) and for markers with MAF ≥ 0.15 (Figure 8b; Tables S4 and S5). Proportions of marker pairs with LD at different levels of r2 (<0.1, ≥0.1, ≥0.2, ≥1/3, ≥0.5, ≥0.8) were plotted against between-marker distance (denoted as BMD hereafter). Interestingly, the admixed population UIG did not show stronger LD than did CHB and CEU. In fact, for both groups of SNPs, UIG showed weaker LD at each level of r2 ≥ 0.2. For example, when r2 ≥ 0.8 for common alleles and BMD ≤ 300kb, the proportion of marker pairs in UIG was only 68% of CHB and 75% of CEU. Furthermore, the extent of LD in marker pairs of UIG is very similar to that of CHB and CEU; i.e., LD levels of r2 ≥ 0.2 extend no more than 300 kb in all three populations, and strong LD levels (r2 ≥ 0.8) extend less than 100 kb.
Figure 8.
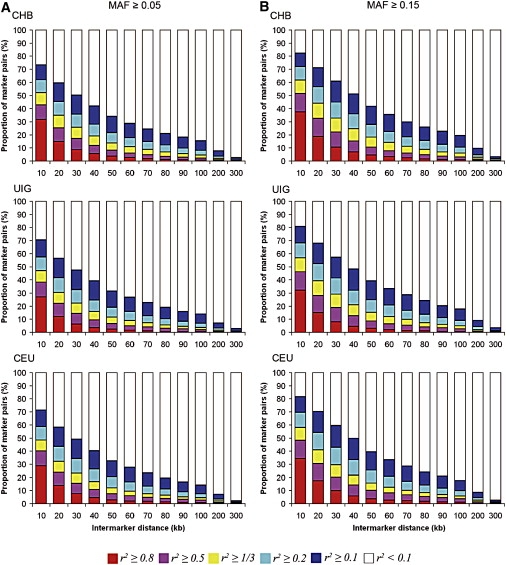
Comparison of the Proportion of Marker Pairs of Different r2 Levels in UIG and its Parental Populations
(A) LD was calculated from markers with MAF ≥ 0.05 in each population.
(B) LD was calculated from markers with MAF ≥ 0.15 in each population.
Magnitude and Extension of LD in UIG with AIMs
Previous studies reported that extended LD in admixed populations such as AfA was concealed by unselected markers and that increased LD in AfA was correlated with increasing allele-frequency differences between the markers of Europeans and Africans.59,60 We showed in a recent study that LD in an admixed population correlates with allele-frequency difference between parental populations,58 which can be measured by FST.
We selected 602 SNPs with large FST (mean FST = 0.48, mean δ = 0.52) between CHB and CEU as AIMs and compared the magnitude and extension of LD in all three populations by using these AIMs. We calculated r2 for each of the marker pairs (a total of 180,901 pairs) by using the haplotypes inferred by the PHASE program. To investigate the extension of LD, we compared the distributions of r2 in 180,901 marker pairs in three populations. The LD in UIG extends a little further than do those in CHB and CEU, especially when 0.2 > r2 ≥ 0.1 (Figure 9; Tables S6 and S7). For example, in UIG, LD extends to 2,000 kb at a level of r2 ≥ 0.1 (corresponding to Kruglyak's useful LD54). In contrast, LD at a level of r2 ≥ 0.1 extends to no more than 300 kb in both CHB and CEU samples. However, the proportion of marker pairs with higher LD, as high as r2 ≥ 0.8 in UIG, is even smaller than that of CEU (Figure 9 and Table S7). In fact, at a level of r2 ≥ 0.8 and within 200 kb, the proportion of marker pairs in UIG only slightly exceeds that of CHB (1.12-fold) and is even smaller than that of CEU (0.69-fold). At the other r2 levels, the proportion of marker pairs in UIG is, on average, larger than that of CHB and CEU. For example, at a level of r2 ≥ 0.5, the proportion of marker pairs in UIG is 2.18-fold of that in CHB and 1.04-fold of that in CEU; at a level of r2 ≥ 1/3 (the Ardlie's useful LD,56), the proportion of marker pairs in UIG is 2.63-fold of that in CHB and 2.09-fold of that in CEU; at a level of r2 ≥ 0.2, the proportion of marker pairs in UIG is 1.33-fold of that in CHB and 3.26-fold of that in CEU; and at a level of r2 ≥ 0.1, the proportion of marker pairs in UIG is 2.65-fold of that in CHB and 5.38-fold of that in CEU. Therefore, when AIMs were used, elevated LDs in UIG were mostly observed in the range of 0.1 ≤ r2 < 0.8 and at BMD < 2,000 kb.
Figure 9.
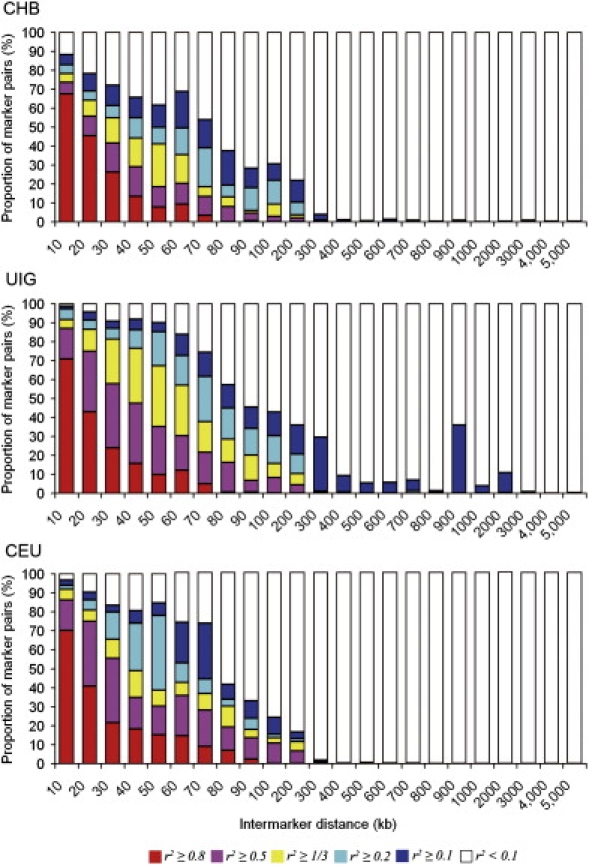
Comparison of the Proportion of Marker Pairs of Different r2 Levels in UIG and its Parental Populations for 602 AIMs
Discussion
In this report, we dissected the genetic structure of a Uyghur population sample at population, individual, and chromosome level by using 20,177 markers densely distributed across the entire chromosome 21.
At population level, STRUCTURE analysis showed that UIG was a typical two-way admixed population with ancestries contributed from both East Asian and European origins. In this study, we included only population samples from three continental groups; i.e., African, European, and East Asian population samples. We did not test the other possible sources of UIG's ancestral origin, such as South-Asian and Southeast Asian ancestries. However, because STRUCTURE posterior probabilities strongly supported two-way admixture, it is unlikely that there was a third parental population of UIG with genetic components that are substantially different from those of European or East Asian ancestry. The admixture proportion was estimated as 60% from European ancestry and 40% from East Asian ancestry; thus, European ancestry contributed slightly more to Uyghur genomes than did East Asian ancestry. This result is consistent with pairwise FST between populations estimated from entire markers: average FST between UIG and CEU was 0.028, which is much smaller than FST between UIG and CHB (0.037). The Uyghur samples used in this study were collected in Hetian, which is located in Southern Xinjiang, where the Uyghur population was thought to be less affected by the recent migration of Han Chinese than are Uyghur populations in Northern Xinjiang. Therefore, our estimation in this study is expected to be different from that of some previous studies on UIG samples collected in northern Xinjiang,2,8 where more interaction occurred between Han Chinese and Uyghur; for example, the estimation of European admixture proportions in some previous studies on UIG samples collected in northern Xinjiang was 30%. In addition, previous studies investigated only very few loci or even just a single locus.1,2,7,8 However, this discrepancy in admixture estimation should not significantly alter the mapping strategy.
At the individual level, the proportion of East Asian ancestry in UIG individuals ranges from 15.7% to 59.7%, and the proportion of European ancestry in UIG individuals ranges from 40.3% to 84.3%. The distribution of admixture proportions among UIG individuals is relatively even, and the variation is much smaller than the estimation of variation in the AfA population.58 It is unlikely that such results were due to sampling of closely related individuals, because the IBD values within UIG samples were the lowest in all populations (CHB, JPT, CEU, YRI) (Table 3). Furthermore, the ancestry variation among individuals could even be overestimated, given that the result was based on the data of one single chromosome. This result suggests a much longer history of admixture events for the Uyghur population compared with the AfA population, because recombination over many generations has interwoven chromosome segments derived from both ancestries and drift of ancestries among individuals has become very small.
At the chromosomal level, we inferred the ancestral origins of UIG chromosome segments: the average size of chromosome segments that were derived from East Asian and European populations were 2.4 cM and 4.1 cM, respectively. The estimated recombination rate was about 1.07–1.46 breakpoints per cM. Under the assumption of a hybrid-isolation (HI) model, the admixture event of UIG was estimated to have taken place about 107–146 generations, or 2140–2920 years ago assuming 20 years per generation. The word “Uyghur” (alternatively Uygur, Uigur, and Uighur) originates from the Old Turkish word “Uyγur.” On the basis of its Old Turkish phonetics, the word “Uyγur” was rendered differently in Chinese during different periods of China's history. The most ancient translation of the word “Uyγur” in Chinese was “Yuanhe,” which appears in Weishu (History of the Wei Dynasty), which was compiled during the period of Northern Qi (550–577 AD). The ancestors of the Uyghur (Gaoche) can be traced to the Chidi and Dingling in the third century B.C. (See Sima Qian, ‘Shiji’ Vol. 110: Xiongnu). Therefore, the estimated admixture time could be concordant with the historical record. However, this result could be underestimated due to the assumption of a hybrid-isolation (HI) model. In this model, we assumed that Uyghur was formed by a single event of admixture during a short period of time, which might not be true of the real history of the Uyghur. Considering the geographical location where the Uyghur settled, continuous gene flow from populations of European and Asian descent was very likely. Because the time estimation in this study was based on the information of recombination or linkage disequilibrium (LD), which decays with time of generations, LD could have been maintained to some extent, and recombination information could have been diluted if there had been continuous gene flow; thus, the time of admixture could be underestimated. In addition, the time of admixture could be underestimated because the distribution of the length of chromosome segments might be biased toward large segments due to the large spacing between markers and the uncertainty in the ancestry estimation of some alleles. Furthermore, switch errors are almost inevitable when haplotypes are inferred from genotype data of unrelated individuals. For the inferred haplotype data of 83 AIMs, we estimated the switch error rate as 1 per 22 SNPs in CEU, 1 per 25 SNPs in CHB, and 1 per 19 SNPs in UIG. In other words, on average there would be four potential phasing errors in CEU, three potential phasing errors in CHB, and four potential phasing errors in UIG. However, we think the switch errors have limited influence on the downstream analysis, i.e., the estimation of ancestral origin of chromosomal segments, because of the following reasons: (1) the recombination rate (breakpoints per cM) estimated from phased data is consistent with that estimated from unphased data; (2) considering the recombination rate, the frequency of breakpoints is much higher than that of switch errors—for example, the breakpoint rate in UIG is estimated at an average of 1.26 per 1 cM, or 85 breaks per 67.4 cM, whereas the switch error in UIG is only about 4 per 67.4 cM; (3) for many AIMs, we observed several UIG individuals with both alleles derived from the same ancestry; i.e., the phase information is not so important for those markers and individuals.
Regardless of the model of admixture, UIG showed much weaker LD compared with more recently admixed populations, such as the AfA population.58 In fact, using all markers, we showed that LD in UIG is indeed similar to or even weaker than that of Han Chinese and European American samples. UIG manifests extended LD only when AIMs are used, but not when all SNPs are included—elevated LDs in UIG were mostly observed in the range of 0.1 ≤ r2 < 0.8 and at BMD < 2,000 kb. In contrast, LDs in AfA at this level (r2 ≥ 0.1) extended to more than 20,000 kb when AIMs were examined.58 The average size of the UIG chromosome segments that were derived from East Asian and European ancestry were estimated as 2.4 cM and 4.1 cM, respectively, which were also much shorter than the average size of AfA chromosome segments that were derived from African and European ancestry (30.1 cM and 13.7 cM, respectively).58
In spite of the long history and short LD of Uyghur as compared with more recently admixed populations such as the AfA population, the MALD strategy can be still feasible for some particular diseases. Basically, the following requirements need to be met for MALD:14 First, MALD-based identification of disease genes requires a measurable difference in the frequency of disease-causing alleles between the parental populations. Second, admixture ideally needs to be at least two generations old to reduce the initial disequilibrium across chromosomes and between unlinked loci, whereas LD within chromosomes remains strong.12,18 For the Uyghur population, this is not a problem, as we showed above. Third, a set of markers that specifically differentiate chromosomes derived from the parental populations is needed.28,37 As we mentioned earlier in Subjects and Methods, in 20,177 SNPs on chromosome 21, for 5.1% of markers with δ > 0.5, 5.7% of markers with In > 0.2, 4.5% of markers with f > 0.3, and 5.4% of markers with FST > 0.3, the average between marker distance is about 0.06 cM, which should be adequate for performing MALD in UIG. Fourth, a level of admixture that is greater than 10% (both ancestry contributions range from 10% ∼90%) is needed for MALD to be feasible.22 As we estimated in this study, both parental populations contributed more than 40% to Uyghur's genomes. Finally, the extent of admixture LD will determine how many markers are needed for MALD. Recent admixture populations, such as the AfA population, have been estimated to require 2,000–3,000 markers, which is 200–500 times fewer than those that are required for whole-genome haplotype-based mapping.18,47,61 Because the extended LD of the Uyghur population is about 10 percent of that of the AfA population, we estimated 10-fold markers; i.e., about 20,000–30,000 AIMs are needed for a whole-genome scan by MALD in the Uyghur population. This is still economically sensible compared with the current cost of whole-genome scans with 500,000 random markers. However, all the analyses and the results we presented are based on the analysis of a single chromosome; whether the conclusions can be generalized on a genome-wide level needs to be further studied.
Supplemental Data
Seven supplemental figures and seven supplemental tables are available with this paper online at http://www.ajhg.org/.
Supplemental Data
Web Resources
The URLs for data presented herein are as follows:
Arlequin version 3.11 program, http://cmpg.unibe.ch/software/arlequin3/
International HapMap Project, http://www.hapmap.org/downloads/index.html.en
PHASE 2.1 program, http://www.stat.washington.edu/stephens/software.html
PLINK program, http://pngu.mgh.harvard.edu/∼purcell/plink/
SNP Genetic Mapping, http://actin.ucd.ie/cgi-bin/rs2cm.cgi
STRUCTURE 2.2 program, http://pritch.bsd.uchicago.edu/structure.html
Acknowledgments
This work was supported by grants from the Chinese High-Tech Program (863) (2002BA711A10), the Basic Research Program of China (973) (2004CB518605, 2002CB512900), the National Natural Science Foundation of China (NSFC30571060), and the Shanghai Science and Technology Committee (04DZ14003). This work was also supported by Shanghai Leading Academic Discipline Project (No. B111).
References
- 1.Norton H.L., Kittles R.A., Parra E., McKeigue P., Mao X., Cheng K., Canfield V.A., Bradley D.G., McEvoy B., Shriver M.D. Genetic evidence for the convergent evolution of light skin in Europeans and East Asians. Mol. Biol. Evol. 2007;24:710–722. doi: 10.1093/molbev/msl203. [DOI] [PubMed] [Google Scholar]
- 2.Cui Y., Zhou H. Analysis of genetic structure of the ancient Xinjiang population. Journal of the Central University for Nationalities. 2004;31:34–36. [Google Scholar]
- 3.Xiao F.X., Yang J.F., Cassiman J.J., Decorte R. Diversity at eight polymorphic Alu insertion loci in Chinese populations shows evidence for European admixture in an ethnic minority population from northwest China. Hum. Biol. 2002;74:555–568. doi: 10.1353/hub.2002.0050. [DOI] [PubMed] [Google Scholar]
- 4.Comas D., Calafell F., Mateu E., Perez-Lezaun A., Bosch E., Martinez-Arias R., Clarimon J., Facchini F., Fiori G., Luiselli D. Trading genes along the silk road: mtDNA sequences and the origin of central Asian populations. Am. J. Hum. Genet. 1998;63:1824–1838. doi: 10.1086/302133. [DOI] [PMC free article] [PubMed] [Google Scholar]
- 5.Perez-Lezaun A., Calafell F., Comas D., Mateu E., Bosch E., Martinez-Arias R., Clarimon J., Fiori G., Luiselli D., Facchini F. Sex-specific migration patterns in Central Asian populations, revealed by analysis of Y-chromosome short tandem repeats and mtDNA. Am. J. Hum. Genet. 1999;65:208–219. doi: 10.1086/302451. [DOI] [PMC free article] [PubMed] [Google Scholar]
- 6.Wells R.S., Yuldasheva N., Ruzibakiev R., Underhill P.A., Evseeva I., Blue-Smith J., Jin L., Su B., Pitchappan R., Shanmugalakshmi S. The Eurasian heartland: a continental perspective on Y-chromosome diversity. Proc. Natl. Acad. Sci. USA. 2001;98:10244–10249. doi: 10.1073/pnas.171305098. [DOI] [PMC free article] [PubMed] [Google Scholar]
- 7.Lai S.P., Ren H., Hu H., Li S., Lai J., Yan C., Zhang H., Zhao J. HLA-DRB alleles polymorphism in Han, Hui, Uygur and Tibetan populations in Northwestern China. Acta Genetica Sinica. 1999;26:447–457. [PubMed] [Google Scholar]
- 8.Su B., Xiao J., Underhill P., Deka R., Zhang W., Akey J., Huang W., Shen D., Lu D., Luo J. Y-Chromosome evidence for a northward migration of modern humans into Eastern Asia during the last Ice Age. Am. J. Hum. Genet. 1999;65:1718–1724. doi: 10.1086/302680. [DOI] [PMC free article] [PubMed] [Google Scholar]
- 9.Comas D., Plaza S., Wells R.S., Yuldaseva N., Lao O., Calafell F., Bertranpetit J. Admixture, migrations, and dispersals in Central Asia: evidence from maternal DNA lineages. Eur. J. Hum. Genet. 2004;12:495–504. doi: 10.1038/sj.ejhg.5201160. [DOI] [PubMed] [Google Scholar]
- 10.Ai Q., Xiao H., Zhao J., Xu Y., Shi F. A survey on physical characteristics of Uigur Nationality. ACTA Anthropologica Sinica. 1993;12:357–365. [Google Scholar]
- 11.Reich D., Patterson N. Will admixture mapping work to find disease genes? Philos. Trans. R. Soc. Lond. B Biol. Sci. 2005;360:1605–1607. doi: 10.1098/rstb.2005.1691. [DOI] [PMC free article] [PubMed] [Google Scholar]
- 12.McKeigue P.M. Prospects for admixture mapping of complex traits. Am. J. Hum. Genet. 2005;76:1–7. doi: 10.1086/426949. [DOI] [PMC free article] [PubMed] [Google Scholar]
- 13.Seldin M.F. Admixture mapping as a tool in gene discovery. Curr. Opin. Genet. Dev. 2007;17:177–181. doi: 10.1016/j.gde.2007.03.002. [DOI] [PMC free article] [PubMed] [Google Scholar]
- 14.Smith M.W., O'Brien S.J. Mapping by admixture linkage disequilibrium: advances, limitations and guidelines. Nat. Rev. Genet. 2005;6:623–632. doi: 10.1038/nrg1657. [DOI] [PubMed] [Google Scholar]
- 15.Chakraborty R., Weiss K.M. Admixture as a tool for finding linked genes and detecting that difference from allelic association between loci. Proc. Natl. Acad. Sci. USA. 1988;85:9119–9123. doi: 10.1073/pnas.85.23.9119. [DOI] [PMC free article] [PubMed] [Google Scholar]
- 16.Risch N. Mapping genes for complex diseases using association studies with recently admixed populations. Am. J. Hum. Genet. Suppl. 1992;51:13. [Google Scholar]
- 17.Briscoe D., Stephens J.C., O'Brien S.J. Linkage disequilibrium in admixed populations: applications in gene mapping. J. Hered. 1994;85:59–63. [PubMed] [Google Scholar]
- 18.Stephens J.C., Briscoe D., O'Brien S.J. Mapping by admixture linkage disequilibrium in human populations: limits and guidelines. Am. J. Hum. Genet. 1994;55:809–824. [PMC free article] [PubMed] [Google Scholar]
- 19.McKeigue P.M. Mapping genes underlying ethnic differences in disease risk by linkage disequilibrium in recently admixed populations. Am. J. Hum. Genet. 1997;60:188–196. [PMC free article] [PubMed] [Google Scholar]
- 20.Zhu X., Cooper R.S., Elston R.C. Linkage analysis of a complex disease through use of admixed populations. Am. J. Hum. Genet. 2004;74:1136–1153. doi: 10.1086/421329. [DOI] [PMC free article] [PubMed] [Google Scholar]
- 21.Zhu X., Zhang S., Tang H., Cooper R. A classical likelihood based approach for admixture mapping using EM algorithm. Hum. Genet. 2006;120:431–445. doi: 10.1007/s00439-006-0224-z. [DOI] [PubMed] [Google Scholar]
- 22.Patterson N., Hattangadi N., Lane B., Lohmueller K.E., Hafler D.A., Oksenberg J.R., Hauser S.L., Smith M.W., O'Brien S.J., Altshuler D. Methods for high-density admixture mapping of disease genes. Am. J. Hum. Genet. 2004;74:979–1000. doi: 10.1086/420871. [DOI] [PMC free article] [PubMed] [Google Scholar]
- 23.Reich D., Patterson N., De Jager P.L., McDonald G.J., Waliszewska A., Tandon A., Lincoln R.R., DeLoa C., Fruhan S.A., Cabre P. A whole-genome admixture scan finds a candidate locus for multiple sclerosis susceptibility. Nat. Genet. 2005;37:1113–1118. doi: 10.1038/ng1646. [DOI] [PubMed] [Google Scholar]
- 24.Reich D., Patterson N., Ramesh V., De Jager P.L., McDonald G.J., Tandon A., Choy E., Hu D., Tamraz B., Pawlikowska L. Admixture mapping of an allele affecting interleukin 6 soluble receptor and interleukin 6 levels. Am. J. Hum. Genet. 2007;80:716–726. doi: 10.1086/513206. [DOI] [PMC free article] [PubMed] [Google Scholar]
- 25.Wassel Fyr C.L., Kanaya A.M., Cummings S.R., Reich D., Hsueh W.C., Reiner A.P., Harris T.B., Moffett S., Li R., Ding J. Genetic admixture, adipocytokines, and adiposity in Black Americans: the Health, Aging, and Body Composition study. Hum. Genet. 2007;121:615–624. doi: 10.1007/s00439-007-0353-z. [DOI] [PubMed] [Google Scholar]
- 26.Oksenberg J.R., Barcellos L.F., Cree B.A., Baranzini S.E., Bugawan T.L., Khan O., Lincoln R.R., Swerdlin A., Mignot E., Lin L. Mapping multiple sclerosis susceptibility to the HLA-DR locus in African Americans. Am. J. Hum. Genet. 2004;74:160–167. doi: 10.1086/380997. [DOI] [PMC free article] [PubMed] [Google Scholar]
- 27.Price A.L., Patterson N., Yu F., Cox D.R., Waliszewska A., McDonald G.J., Tandon A., Schirmer C., Neubauer J., Bedoya G. A genomewide admixture map for Latino populations. Am. J. Hum. Genet. 2007;80:1024–1036. doi: 10.1086/518313. [DOI] [PMC free article] [PubMed] [Google Scholar]
- 28.Smith M.W., Patterson N., Lautenberger J.A., Truelove A.L., McDonald G.J., Waliszewska A., Kessing B.D., Malasky M.J., Scafe C., Le E. A high-density admixture map for disease gene discovery in african americans. Am. J. Hum. Genet. 2004;74:1001–1013. doi: 10.1086/420856. [DOI] [PMC free article] [PubMed] [Google Scholar]
- 29.Barnes K.C., Grant A.V., Hansel N.N., Gao P., Dunston G.M. African Americans with asthma: genetic insights. Proc. Am. Thorac. Soc. 2007;4:58–68. doi: 10.1513/pats.200607-146JG. [DOI] [PMC free article] [PubMed] [Google Scholar]
- 30.Mao X., Bigham A.W., Mei R., Gutierrez G., Weiss K.M., Brutsaert T.D., Leon-Velarde F., Moore L.G., Vargas E., McKeigue P.M. A genomewide admixture mapping panel for Hispanic/Latino populations. Am. J. Hum. Genet. 2007;80:1171–1178. doi: 10.1086/518564. [DOI] [PMC free article] [PubMed] [Google Scholar]
- 31.Martinez-Marignac V.L., Valladares A., Cameron E., Chan A., Perera A., Globus-Goldberg R., Wacher N., Kumate J., McKeigue P., O'Donnell D. Admixture in Mexico City: implications for admixture mapping of type 2 diabetes genetic risk factors. Hum. Genet. 2007;120:807–819. doi: 10.1007/s00439-006-0273-3. [DOI] [PubMed] [Google Scholar]
- 32.Shriver M.D., Mei R., Bigham A., Mao X., Brutsaert T.D., Parra E.J., Moore L.G. Finding the genes underlying adaptation to hypoxia using genomic scans for genetic adaptation and admixture mapping. Adv. Exp. Med. Biol. 2006;588:89–100. doi: 10.1007/978-0-387-34817-9_9. [DOI] [PubMed] [Google Scholar]
- 33.Tang H., Jorgenson E., Gadde M., Kardia S.L., Rao D.C., Zhu X., Schork N.J., Hanis C.L., Risch N. Racial admixture and its impact on BMI and blood pressure in African and Mexican Americans. Hum. Genet. 2006;119:624–633. doi: 10.1007/s00439-006-0175-4. [DOI] [PubMed] [Google Scholar]
- 34.Tian C., Hinds D.A., Shigeta R., Adler S.G., Lee A., Pahl M.V., Silva G., Belmont J.W., Hanson R.L., Knowler W.C. A genomewide single-nucleotide-polymorphism panel for Mexican American admixture mapping. Am. J. Hum. Genet. 2007;80:1014–1023. doi: 10.1086/513522. [DOI] [PMC free article] [PubMed] [Google Scholar]
- 35.Tian C., Hinds D.A., Shigeta R., Kittles R., Ballinger D.G., Seldin M.F. A genomewide single-nucleotide-polymorphism panel with high ancestry information for African American admixture mapping. Am. J. Hum. Genet. 2006;79:640–649. doi: 10.1086/507954. [DOI] [PMC free article] [PubMed] [Google Scholar]
- 36.Zhu X., Luke A., Cooper R.S., Quertermous T., Hanis C., Mosley T., Gu C.C., Tang H., Rao D.C., Risch N. Admixture mapping for hypertension loci with genome-scan markers. Nat. Genet. 2005;37:177–181. doi: 10.1038/ng1510. [DOI] [PubMed] [Google Scholar]
- 37.Smith M.W., Lautenberger J.A., Shin H.D., Chretien J.P., Shrestha S., Gilbert D.A., O'Brien S.J. Markers for mapping by admixture linkage disequilibrium in African American and Hispanic populations. Am. J. Hum. Genet. 2001;69:1080–1094. doi: 10.1086/323922. [DOI] [PMC free article] [PubMed] [Google Scholar]
- 38.TheInternationalHapMapConsortium The International HapMap Project. Nature. 2003;426:789–796. doi: 10.1038/nature02168. [DOI] [PubMed] [Google Scholar]
- 39.TheInternationalHapMapConsortium A haplotype map of the human genome. Nature. 2005;437:1299–1320. doi: 10.1038/nature04226. [DOI] [PMC free article] [PubMed] [Google Scholar]
- 40.Frazer K.A., Ballinger D.G., Cox D.R., Hinds D.A., Stuve L.L., Gibbs R.A., Belmont J.W., Boudreau A., Hardenbol P., Leal S.M. A second generation human haplotype map of over 3.1 million SNPs. Nature. 2007;449:851–861. doi: 10.1038/nature06258. [DOI] [PMC free article] [PubMed] [Google Scholar]
- 41.Huang W., He Y., Wang H., Wang Y., Liu Y., Wang Y., Chu X., Wang Y., Xu L., Shen Y. Linkage disequilibrium sharing and haplotype-tagged SNP portability between populations. Proc. Natl. Acad. Sci. USA. 2006;103:1418–1421. doi: 10.1073/pnas.0510360103. [DOI] [PMC free article] [PubMed] [Google Scholar]
- 42.Schneider, S., Roessli, D., and Excoffier, L. (2000). Arlequin: A software for population genetics data analysis. Ver 2.000 Genetics and Biometry Lab, Dept of Anthropology, University of Geneva. http://la-press.com/article.php?article_id=188.
- 43.Kong X., Murphy K., Raj T., He C., White P.S., Matise T.C. A combined linkage-physical map of the human genome. Am. J. Hum. Genet. 2004;75:1143–1148. doi: 10.1086/426405. [DOI] [PMC free article] [PubMed] [Google Scholar]
- 44.Mountain J.L., Cavalli-Sforza L.L. Multilocus genotypes, a tree of individuals, and human evolutionary history. Am. J. Hum. Genet. 1997;61:705–718. doi: 10.1086/515510. [DOI] [PMC free article] [PubMed] [Google Scholar]
- 45.Weir B.S., Hill W.G. Estimating F-statistics. Annu. Rev. Genet. 2002;36:721–750. doi: 10.1146/annurev.genet.36.050802.093940. [DOI] [PubMed] [Google Scholar]
- 46.Shriver M.D., Smith M.W., Jin L., Marcini A., Akey J.M., Deka R., Ferrell R.E. Ethnic-affiliation estimation by use of population-specific DNA markers. Am. J. Hum. Genet. 1997;60:957–964. [PMC free article] [PubMed] [Google Scholar]
- 47.McKeigue P.M. Mapping genes that underlie ethnic differences in disease risk: methods for detecting linkage in admixed populations, by conditioning on parental admixture. Am. J. Hum. Genet. 1998;63:241–251. doi: 10.1086/301908. [DOI] [PMC free article] [PubMed] [Google Scholar]
- 48.Rosenberg N.A., Li L.M., Ward R., Pritchard J.K. Informativeness of genetic markers for inference of ancestry. Am. J. Hum. Genet. 2003;73:1402–1422. doi: 10.1086/380416. [DOI] [PMC free article] [PubMed] [Google Scholar]
- 49.Falush D., Stephens M., Pritchard J.K. Inference of population structure using multilocus genotype data: linked loci and correlated allele frequencies. Genetics. 2003;164:1567–1587. doi: 10.1093/genetics/164.4.1567. [DOI] [PMC free article] [PubMed] [Google Scholar]
- 50.Stephens M., Smith N.J., Donnelly P. A new statistical method for haplotype reconstruction from population data. Am. J. Hum. Genet. 2001;68:978–989. doi: 10.1086/319501. [DOI] [PMC free article] [PubMed] [Google Scholar]
- 51.Pritchard J.K., Stephens M., Donnelly P. Inference of population structure using multilocus genotype data. Genetics. 2000;155:945–959. doi: 10.1093/genetics/155.2.945. [DOI] [PMC free article] [PubMed] [Google Scholar]
- 52.Karafet T.M., Lansing J.S., Redd A.J., Reznikova S., Watkins J.C., Surata S.P., Arthawiguna W.A., Mayer L., Bamshad M., Jorde L.B. Balinese Y-chromosome perspective on the peopling of Indonesia: genetic contributions from pre-neolithic hunter-gatherers, Austronesian farmers, and Indian traders. Hum. Biol. 2005;77:93–114. doi: 10.1353/hub.2005.0030. [DOI] [PubMed] [Google Scholar]
- 53.Lewontin R.C. The Interaction of Selection and Linkage. Ii. Optimum Models. Genetics. 1964;50:757–782. doi: 10.1093/genetics/50.4.757. [DOI] [PMC free article] [PubMed] [Google Scholar]
- 54.Kruglyak L. Prospects for whole-genome linkage disequilibrium mapping of common disease genes. Nat. Genet. 1999;22:139–144. doi: 10.1038/9642. [DOI] [PubMed] [Google Scholar]
- 55.Pritchard J.K., Przeworski M. Linkage disequilibrium in humans: models and data. Am. J. Hum. Genet. 2001;69:1–14. doi: 10.1086/321275. [DOI] [PMC free article] [PubMed] [Google Scholar]
- 56.Ardlie K.G., Kruglyak L., Seielstad M. Patterns of linkage disequilibrium in the human genome. Nat. Rev. Genet. 2002;3:299–309. doi: 10.1038/nrg777. [DOI] [PubMed] [Google Scholar]
- 57.Weiss K.M., Clark A.G. Linkage disequilibrium and the mapping of complex human traits. Trends Genet. 2002;18:19–24. doi: 10.1016/s0168-9525(01)02550-1. [DOI] [PubMed] [Google Scholar]
- 58.Xu S., Huang W., Wang H., He Y., Wang Y., Wang Y., Xiong M., Qian J., Jin L. Dissecting linkage disequilibrium in African American: roles of markers and individuals. Mol. Biol. Evol. 2007;24:2049–2058. doi: 10.1093/molbev/msm135. [DOI] [PubMed] [Google Scholar]
- 59.Collins-Schramm H.E., Chima B., Operario D.J., Criswell L.A., Seldin M.F. Markers informative for ancestry demonstrate consistent megabase-length linkage disequilibrium in the African American population. Hum. Genet. 2003;113:211–219. doi: 10.1007/s00439-003-0961-1. [DOI] [PubMed] [Google Scholar]
- 60.Rybicki B.A., Iyengar S.K., Harris T., Liptak R., Elston R.C., Sheffer R., Chen K.M., Major M., Maliarik M.J., Iannuzzi M.C. The distribution of long range admixture linkage disequilibrium in an African-American population. Hum. Hered. 2002;53:187–196. doi: 10.1159/000066193. [DOI] [PubMed] [Google Scholar]
- 61.Darvasi A., Shifman S. The beauty of admixture. Nat. Genet. 2005;37:118–119. doi: 10.1038/ng0205-118. [DOI] [PubMed] [Google Scholar]
Associated Data
This section collects any data citations, data availability statements, or supplementary materials included in this article.