

Abstract
It is well accepted that the Americas were the last continents reached by modern humans, most likely through Beringia. However, the precise time and mode of the colonization of the New World remain hotly disputed issues. Native American populations exhibit almost exclusively five mitochondrial DNA (mtDNA) haplogroups (A–D and X). Haplogroups A–D are also frequent in Asia, suggesting a northeastern Asian origin of these lineages. However, the differential pattern of distribution and frequency of haplogroup X led some to suggest that it may represent an independent migration to the Americas. Here we show, by using 86 complete mitochondrial genomes, that all Native American haplogroups, including haplogroup X, were part of a single founding population, thereby refuting multiple-migration models. A detailed demographic history of the mtDNA sequences estimated with a Bayesian coalescent method indicates a complex model for the peopling of the Americas, in which the initial differentiation from Asian populations ended with a moderate bottleneck in Beringia during the last glacial maximum (LGM), around ∼23,000 to ∼19,000 years ago. Toward the end of the LGM, a strong population expansion started ∼18,000 and finished ∼15,000 years ago. These results support a pre-Clovis occupation of the New World, suggesting a rapid settlement of the continent along a Pacific coastal route.
Introduction
In the complex history of human migrations, it is widely accepted that the New World continents were the ones colonized most recently by Homo sapiens, most likely from Asia through Beringia.1 A popular model for the peopling of the Americas suggests that the archaeological remains known as the Clovis complex (thought to be the oldest unequivocal evidence of humans in the Americas) represent the people that first colonized the continent after a late-glacial migration through the ice-free corridor that separated the Laurentide and Cordilleran ice sheets.1 However, the recently re-evaluated age of the Clovis sites to only between about 12.7 and 13.2 thousand years ago (kya)2 and the confirmed human presence at the Monte Verde site located in southern South America around 14.5 kya3 challenge this Clovis-first model and call for alternative hypotheses. Because the earlier date for Monte Verde implies that peopling of the Americas south of Beringia occurred before the ice-free corridor was formed, a first migration along the Pacific coast may have been a viable route.4 Unfortunately, archaeological verification of this scenario is very difficult because most of the late Pleistocene coast is currently underwater; the sea level has risen more than 120 m since the end of the last glacial maximum (LGM).5
The maternally inherited mitochondrial DNA (mtDNA) has been widely used to understand the peopling of the Americas. Since the first studies, it has been found that extant Native American populations exhibit almost exclusively five mtDNA haplogroups (A–D and X)6 classified in the autochthonous haplogroups A2, B2, C1, D1, and X2a.7 Haplogroups A–D are found all over the New World and are frequent in Asia, supporting a northeastern Asian origin of these lineages.6,8 This distribution, together with the similar coalescence time for these haplogroups, was used to suggest a single-migration model.9–12 However, a different pattern of diversification and distribution of haplogroup B found in some studies led some authors to hypothesize that it could represent a later and separate migration from the joint arrival of haplogroups A, C, and D.13 The history of haplogroup X is more elusive; it is presently found in the New World at a relatively low frequency14 and only in North America,15 it is rare in West Eurasians, and it is almost absent in Siberia.16 In addition, some have claimed that Native American haplogroup X is less diverse and has a younger coalescence time than haplogroups A–D17. These differential features have been cited to argue that haplogroup X represents an independent migration to the Americas from Asia or even Europe.17 More specifically, it has been used to support a putative connection between the European Solutrean and the American Clovis lithic technologies.18 This so called “Solutrean hypothesis” proposed the colonization of North America by Europeans through the North Atlantic, even though this interpretation is heavily debated (e.g.,19). All the five founding haplogroups have been shown to be present in Native Americas in pre-Columbian times.12,20
In general, the studies on mtDNA control-region variation have been taken to support a pre-Clovis migration, between ∼20 and 30 kya, before the LGM, for the single (or the most ancient) migration.6,21 However, the uncertainties about and range around these dates are very large. One cause for this variation is the limited information content of the mtDNA control region, which is also too divergent to allow reliable substitution-rate estimation by comparison with the chimpanzee.22 Alternatively, the complete coding region of the mtDNA is being increasingly used to circumvent these limitations in studies of human migrations (e.g.,22,23) but has not been used so far for studying the origin of Native Americans.
Another frequent controversy is about the size of the founding population during the peopling of the Americas. The initial results showing the existence of few founder haplogroups for the mtDNA and Y chromosome suggested a strong population bottleneck,6 although this interpretation was not supported by further mtDNA studies.21 However, a recent analysis of several genomic loci, including mtDNA, suggested that the Americas could have been founded by as few as 80 effective individuals, and even the largest values in the credible interval only comprise a few hundred effective individuals.24 On the other hand, the study of other single genetic systems does not seem to support much loss of genetic diversity during the initial settlement of the continent;25–28 instead, it concludes that a moderate-intensity bottleneck is the best scenario. Another recent genomic study using exclusively autosomal intergenic markers also suggested moderate values, with the Native American founding population consisting of around 500 effective individuals (95% confidence interval 74–1332).29
In this study, we analyze 86 mtDNA genomes (58 of them new) belonging to all five major Native American haplogroups (A2, B2, C1, D1, and X2a) to provide a better understanding of the timing and mode of the peopling of the New World. Our analysis suggests a complex scenario for this migration, in which the founding population underwent a moderate bottleneck during the LGM to expand along the continent toward the end of the LGM, around 18 kya, probably via a Pacific coastal route. Furthermore, we support a model in which all mtDNA haplogroups were present in this expansion, thus refuting multiple-migration scenarios such as the Solutrean hypothesis.
Material and Methods
Subjects
DNA samples were obtained from 58 individuals from South and North American native populations and most have been collected directly by some of the authors (F.M.S., S.E.B.S., M.A.Z., or D.G.S.). Table 1 provides further details on the individuals studied. All ethical guidelines were followed, as stipulated by the institutions involved in the study.
Table 1.
Individuals Used for the Analyses Whose mtDNAs Were Obtained in this Work or Gathered from Literature
| Hg | ID | GenBank Accession Number | Tribe/Population | Reference |
|---|---|---|---|---|
| A2 | ACHE30 | EU095194 | Ache | ∗∗ |
| A2 | WAI01 | EU095195 | Waiwai | ∗∗ |
| A2 | WAI25 | EU095196 | Waiwai | ∗∗ |
| A2 | ZOR02 | EU095197 | Zoró | ∗∗ |
| A2 | SURU01 | EU095198 | Suruí | ∗∗ |
| A2 | WPI167 | EU095199 | Waiãpi | ∗∗ |
| A2 | Y655 | EU095200 | Yanomama | ∗∗ |
| A2 | PTJ03 | EU095201 | Poturujara | ∗∗ |
| A2 | Y623 | EU095202 | Yanomama | ∗∗ |
| A2 | KKT13 | EU095203 | Kayapó/Kriketun | ∗∗ |
| A2 | KTN130 | EU095204 | Katuena | ∗∗ |
| A2 | GRC149 | EU095205 | Guarani/Rio das Cobras | ∗∗ |
| B2 | ACHE78 | EU095206 | Ache | ∗∗ |
| B2 | GAVI23 | EU095207 | Gavião | ∗∗ |
| B2 | POMO01 | EU095208 | Pomo/North California | ∗∗ |
| B2 | WAI24 | EU095209 | Waiwai | ∗∗ |
| B2 | XAV04 | EU095210 | Xavante | ∗∗ |
| B2 | XAV12 | EU095211 | Xavante | ∗∗ |
| B2 | 1876 | EU095212 | Quechua | ∗∗ |
| B2 | 1880 | EU095213 | Quechua | ∗∗ |
| B2 | 1881 | EU095214 | Quechua | ∗∗ |
| B2 | GRC169 | EU095215 | Guarani/Rio das Cobras | ∗∗ |
| B2 | KBK23 | EU095216 | Kayapó/Kubemkokre | ∗∗ |
| B2 | KBK39 | EU095217 | Kayapó/Kubemkokre | ∗∗ |
| B2 | KKT01 | EU095218 | Kayapó/Kriketun | ∗∗ |
| B2 | KRC33 | EU095219 | Guarani/Rio das Cobras | ∗∗ |
| B2 | KTN209 | EU095220 | Katuena | ∗∗ |
| B2 | Y637 | EU095221 | Yanomama | ∗∗ |
| C1 | WAI16 | EU095222 | Waiwai | ∗∗ |
| C1 | ZOR19 | EU095223 | Zoró | ∗∗ |
| C1 | ZOR31 | EU095224 | Zoró | ∗∗ |
| C1 | 1875 | EU095225 | Quechua | ∗∗ |
| C1 | 1878 | EU095226 | Quechua | ∗∗ |
| C1 | ARL58 | EU095227 | Arara/Arara do Laranjal | ∗∗ |
| C1 | PTJ68 | EU095228 | Poturujara | ∗∗ |
| C1 | Y591 | EU095229 | Yanomama | ∗∗ |
| C1 | Y650 | EU095230 | Yanomama | ∗∗ |
| C1 | Y669 | EU095231 | Yanomama | ∗∗ |
| D1 | GAVI12 | EU095232 | Gavião | ∗∗ |
| D1 | GAVI26 | EU095233 | Gavião | ∗∗ |
| D1 | SUR22 | EU095234 | Suruí | ∗∗ |
| D1 | WAI05 | EU095235 | Waiwai | ∗∗ |
| D1 | ZOR23 | EU095236 | Zoró | ∗∗ |
| D1 | GRC131 | EU095237 | Guarani/Rio das Cobras | ∗∗ |
| D1 | KTN18 | EU095238 | Katuena | ∗∗ |
| D1 | PTJ01 | EU095239 | Poturujara | ∗∗ |
| D1 | TYR04 | EU095240 | Tiryó | ∗∗ |
| D1 | TYR16 | EU095241 | Tiryó | ∗∗ |
| X2a | CHIP20 | EU095242 | W. Chippewa/NE | ∗∗ |
| X2a | CHIP44 | EU095243 | W. Chippewa/NE | ∗∗ |
| X2a | CHIP76 | EU095244 | W. Chippewa/NE | ∗∗ |
| X2a | CHIP85 | EU095245 | W. Chippewa/NE | ∗∗ |
| X2a | SAM2 | EU095246 | Chippewa/NE | ∗∗ |
| X2a | SW097 | EU095247 | Chippewa/NE | ∗∗ |
| X2a | JEM22 | EU095248 | Jemez/SE | ∗∗ |
| X2a | JEM435 | EU095249 | Jemez/SE | ∗∗ |
| X2a | JEM990 | EU095250 | Jemez/SE | ∗∗ |
| X2a | SIOU59 | EU095251 | Siouan/SE | ∗∗ |
| A2 | Na5A | AY195786 | Native American∗ | 39 |
| A2 | N/A | AF346971 | Chukchi | 22 |
| A2 | haplotype A | AF382010 | Canary | 42 |
| A2 | AM17 | DQ112832 | Auca | 47 |
| B2 | Na1B | AY195749 | Native American∗ | 39 |
| B2 | N/A | AF347001 | Pima | 22 |
| B2 | AM12 | DQ112889 | Mayan | 47 |
| B2 | AM15 | DQ112790 | Colombian Indian∗ | 47 |
| B2 | AM16 | DQ112791 | Colombian Indian∗ | 47 |
| C1 | Na4C | AY195759 | Native American∗ | 39 |
| C1 | haplotype C | AF382009 | Canary | 42 |
| C1 | N/A | AF347012 | Warao | 22 |
| C1 | N/A | AF347013 | Warao | 22 |
| C | AM03 | DQ112789 | Colombian Indian∗ | 47 |
| C | AM04 | DQ112888 | Mayan | 47 |
| C | AM06 | DQ112846 | Navajo | 47 |
| D1 | Na2D | AY195748 | Native American∗ | 39 |
| D1 | N/A | AF346984 | Guarani | 22 |
| D1 | AM01 | DQ112772 | Brazilian Indian∗ | 47 |
| D1 | AM02 | DQ112776 | Brazilian Indian∗ | 47 |
| D1 | AM07 | DQ112871 | Quechua | 47 |
| D1 | AM08 | DQ112872 | Pima | 47 |
| D1 | AM09 | DQ112773 | Brazilian Indian∗ | 47 |
| D1 | AM10 | DQ112774 | Brazilian Indian∗ | 47 |
| D1 | AM11 | DQ112775 | Brazilian Indian∗ | 47 |
| D1 | AM14 | DQ112843 | Guarani | 47 |
| X2a | NA22 | N/A | Ojibwa | 7 |
| X2a | Na3X | AY195787 | Navajo | 39 |
Hg denotes haplogroup, and ID indicates label in Figure 1. Individuals were assigned to Hg C when no data for their control region were available.
∗No further information available.
∗∗This work.
PCR, Sequencing, and Contig Assembling
Given the low quantity of some of our DNA samples, we performed a genomic preamplification protocol by using the GenomiPhi kit (GE Healthcare) on these. The PCR amplifications, using primers covering the entire mitochondrial genome, were performed as described elsewhere.30 Sequencing reactions covering the entire mitochondrial genome for both strands30 were read in a MegaBACE 1000 (GE Healthcare) with the ET Terminators cycle sequencing kit. Chromatograms were assembled in individual genomes with the Phred-Phrap-Consed package.31,32 After an initial visual inspection for low-quality regions in the assembly, we aligned the contigs generated for every individual to each other and to the corrected Cambridge reference sequence (rCRS)33,34 and checked all variable positions in the original chromatograms. Possible phantom mutations were again verified in the chromatograms and, whenever needed, resequenced from a new PCR product.35 Although some mtDNAs have a partial sequence already published,36 the whole genomes were mostly resequenced to ensure maximum quality.
Additional Data
To the 58 genomes obtained here, we added 28 complete mtDNA genomes published throughout the literature (see Table 1). This makes a dataset of 86 complete mtDNA genomes characterized from mainly Native American individuals. We have deliberately restricted our analysis to the populations known as “Amerinds,” leaving aside people from Eskimo-Aleuts and Na-Dené linguistic groups. We11 and others (reviewed in 6) have already demonstrated that the latter two were part of the single founding population that gave origin to all Native Americans. However, there is also evidence6 that the Eskimo-Aleuts and Na-Dené diverged from Amerinds > 10 kya and underwent independent population contractions and re-expansions around the circumartic region. Methods such as Bayesian skyline plot, neutrality tests, etc., are only applicable to a group of populations that share the same demographic history. We have therefore not incorporated the haplogroup D2 in our study, because it is only found in Aleutians and in a few other Beringian populations in low frequency.37 Two large-scale databases (ref. 38 and GenBank accession numbers DQ282387–DQ282487DQ282387DQ282388DQ282389DQ282390DQ282391DQ282392DQ282393DQ282394DQ282395DQ282396DQ282397DQ282398DQ282399DQ282400DQ282401DQ282402DQ282403DQ282404DQ282405DQ282406DQ282407DQ282408DQ282409DQ282410DQ282411DQ282412DQ282413DQ282414DQ282415DQ282416DQ282417DQ282418DQ282419DQ282420DQ282421DQ282422DQ282423DQ282424DQ282425DQ282426DQ282427DQ282428DQ282429DQ282430DQ282431DQ282432DQ282433DQ282434DQ282435DQ282436DQ282437DQ282438DQ282439DQ282440DQ282441DQ282442DQ282443DQ282444DQ282445DQ282446DQ282447DQ282448DQ282449DQ282450DQ282451DQ282452DQ282453DQ282454DQ282455DQ282456DQ282457DQ282458DQ282459DQ282460DQ282461DQ282462DQ282463DQ282464DQ282465DQ282466DQ282467DQ282468DQ282469DQ282470DQ282471DQ282472DQ282473DQ282474DQ282475DQ282476DQ282477DQ282478DQ282479DQ282480DQ282481DQ282482DQ282483DQ282484DQ282485DQ282486DQ282487) encompassing Native American mtDNAs have not been used in the main analyses because they consist of data from nonnative individuals. However, to check the robustness of our conclusions, we also performed most of our analyses by adding these nonnative individuals to generate a dataset of 244 mtDNA genomes comprising all available sequences from the five Native American haplogroups. The differences between the results of the native (86 sequences) and those of the 244 sequence datasets are very small in all analyses. Therefore, our results with the 86 dataset are robust and authentically represent present-day mtDNA diversity in “Amerinds.”
Data Analysis
All statistical analyses were done with the slowly evolving mtDNA coding region (positions 577–16022) only. Control-region sequence was used to confirm haplogroup assignment. To check for mutations separating Native American and Old World haplogroups, we compared our sequences with sequences belonging to Asian (haplogroups A–D) and European (haplogroup X) individuals available in the literature.16,22,39–47 Basic diversity statistics, neutrality tests, and mismatch distributions were calculated with Arlequin 3.11.48
Maximum-likelihood phylogenetic trees were constructed with PAUP∗ 4.049 under the HKY+G evolutionary model, assuming an alpha parameter of 0.12.23 The assumption of a molecular clock was tested with the PAML package50 under the HKY+G model, assuming an alpha parameter of 0.12. For the Amerind dataset (n = 86), the null hypothesis of a molecular clock cannot be rejected (p = 0.13). Median-joining networks51 were constructed with the program Network 4.1.0.2, and the time to most recent common ancestor (TMRCA) for each haplogroup was then calculated on the basis of ρ with a rate of 1.26 × 10⁻⁸ substitutions per site per year39 for the mtDNA coding region.
The TMRCAs for each Native American mtDNA haplogroup with an external calibration point were estimated with the software r8s 1.752 as follows. A maximum-likelihood tree estimated in PAUP∗ as described above with 100 bootstrap replications was optimized with the Langley-Fitch model and the Powell algorithm with the optimal smoothing value (S = 1) obtained by a cross-validation procedure. We calibrated our estimates by assuming that the Pan and Homo lineages had separated from each other completely by 6 million yr ago and added 500 ky for lineage sorting.23,39 This procedure avoids the assumption of a substitution rate known a priori. This tree was constructed with sequences available in GenBank from Pan (D38113, D38116, X93335) and an assorted set of 40 mtDNA sequences belonging to other haplogroups, also including Asians from haplogroups A–D, that were used to break long branches to improve phylogenetic reconstruction.
To investigate whether our inferences were robust when the assumption of a strict molecular clock was relaxed, we used the Bayesian approach for the estimation of the coalescence times53 implemented in BEAST v1.4, which applies Markov Chain Monte Carlo integration for parameter estimation over the space of all equally likely trees. Population size dynamics through time (i.e., a Bayesian Skyline plot)53 were also estimated with this approach in BEAST. It is important to emphasize that in this method all genomes were analyzed simultaneously without the assumption of any phylogenetic structure a priori, such as the existence of haplogroups or the number of founding haplotypes. Estimations were carried out assuming HKY+G model with the same rate used for ρ time estimations but with log-normal relaxation allowed. The analysis was run for 60 million iterations, with the first 10% discarded as burn-in. Genealogies and model parameters were sampled every 1,000 iterations thereafter.
Results
As expected, all mitochondrial genomes obtained here grouped in the five known haplogroups, as shown in the schematic trees in Figure 1. The diversity patterns within each Native American haplogroup, including haplogroup X, are remarkably alike. All haplogroups exhibit similar nucleotide diversity values, as well as a marked excess of low-frequency variants that is characteristic of a strong and recent population expansion as shown by significant negative values for Tajima's D and Fu's Fs statistics (Table 2), and single waves in the mismatch distribution graphics (Figure 2). Using the standard substitution rate of 1.26 × 10⁻⁸ per site per year for the mtDNA coding region,39 all haplogroups show coalescence times around 20 kya, with both a strict (ρ) and a relaxed molecular clock method (Bayesian, Table 2), together with a close correspondence in the distribution of coalescence times for each haplogroup (Figure 3). Additionally, similar values are found when we compute a maximum likelihood tree with an external calibration point (i.e., without assuming a predetermined substitution rate, Figure 4A). For each haplogroup, all Native American sequences trace back to a single founder haplotype that can be distinguished from Old World haplogroups by the presence of exclusive mutations (Figure 1) or, in the case of haplogroup C, by specific control region sequence motifs, corroborating the results from Bandelt et al.7 We observed 2, 5, 0, 1, and 3 coding-region mutations which are markers for the five Native American haplogroups A–D, and X, respectively. The accumulation of these Native American specific mutations possibly reflect the duration of the transition period after the ancestral population divergence from Asians but before the within-haplogroups diversification.7,11,21,54 Because the standard rate for these mutations is equivalent to one substitution per 5138 years,39 it suggests that this transition period took several thousand years, likely > 5 ky. All the above results strongly suggest a scenario in which all five haplogroups were part of a single founding population that ultimately led to the peopling of the whole American continent.
Figure 1.
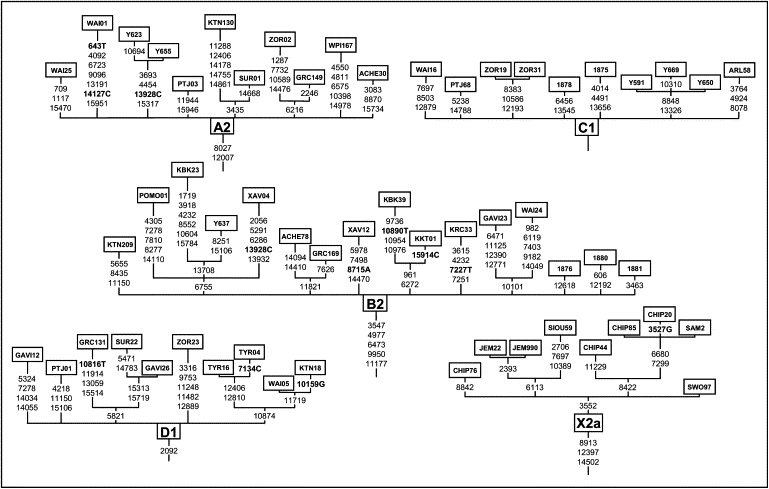
Schematic Tree from the Five Native American mtDNA Haplogroups with Sequences Obtained Here and Indicating the Coding-Region Substitutions
Letters following positions indicate transversions, and the others are transitions. Transition 3552 in the X2a haplogroup was absent in the individual Na3X from,33 so it is not considered to be a marker for this haplogroup.
Table 2.
Summary Statistics and Coalescence Times for the Five Native American Haplogroups
| Haplogroup | n | S | π (SD) % | Tajima's D | Fu's Fs | ρ (95% CI)a | Bayesian (95% CI) |
|---|---|---|---|---|---|---|---|
| A2 | 16 | 58 | 0.0512 (0.0282) | −2.333∗∗ | −9.897∗∗ | 20,552 (14,953–26,151) | 21,290 (16,550–28,130) |
| B2 | 21 | 72 | 0.0504 (0.0273) | −2.468∗∗ | −15.997∗∗ | 20,307 (15,246–25,369) | 22,140 (17,570–28,730) |
| C | 17 | 44 | 0.0417 (0.0233) | −2.097∗∗ | −7.200∗∗ | 17,227 (11,461–22,994) | 20,680 (16,830–26,260) |
| D1 | 20 | 44 | 0.0484 (0.0263) | −1.594∗∗ | −7.280∗∗ | 21,580 (13,263–29,896) | 21,430 (16,850–28,730) |
| X2a | 12 | 20 | 0.0304 (0.0180) | −1.277∗ | −2.410∗ | 17,983 (6,056–29,910) | 20,730 (16,100–29,000) |
| Average | 19,530 | 21,254 |
Summary statistics and coalescence times were based on median-joining calculation (ρ) and on Bayesian estimation. n indicates number of sequences, S indicates number of segregating sites, π indicates nucleotide diversity, and CI indicates confidence interval.
Estimated as ρ ± 2 × standard deviation (SD); ∗p < 0.10; ∗∗p < 0.05.
Figure 2.
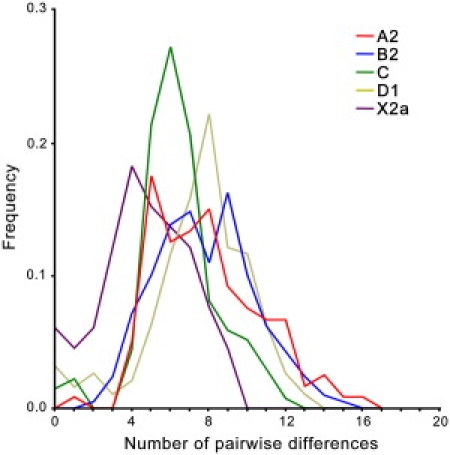
Mismatch Distributions from Native American Haplogroups
The frequency of the number of differences between all pairs of mtDNA genomes compared within each haplogroup.
Figure 3.
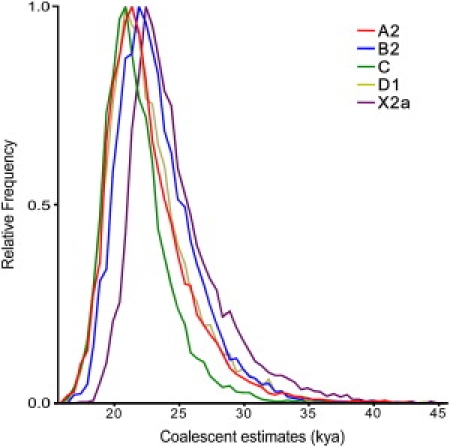
Bayesian Estimation of TMRCA Density from Native American Haplogroups
Relative density of age estimated by BEAST53 in kya for each haplogroup.
Figure 4.
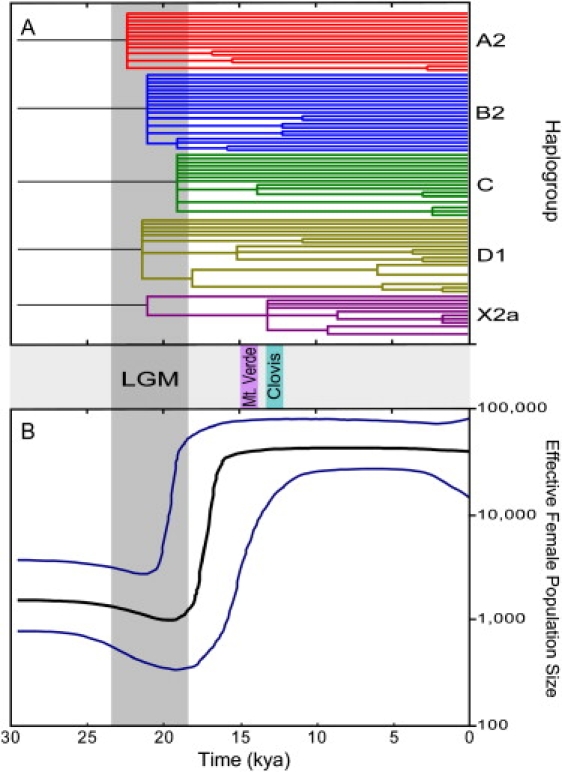
Phylogenetic Tree and Bayesian Skyline Plot for Native American mtDNAs
(A) Maximum-likelihood tree from 80 Native American mtDNA coding-region haplotypes. The time axis (in kya) was estimated with a parametric molecular-clock model calibrated with the assumption of human versus chimpanzee divergence at 6.5 million yr ago. Branches with bootstrap support < 0.5 were collapsed.
(B) mtDNA Bayesian skyline plot showing the Native American population size trend with a log-normal relaxed clock with the standard substitution rate of 1.26 × 10⁻⁸ sites/yr and a generation time of 25 yr. The y axis is the effective number of females. The thick solid line is the median estimate and the thin lines (blue) show the 95% highest posterior density limits estimated with 60 million chains. Approximate dates for the LGM, Monte Verde, and Clovis sites are shown in the middle panel. The time axis is limited to < 30 kya.
To get a more realistic picture of the complex demographic history associated with the colonization of the New World we applied the Bayesian skyline plot approach53 to the whole Native American mtDNA genome sample, noting that this estimate is unaffected by the different proposals for the actual number of founder lineages among present day Native American mtDNAs.6 The skyline plot (Figure 4B) identifies a moderate effective population size reduction between ∼23–19 kya reaching a minimum of ∼1000 women followed by a strong (∼100-fold) and rapid size expansion beginning ∼19–18 kya and ending ∼16–15 kya. It is noteworthy that the time of the population reduction correlates very well with the LGM (23–18 kya) while the expansion dates are in excellent agreement with the end of the LGM, dated around 19–17 kya.55,56 The Bayesian skyline plot of each haplogroup separately showed a similar pattern of population expansion (data not shown).
Discussion
Overall, the Native American mtDNA genomic data suggests the following scenario for the peopling of the Americas. The transition period between the separation of the Native American mtDNA haplogroups from their Asian ancestors and the start of their diversification and expansion into the Americas was estimated at > 5000 years. Adding this time to our estimates for the expansion indicates that the beginning of the divergence of the Native American founder population from its Asian ancestral population probably predates the LGM. There is evidence of human settlements in the artic around 30 kya.57 Therefore, it is possible that the precursors of Native American populations represent a human group that pioneered colonization of northeast Asia before the LGM, during a period of amelioration in the climatic conditions.58 Although it was not possible to determine where in northeast Asia this population stayed during this long period of isolation, Beringia represents the best candidate for that location, at least for the moderate bottleneck period (∼20 kya) before the expansion. Toward the end of the Pleistocene, Beringia was mostly exposed, and even though archaeological evidence for human presence in Beringia around the LGM is controversial, the first evidence of human settlements around this area predates the LGM.57 There is also strong evidence that the Beringian environment could sustain human populations during at least part of the LGM, being considered both climatically and ecologically a glacial refugium.59 mtDNA results further suggest that during the LGM the Native American founding population experienced a reduction in size (with a minimum of around 1000 women) that lasted for 3000–4000 yr and may have been linked to the deteriorating conditions of Beringia at the LGM.60 In addition, the Beringian refugium was ecologically isolated to the west and physically isolated to the east by the glaciers that seem to have effectively blocked the way to America until near the end of the LGM; this may help to explain why the population stayed in Beringia for such a long time before expanding south.
We estimate that beginning ∼19–18 kya and ending ∼16–15 kya (i.e., toward the end of the LGM), the Native American founding population experienced a significant demographic growth process that is most likely associated with an extensive range expansion and may mark the beginning of the effective colonization of the New World south of Beringia. Given that the opening of the ice-free corridor is dated not earlier than ∼14 kya, our results strongly support an alternative route for this expansion, most likely along the western coast of North America.61,62 Recent data have shown that this coastal route was largely ice free by ∼19 kya and that the environment improved rapidly, being capable of supporting bears as of ∼15 kya.63 Interestingly, the end of the intense expansion period coincides with the age of the southern South American Monte Verde site, ∼14.5 kya.3 The strong and rapid population growth suggested by our data is consistent with a model in which humans have traveled the > 13,000 km along the coast from Alaska to the southern tip of Chile in a few thousand years.64 All of the above age estimates were calculated with the standard mtDNA coding-region substitution rate that was presented by Mishmar et al.39 and was used in the great majority of the recent mtDNA studies. A new rate using exclusively synonymous substitutions was recently suggested.47 We have applied this approach to our dataset, and the only changes in the results are the time estimates, which were in general ∼5 ky more recent that those presented here. Because there are some questions concerning this rate and its application (e.g.,65), and because it has been used in just a few studies to date, for the sake of comparison we presented here only the age estimated with the rate of Mishmar et al.39
This model could help explain why some of the earliest known sites are in coastal South America whereas more recent sites are more frequently situated inland. Associated with the end of the ice age, sea level rose rapidly between ∼18 and ∼10 kya, inundating most of North America's Pacific coast, which was exposed during the earliest expansion southward.5 Some of the earliest sites might occur along the much larger South American western coastal plain because large portions of its prehistoric coastline are still exposed.66 The human dispersal from the coast into the interior of the continent, perhaps driven by growing population density, depletion of coastal resources, and rising sea levels,4 was probably delayed by the need to cross the mountain ranges and change living strategies and technologies from those associated with coastal adaptations. Interestingly, a similar model was proposed for the first colonization of Asia, ∼65 kya.23
The moderate population reduction found here was also supported by recent results from biparental loci26,27,29 and by some earlier results from both mtDNA9 and nuclear data25 but contradicts more extreme bottleneck hypotheses such as that suggested by Hey.24 In addition, Hey estimated the time for the peopling of the Americas at only ∼7 kya, about half of the age for the Monte Verde site. Even though the estimates of Hey for the timing of the New World colonization are broad enough to include in the confidence interval dates as old as 15 and 30 kyr, the point estimates are in clear contrast to our data. Such differences may be explained by the different demographic models assumed by these studies, by dataset composition, and by differences in values from key parameters (e.g., generation time, date for human versus chimp divergence, uncorrected distances for mutation-rate estimates).
Our results strongly support the hypothesis that haplogroup X, together with the other four main mtDNA haplogroups, was part of the gene pool of a single Native American founding population; therefore they do not support models that propose haplogroup-independent migrations, such as the migration from Europe posed by the Solutrean hypothesis.18 We infer that haplogroup X experienced a more limited expansion in intensity than the former four haplogroups, and this is compatible with its current very limited distribution.14 Outside America, haplogroup X has always been found in small frequencies. In Europe, it usually makes up less than 5% of mtDNA diversity.16 In Siberia, it has been described in only a few populations,16,46,67 none of which currently inhabit eastern Siberia. It is likely that this haplogroup is absent in eastern Siberian populations because of drift effects, which impact rare variants more strongly. Thus, its probability of being lost through random effects would be high. In support for this hypothesis, we note that current Siberian and Native American sequences belonging to the haplogroup X are distantly related,67 suggesting that the intermediate lineages have been lost. Finally, it is noteworthy that haplogroup X is not the only one of the Native American haplogroups that is more frequent in the New World than in Siberia; haplogroups A and B also show this pattern.46
In the Americas, a likely explanation for the observation that haplogroup X has a much more restricted distribution would be that if we assume it was relatively rare in the founding population, then it could have been lost by successive founder effects and genetic drift as the expansion wave moved southward. Actually, it was recently shown68 that the probability that an allele (e.g., a founding haplotype) survives and expands spatially and in frequency by “surfing” on the wave of a range expansion depends on its presence in the wave of expansion, which in turn depends largely on its proximity to the edge of the wave. Therefore, using this framework, one could conceive that haplogroup X may have “failed” to expand simply as a result of its location in the expansion wave and/or its low initial frequency. A similar explanation may be used to account for the existence of other similarly rare haplogroups in the Americas, such as the “cayapa” subhaplogroup D,69 as well as the distribution of some rare Y chromosome haplogroups,70 without the need to postulate independent colonization events. In addition, the existence of additional, rare founding haplotypes agrees well with the moderate bottleneck estimated here. Such strong and old demographic expansion inferred from our data might also indicate that this was the most important time frame in which major changes in haplogroup composition could occur. Interestingly, two studies with ancient DNA samples scattered over most of the Holocene suggested regional continuity in the frequency of mtDNA haplogroups,71,72 indicating that in these populations drift has not played a major role in more recent times.
The fact that the five most common Native American mtDNA haplogroups display similar diversity patterns strongly indicates that they have not been much affected by natural selection. Because human mtDNA does not recombine, directional selection upon a specific substitution would favor the haplotype in which this variant occurs, mimicking a demographic expansion. It is very unlikely that in all haplogroups specific variants that would be favored by natural selection with similar intensity would have occurred by chance and at a similar time. Therefore, our results strongly indicate that the diversity pattern in Native American mtDNA results from a demographic expansion in the founding population in which all founding haplotypes were present.
Our detailed demographical model for the earlier settlement of the Americas has implications for explaining some of the high level of disagreement that has been found among studies from different disciplines, especially in relation to an “exact” date for the peopling of the New World. Our results indicate that, strictly speaking, we will probably never be able to pinpoint a single and precise date for the entering of the Americas, because it occurred when Asia and America were not divided but were connected by the huge land mass of the subcontinent Beringia, and because it lasted several millennia, beginning with the isolation from the Asian ancestors and ending with the population size and range expansion into the continent. Under our model, three periods that may define a date for the peopling of the Americas can be delineated: (1) the colonization of Beringia (because about half of it was “America” at that time) by the founding population; (2) the movement out of Beringia—characterized by the fast colonization of the continental Pacific coastal plain—south of the ice sheets; and (3) the more recent and more extensive colonization of inland continental masses. Furthermore, the probability of coalescence of mtDNA lineages within a population and the chance of finding ancient archeological evidence go in opposite directions. Consider, for example, period 1 in Beringia: The many millennia of isolation followed by reduced population size accelerated the coalescence of mtDNA lineages into the haplogroups founding haplotypes (consequently determining their ages), but these conditions, aggravated by the fact that most of Beringia is now underwater, make it more difficult to find good archaeological evidence of this period. On the contrary, period 3 should present a much higher probability of finding archaeological sites, but it was very difficult to distinguish from the previous period by the conventional methods of historical demography. Therefore, perhaps some of the heated debates about dissimilar “colonization dates” inferred by different disciplines may actually reflect the estimation of distinct periods as described above. More specifically, the generally more recent colonization dates estimated from extensive archaeological sites from inland North America (e.g.,2) may reflect the third, latest event, whereas the usually more ancient coalescence dates from mtDNA haplogroups6 actually reflect the earliest isolation of the founding population in Beringia. Finally, the intermediate genetic dates usually estimated from population expansion times as well as the fact the most ancient archeological sites have been found in the coast may reflect the early and fast settlement along the coast of the continent. Our results emphasize the necessity that the increasing amount of population genetic data should be analyzed with methods that provide more realistic pictures for similarly complex evolutionary histories.
While our manuscript was under review, another study on mtDNA genomic diversity of Native American haplogroups has been published by Tamm et al.73 Their paper also suggests that the major Native American mtDNA haplogroups were part of a single demographic event, dating back to ∼15 kya, after a period of isolation in Beringia, supporting our previous model.11 Our study differs from the one of Tamm et al. in several issues (e.g., Tamm et al. do not date the age of haplogroup X expansion in the Americas, and they use a synonymous substitution rate47 that furnishes slightly younger dates), but they provide similar conclusions about the colonization process.
Web Resources
Accession numbers and URLs for data presented herein are as follows:
GenBank, http://www.ncbi.nlm.nih.gov/Genbank/
BEAST, http://beast.bio.ed.ac.uk/
Accession Numbers
The 51 sequences reported in this paper have been deposited in GenBank with the accession numbers EU095194–EU095251EU095194EU95195EU95196EU95197EU95198EU95199EU95200EU95201EU95202EU95203EU95204EU95205EU95206EU95207EU95208EU95209EU95210EU95211EU95212EU95213EU95214EU95215EU95216EU95217EU95218EU95219EU95220EU95221EU95222EU95223EU95224EU95225EU95226EU95227EU95228EU95229EU95230EU95231EU95232EU95233EU95234EU95235EU95236EU95237EU95238EU95239EU95240EU95241EU95242EU95243EU95244EU95245EU95246EU95247EU95248EU95249EU95250EU95251.
Acknowledgments
Grant support was from the Brazilian Conselho Nacional de Desenvolvimento Científico e Tecnológico and the Fundação de Amparo a Pesquisa do Rio Grande do Sul (S.L.B.) and by a CAPES scholarship (N.J.R.F.). We are also grateful to Institutos do Milênio and Programas de Apoio a Núcleos de Excelência for extra support (F.M.S.) and to the National Institutes of Health (D.G.S.). Research was developed with help from CENAPAD-SP supercomputer center. Thanks to Cladinara R. Sarturi, Ronaldo R. Ferreira, Luana Cardoso-Silva, Renata Schmitt, André Schnorr, Gabrielle D. Salton, Mariana Magalhães, and Marina O. Favarini for technical help, and to Kim Hill, A. Magdalena Hurtado, Ramiro Barrantes, and Luis Rodriguez-Delfin for sample donations, as well as to all individuals who, by contributing their own samples, made this study possible. We thank Claudio Bravi for help with checking mutations and Eduardo Eizirik and three anonymous reviewers for their suggestions.
References
- 1.Fagan B.M. University Press of Florida; Gainesville, FL: 2004. The Great Journey: The Peopling of Ancient America. [Google Scholar]
- 2.Waters M.R., Stafford T.W. Redefining the age of Clovis: Implications for the peopling of the Americas. Science. 2007;315:1122–1126. doi: 10.1126/science.1137166. [DOI] [PubMed] [Google Scholar]
- 3.Dillehay T.D. Smithsonian Institute Press; Washington, DC: 1997. The Archaeological Context and Interpretation, Volume 2: Monte Verde, a Late Pleistocene Settlement in Chile. [Google Scholar]
- 4.Dixon E.J. Human colonization of the Americas: Timing, technology and process. Quaternary Science Reviews. 2001;20:277–299. [Google Scholar]
- 5.Clark P.U., Mix A.C. Ice sheets and sea level of the last glacial maximum. Quaternary Science Reviews. 2002;21:1–7. [Google Scholar]
- 6.Schurr T.G. The peopling of the New World: Perspectives from molecular anthropology. Annu. Rev. Anthropol. 2004;33:551–583. [Google Scholar]
- 7.Bandelt H.J., Herrnstadt C., Yao Y.G., Kong Q.P., Kivisild T., Rengo C., Scozzari R., Richards M., Villems R., Macaulay V. Identification of Native American founder mtDNAs through the analysis of complete mtDNA sequences: Some caveats. Ann. Hum. Genet. 2003;67:512–524. doi: 10.1046/j.1469-1809.2003.00049.x. [DOI] [PubMed] [Google Scholar]
- 8.Merriwether D.A., Hall W.W., Vahlne A., Ferrell R.E. MtDNA variation indicates Mongolia may have been the source for the founding population for the New World. Am. J. Hum. Genet. 1996;59:204–212. [PMC free article] [PubMed] [Google Scholar]
- 9.Merriwether D.A., Rothhammer F., Ferrell R.E. Distribution of the four-founding lineage haplotypes in Native Americans suggests a single wave of migration for the New World. Am. J. Phys. Anthropol. 1995;98:411–430. doi: 10.1002/ajpa.1330980404. [DOI] [PubMed] [Google Scholar]
- 10.Forster P., Harding R., Torroni A., Bandelt H.-J. Origin and evolution of Native American mtdna variation: A reappraisal. Am. J. Hum. Genet. 1996;59:935–945. [PMC free article] [PubMed] [Google Scholar]
- 11.Bonatto S.L., Salzano F.M. A single and early migration for the peopling of the Americas supported by mitochondrial DNA sequence data. Proc. Natl. Acad. Sci. USA. 1997;94:1866–1871. doi: 10.1073/pnas.94.5.1866. [DOI] [PMC free article] [PubMed] [Google Scholar]
- 12.Stone A.C., Stoneking M. mtDNA analysis of a prehistoric Oneota population: Implications for the peopling of the New World. Am. J. Hum. Genet. 1998;62:1153–1170. doi: 10.1086/301838. [DOI] [PMC free article] [PubMed] [Google Scholar]
- 13.Starikovskaya Y.B., Sukernik R.I., Schurr T.G., Kogelnik A.M., Wallace D.C. MtDNA diversity in Chukchi and Siberian Eskimos: Implications for the genetic history of ancient Beringia and the peopling of the New World. Am. J. Hum. Genet. 1998;63:1473–1491. doi: 10.1086/302087. [DOI] [PMC free article] [PubMed] [Google Scholar]
- 14.Smith D.G., Malhi R.S., Eshleman J., Lorenz J.G., Kaestle F.A. Distribution of mtDNA haplogroup X among Native North Americans. Am. J. Phys. Anthropol. 1999;110:271–284. doi: 10.1002/(SICI)1096-8644(199911)110:3<271::AID-AJPA2>3.0.CO;2-C. [DOI] [PubMed] [Google Scholar]
- 15.Dornelles C.L., Bonatto S.L., Freitas L.B., Salzano F.M. Is haplogroup X present in extant South American Indians? Am. J. Phys. Anthropol. 2005;127:439–448. doi: 10.1002/ajpa.20103. [DOI] [PubMed] [Google Scholar]
- 16.Reidla M., Kivisild T., Metspalu E., Kaldma K., Tambets K., Tolk H.-V., Parik J., Loogväli E.L., Derenko M., Malyarchuk B. Origin and diffusion of mtDNA haplogroup X. Am. J. Hum. Genet. 2003;73:1178–1190. doi: 10.1086/379380. [DOI] [PMC free article] [PubMed] [Google Scholar]
- 17.Brown M.D., Hosseini S.H., Torroni A., Bandelt H.-J., Allen J.C., Schurr T.G., Scozzari R., Cruciani F., Wallace D.C. MtDNA haplogroup X: An ancient link between Europe/Western Asia and North America? Am. J. Hum. Genet. 1998;63:1852–1861. doi: 10.1086/302155. [DOI] [PMC free article] [PubMed] [Google Scholar]
- 18.Stanford D., Bradley B. Ocean trails and prairie paths? Thoughts about Clovis origins. In: Jablonski N., editor. The Pleistoscene Colonization of the New World. Memoirs of the California Academy of Sciences; San Francisco, CA: 2002. pp. 255–271. [Google Scholar]
- 19.Straus L.G., Meltzer D.J., Goebel T. Ice age Atlantis? Exploring the Solutrean-Clovis ‘connection’. World Archaeol. 2005;37:507–532. [Google Scholar]
- 20.Malhi R.S., Smith D.G. Haplogroup X confirmed in prehistoric North America. Am. J. Phys. Anthropol. 2002;119:84–86. doi: 10.1002/ajpa.10106. [DOI] [PubMed] [Google Scholar]
- 21.Bonatto S.L., Salzano F.M. Diversity and age of the four major mtDNA haplogroups, and their implications for the peopling of the New World. Am. J. Hum. Genet. 1997;61:1413–1423. doi: 10.1086/301629. [DOI] [PMC free article] [PubMed] [Google Scholar]
- 22.Ingman M., Kaessmann H., Pääbo S., Gyllensten U. Mitochondrial genome variation and the origin of modern humans. Nature. 2000;408:708–713. doi: 10.1038/35047064. [DOI] [PubMed] [Google Scholar]
- 23.Macaulay V., Hill C., Achilli A., Rengo C., Clarke D., Meehan W., Blackburn J., Semino O., Scozzari R., Cruciani F. Single, rapid coastal settlement of Asia revealed by analysis of complete mitochondrial genomes. Science. 2005;308:1034–1036. doi: 10.1126/science.1109792. [DOI] [PubMed] [Google Scholar]
- 24.Hey J. On the number of New World founders: A population genetic portrait of the peopling of the Americas. PLoS Biol. 2005;3:e193. doi: 10.1371/journal.pbio.0030193. [DOI] [PMC free article] [PubMed] [Google Scholar]
- 25.Kidd J.R., Black F.L., Weiss K.M., Balazs I., Kidd K.K. Studies of three Amerindian populations using nuclear DNA polymorphisms. Hum. Biol. 1991;63:775–794. [PubMed] [Google Scholar]
- 26.Heller A.H., Salzano F.M., Barrantes R., Krylov M., Benevolenskaya L., Arnett F.C., Munkhbat B., Munkhtuvshin N., Tsuji K., Hutz M.H. Intra and intercontinental molecular variability of an Alu insertion in the 3′UTR of the LDLR gene. Hum. Biol. 2004;76:591–604. doi: 10.1353/hub.2004.0056. [DOI] [PubMed] [Google Scholar]
- 27.Battilana J., Cardoso-Silva L., Barrentes R., Hill K., Hurtado A.M., Salzano F.M., Bonatto S.L. Molecular variability of the 16p13.3 region in Amerindians and its anthropological significance. Ann. Hum. Genet. 2007;71:64–76. doi: 10.1111/j.1469-1809.2006.00296.x. [DOI] [PubMed] [Google Scholar]
- 28.Battilana J., Fagundes N.J.R., Heller A.H., Goldani A., Freitas L.B., Tarazona-Santos E., Munkhbat B., Munkhtuvsin N., Krylov M., Benevolenskaya L. Alu insertion polymorphisms in Native American and related Asian populations. Ann. Hum. Biol. 2006;33:142–160. doi: 10.1080/03014460500487347. [DOI] [PubMed] [Google Scholar]
- 29.Fagundes N.J.R., Ray N., Beaumont M., Neuenschwander S., Salzano F.M., Bonatto S.L., Excoffier L.E. Statistical evaluation of alternative models of human evolution. Proc. Natl. Acad. Sci. USA. 2007;104:17614–17619. doi: 10.1073/pnas.0708280104. [DOI] [PMC free article] [PubMed] [Google Scholar]
- 30.Rieder M.J., Tayler S.L., Tobe V.O., Nickerson D.A. Automating the identification of DNA variations using quality-based fluorescence re-sequensing: Analysis of the human mitochondrial genome. Nucleic Acids Res. 1998;26:967–973. doi: 10.1093/nar/26.4.967. [DOI] [PMC free article] [PubMed] [Google Scholar]
- 31.Ewing B., Hillier L., Wendl M.C., Green P. Base-calling of automated sequencer traces using phred. I. Accuracy assessment. Genome Res. 1998;8:175–185. doi: 10.1101/gr.8.3.175. [DOI] [PubMed] [Google Scholar]
- 32.Gordon D., Abajian C., Green P. Consed: a graphical tool for sequence finishing. Genome Res. 1998;8:195–202. doi: 10.1101/gr.8.3.195. [DOI] [PubMed] [Google Scholar]
- 33.Anderson S., Bankier A.T., Barrell B.G., de Bruijn M.H., Coulson A.R., Drouin J., Eperon I.C., Nierlich D.P., Roe B.A., Sanger F. Sequence and organization of the human mitochondrial genome. Nature. 1981;290:457–465. doi: 10.1038/290457a0. [DOI] [PubMed] [Google Scholar]
- 34.Andrews R.M., Kubacka I., Chinnery P.F., Lightowlers R.N., Turnbull D.M., Howell N. Reanalysis and revision of the Cambridge reference sequence for human mitochondrial DNA. Nat. Genet. 1999;23:147. doi: 10.1038/13779. [DOI] [PubMed] [Google Scholar]
- 35.Bandelt H.J., Quintana-Murci L., Salas A., Macaulay V. The fingerprint of phantom mutations in mitochondrial DNA data. Am. J. Hum. Genet. 2002;71:1150–1160. doi: 10.1086/344397. [DOI] [PMC free article] [PubMed] [Google Scholar]
- 36.Silva W.A., Bonatto S.L., Holanda A.J., Ribeiro-dos-Santos A.K., Paixão B.M., Goldman G.H., Abe-Sandes K., Rodriguez-Delfin L., Barbosa M., Paço-Larson M.L. Mitochondrial genome diversity of Native Americans supports a single early entry of founder populations into America. Am. J. Hum. Genet. 2002;71:187–192. doi: 10.1086/341358. [DOI] [PMC free article] [PubMed] [Google Scholar]
- 37.Derbeneva O.A., Sukernik R.I., Volodko N.V., Hosseini S.H., Lott M.T., Wallace D.C. Analysis of mitochondrial DNA diversity in the Aleuts of the Commander Islands and its implications for the genetic history of Beringia. Am. J. Hum. Genet. 2002;71:415–421. doi: 10.1086/341720. [DOI] [PMC free article] [PubMed] [Google Scholar]
- 38.Herrnstadt C., Elson J.L., Fahy E., Preston G., Turnbull D.M., Anderson C., Ghosh S.S., Olefsky J.M., Beal M.F., Davis R.E. Reduced-median-network analysis of complete mitochondrial DNA coding-region sequences for the major African, Asian, and European haplogroups. Am. J. Hum. Genet. 2002;70:1152–1171. doi: 10.1086/339933. [DOI] [PMC free article] [PubMed] [Google Scholar]
- 39.Mishmar D., Ruiz-Pesini E., Golik P., Macaulay V., Clark A.G., Hosseini S., Brandon M., Easley K., Chen E., Brown M.D. Natural selection shaped regional mtDNA variation in humans. Proc. Natl. Acad. Sci. USA. 2003;100:171–176. doi: 10.1073/pnas.0136972100. [DOI] [PMC free article] [PubMed] [Google Scholar]
- 40.Levin B.C., Cheng H., Reeder D.J. A human mitochondrial DNA standard reference material for quality control in forensic identification, medical diagnosis, and mutation detection. Genomics. 1999;55:135–146. doi: 10.1006/geno.1998.5513. [DOI] [PubMed] [Google Scholar]
- 41.Finnilä S., Lehtonen M.S., Majamaa K. Phylogenetic network for European mtDNA. Am. J. Hum. Genet. 2001;68:1475–1484. doi: 10.1086/320591. [DOI] [PMC free article] [PubMed] [Google Scholar]
- 42.Maca-Meyer N., González A.M., Larruga J.M., Flores C., Cabrera V.C. Major genomic mitochondrial lineages delineate early human expansions. BMC Genet. 2001;2:13. doi: 10.1186/1471-2156-2-13. [DOI] [PMC free article] [PubMed] [Google Scholar]
- 43.Ingman M., Gyllensten U. Mitochondrial genome variation and evolutionary history of Australian and New Guinean aborigines. Genome Res. 2003;13:1600–1606. doi: 10.1101/gr.686603. [DOI] [PMC free article] [PubMed] [Google Scholar]
- 44.Kong Q.-P., Yao Y.-G., Sun C., Bandelt H.-J., Zhu C.-L., Zhang Y.-P. Phylogeny of East Asian mitochondrial DNA lineages inferred from complete sequences. Am. J. Hum. Genet. 2003;73:671–676. doi: 10.1086/377718. [DOI] [PMC free article] [PubMed] [Google Scholar]
- 45.Tanaka M., Cabrera V.M., Gonzalez A.M., Larruga J.M., Takeyasu T., Fuku N., Guo L.J., Hirose Y., Fujita Y., Kurata K. Mitochondrial genome variation in eastern Asia and the peopling of Japan. Genome Res. 2004;14:1832–1850. doi: 10.1101/gr.2286304. [DOI] [PMC free article] [PubMed] [Google Scholar]
- 46.Starikovskaya E.B., Sukernik R.I., Derbeneva O.A., Volodko N.V., Ruiz-Pesini E., Torroni A., Brown M.D., Lott M.T., Hosseini S.H., Huoponen K. Mitochondrial DNA diversity in indigenous populations of the southern extent of Siberia, and the origins of Native American haplogroups. Ann. Hum. Genet. 2005;69:67–89. doi: 10.1046/j.1529-8817.2003.00127.x. [DOI] [PMC free article] [PubMed] [Google Scholar]
- 47.Kivisild T., Shen P., Wall D., Do B., Sung R., Davis K., Passarino G., Underhill P.A., Scharfe C., Torroni A. The role of selection in the evolution of human mitochondrial genomes. Genetics. 2006;172:373–387. doi: 10.1534/genetics.105.043901. [DOI] [PMC free article] [PubMed] [Google Scholar]
- 48.Excoffier L., Laval G., Schneider S. Arlequin (version 3.0): An integrated software package for population genetics data analysis. Evol. Bioinform. Online. 2005;1:47–50. [PMC free article] [PubMed] [Google Scholar]
- 49.Swofford D.L. Sinauer; Sunderland, MA: 2003. PAUP∗. Phylogenetic Analysis Using Parsimony (∗and other methods) [Google Scholar]
- 50.Yang Z. PAML: A program package for phylogenetic analysis by maximum likelihood. Comput. Appl. Biosci. 1997;13:555–556. doi: 10.1093/bioinformatics/13.5.555. [DOI] [PubMed] [Google Scholar]
- 51.Bandelt H.J., Forster P., Röhl A. Median-joining networks for inferring intraspecific phylogenies. Mol. Biol. Evol. 1999;16:37–48. doi: 10.1093/oxfordjournals.molbev.a026036. [DOI] [PubMed] [Google Scholar]
- 52.Sanderson M.J. R8s: inferring absolute rates of molecular evolution and divergence times in the absence of a molecular clock. Bioinformatics. 2003;19:301–302. doi: 10.1093/bioinformatics/19.2.301. [DOI] [PubMed] [Google Scholar]
- 53.Drummond A.J., Rambaut A., Shapiro B., Pybus O.G. Bayesian coalescent inference of past population dynamics from molecular sequences. Mol. Biol. Evol. 2005;22:1185–1192. doi: 10.1093/molbev/msi103. [DOI] [PubMed] [Google Scholar]
- 54.Szathmary E.J. mtDNA and the peopling of the Americas. Am. J. Hum. Genet. 1993;53:793–799. [PMC free article] [PubMed] [Google Scholar]
- 55.Yokoyama Y., Lambeck K., Deckker P.D., Johnston P., Fifield L.K. Timing of the last glacial maximum from observed sea-level minima. Nature. 2000;406:713–716. doi: 10.1038/35021035. [DOI] [PubMed] [Google Scholar]
- 56.Schaefer J.M., Denton G.H., Barrell D.J.A., Ivy-Ochs S., Kubik P.W., Andersin B.G., Phhillips F.M., Lowell T.V., Schluchter C. Near-synchronous interhemispheric termination of the last glacial maximum in mid-latitudes. Science. 2006;312:1510–1513. doi: 10.1126/science.1122872. [DOI] [PubMed] [Google Scholar]
- 57.Pitulko V.V., Nikolsky P.A., Girya E.Y., Basilyan A.E., Tumskoy V.E., Koulakov S.A., Astakhov S.N., Pavlova E.Yu., Anisimov M.A. The Yana RHS site: Humans in the Arctic before the last glacial maximum. Science. 2004;303:52–56. doi: 10.1126/science.1085219. [DOI] [PubMed] [Google Scholar]
- 58.Vasil'ev S.A. The Siberian mosaic: Upper Palaeolithic adaptations and change before the Last glacial Maximum. In: Roebroecks W., Mussi M., Svoboda J., Fennema K., editors. Hunters of the Golden Age. University of Leiden; Leiden, Netherlands: 2000. pp. 173–195. [Google Scholar]
- 59.Brubaker L.B., Anderson P.M., Edwards M.E., Lozhkin A.V. Beringia as a glacial refugium for boreal trees and shrubs: New perspectives from mapped pollen data. J. Biogeogr. 2005;32:833–848. [Google Scholar]
- 60.Elias S.A. Beringian paleoecology: Results from the 1997 workshop. Quaternary Science Reviews. 2001;20:7–13. [Google Scholar]
- 61.Fladmark K.R. Routes: Alternate migration corridors for early man in North America. Am. Antiq. 1979;44:55–69. [Google Scholar]
- 62.Dixon E.J. University of New Mexico Press; Albuquerque, NM: 1993. Quest for the Origins of the First Americans. [Google Scholar]
- 63.Kelly R.L. Maybe we do know when people first came to North America; and what does it mean if we do? Quaternary Int. 2003;109–110:133–145. [Google Scholar]
- 64.Surovell T.A. Simulating coastal migration in New World colonization. Curr. Anthropol. 2003;44:580–591. [Google Scholar]
- 65.Bandelt H.J., Kong Q.P., Richards M., Macaulay V. Estimation of mutation rates and coalescence times: Some caveats. In: Bandelt H.J., Macaulay V., Richards M., editors. Human Mitochondrial DNA and the Evolution of Homo Sapiens. Springer; Berlin: 2006. pp. 47–90. [Google Scholar]
- 66.Dillehay T.D. The late Pleistocene cultures of South America. Evol. Anthropol. 1999;7:206–216. [Google Scholar]
- 67.Derenko M.V., Grzybowski T., Malyarchuk B.A., Czarny J., Miscicka-Sliwka D., Zakharov I.A. The presence of mitochondrial haplogroups X in Altaians from South Siberia. Am. J. Hum. Genet. 2001;69:237–241. doi: 10.1086/321266. [DOI] [PMC free article] [PubMed] [Google Scholar]
- 68.Klopfstein S., Currat M., Excoffier L. The fate of mutations surfing on the wave of a range expansion. Mol. Biol. Evol. 2006;23:482–490. doi: 10.1093/molbev/msj057. [DOI] [PubMed] [Google Scholar]
- 69.Kemp B.M., Mahli R.S., McDonough J., Bolnick D.A., Eshleman J.A., Rickards O., Martinez-Labarga C., Johnson J.R., Lorenz J.G., Dixon E.J. Genetic analysis of early Holocene skeletal remains from Alaska and its implications for the settlement of the Americas. Am. J. Phys. Anthropol. 2007;132:605–621. doi: 10.1002/ajpa.20543. [DOI] [PubMed] [Google Scholar]
- 70.Tarazona-Santos E., Santos F.R. The peopling of the Americas: A second major migration? Am. J. Hum. Genet. 2002;70:1377–1380. doi: 10.1086/340388. [DOI] [PMC free article] [PubMed] [Google Scholar]
- 71.O'Rourke D.H., Hayes M.G., Carlyle S.W. Spatial and temporal stability of mtDNA haplogroup frequencies in native North Americans. Hum. Biol. 2000;72:15–34. [PubMed] [Google Scholar]
- 72.Kaestle F.A., Smith D.G. Ancient mitochondrial DNA evidence for prehistoric population movement: The Numic expansion. Am. J. Phys. Anthropol. 2001;115:1–12. doi: 10.1002/ajpa.1051. [DOI] [PubMed] [Google Scholar]
- 73.Tamm E., Kivisild T., Reidla M., Metspalu M., Glenn Smith D., Mulligan C.J., Bravi C.M., Rickards O., Martinez-Labarga C., Khusnutdinova E.K. Beringian standstill and spread of Native American founders. PLoS ONE. 2007;2:e829. doi: 10.1371/journal.pone.0000829. [DOI] [PMC free article] [PubMed] [Google Scholar]