

Abstract
The human carboxylesterase 1 (CES1) gene encodes for the enzyme carboxylesterase 1, a serine esterase governing both metabolic deactivation and activation of numerous therapeutic agents. During the course of a study of the pharmacokinetics of the methyl ester racemic psychostimulant methylphenidate, profoundly elevated methylphenidate plasma concentrations, unprecedented distortions in isomer disposition, and increases in hemodynamic measures were observed in a subject of European descent. These observations led to a focused study of the subject's CES1 gene. DNA sequencing detected two coding region single-nucleotide mutations located in exons 4 and 6. The mutation in exon 4 is located in codon 143 and leads to a nonconservative substitution, p.Gly143Glu. A deletion in exon 6 at codon 260 results in a frameshift mutation, p.Asp260fs, altering residues 260–299 before truncating at a premature stop codon. The minor allele frequency of p.Gly143Glu was determined to be 3.7%, 4.3%, 2.0%, and 0% in white, black, Hispanic, and Asian populations, respectively. Of 925 individual DNA samples examined, none carried the p.Asp260fs, indicating it is an extremely rare mutation. In vitro functional studies demonstrated the catalytic functions of both p.Gly143Glu and p.Asp260fs are substantially impaired, resulting in a complete loss of hydrolytic activity toward methylphenidate. When a more sensitive esterase substrate, p-nitrophenyl acetate was utilized, only 21.4% and 0.6% catalytic efficiency (Vmax/Km) were determined in p.Gly143Glu and p.Asp260fs, respectively, compared to the wild-type enzyme. These findings indicate that specific CES1 gene variants can lead to clinically significant alterations in pharmacokinetics and drug response of carboxylesterase 1 substrates.
Introduction
The carboxylesterase 1 (CES1) gene (MIM 114835) encodes for human carboxylesterase 1 (CES1), the principal enzyme governing the metabolism of the most widely prescribed psychostimulant methylphenidate (MPH), and is involved in the metabolism of numerous other therapeutic medications as well as some illicit drugs such as heroin and cocaine.1,2 Further, it is responsible for the metabolic activation of a number of ester prodrugs.3 Single-nucleotide polymorphisms (SNPs) can significantly influence the metabolism and disposition of many therapeutic agents.
MPH is widely considered the “gold standard” in treating attention-deficit/hyperactivity disorder (ADHD [MIM 143465]), which has an estimated worldwide prevalence of 8%–12%.4,5 Up to 30% of patients receiving psychostimulants such as MPH are either nonresponders or are intolerant to treatment. Additionally, available long-term studies (i.e., >1 year) suggest only 50% of children continue MPH treatment after initiation of therapy.6 Predicting a therapeutic drug response in individual patients is not presently possible with most research finding no neurological, psychological, or physical characteristics that can serve as reliable predictors of response, and dosing these agents remains largely an empiric process.
Striking interindividual differences exist between d- and l-MPH metabolism and disposition and have consistently been demonstrated in enantiospecific investigations. The major pathway mediating the metabolism of MPH is rapid deesterification. The most common formulation of MPH is the racemic mixture of d-threo-(R,R)- and l-threo-(S,S)-MPH with the d-isomer regarded as the active isomer.7,8 The primary metabolic pathway governing the metabolism of both d- and l-MPH is deesterification to the inactive metabolite, ritalinic acid (RA) (Figure S1 available online).9 This process, mediated by CES1, is stereoselective and heavily favors the hydrolysis of the l-isomer.10 Indeed, pharmacokinetic racemic-MPH studies, which have employed enantioselective analytical methods, have consistently demonstrated that the l-isomer accounts for only a small fraction of the total circulating blood concentrations of MPH with the predominant circulating species being the d-MPH isomer.7,11 Furthermore, the plasma half-life (t1/2) of d-MPH is markedly longer than that of l-MPH. The presystemic metabolism and clearance of dl-MPH is an enantioselective process resulting in markedly higher plasma concentrations of d-MPH relative to l-MPH. In an enantiospecific study of MPH administered intravenously, both isomers exhibited similar distribution characteristics, although the terminal elimination phase of the l-isomer was more rapid. In a number of other studies utilizing various oral formulations, the area under the plasma concentration versus time curve (AUCinf) value for the l-isomer has been reported to only reach ∼1%–5% of that of d-MPH.12
Recently, in the course of conducting a randomized three-way crossover study of racemic MPH at a single dose of 0.3 mg/kg aimed at investigating the interaction of MPH and ethanol in normal volunteers (n = 20), we identified a male white subject who displayed a highly unusual concentration-versus-time profile suggestive of a metabolic deficiency in CES1.13 That study included serial blood sampling, enantioselective MPH and metabolite determinations, and repeated hemodynamic measurements in the controlled environment of a clinical research unit. Further details of that study are described elsewhere.13 The present report utilizes data from one of the three phases studied in which research subjects received a single weight-based dose of racemic MPH only.
A pharmacokinetic analysis of the subject's blood concentrations employing enantioselective methodologies revealed striking elevations in every measured pharmacokinetic parameter relative to the other 19 study subjects (Figure S2). For example, the observed maximum plasma concentration (Cmax) for total MPH (i.e., combined d- and l-isomers) was ∼7-fold higher than the mean determined for the remaining subjects. Furthermore, an unprecedented observation was the extraordinarily high concentrations of the l-MPH isomer overall and in particular relative to d-MPH (Cmax = 62 ng/ml) (Figure 1). This concentration was ∼100-fold higher than that determined in study peers and typical literature values.10,13 Finally, the coadministration of MPH with ethanol normally results in the formation of the transesterification metabolite ethylphenidate, also a metabolic process known to be specifically mediated by CES1.14 It was noted that detectable concentrations of ethylphenidate were present in every study subject during the two phases in which MPH and ethanol were combined with exception of this single individual.
Figure 1.
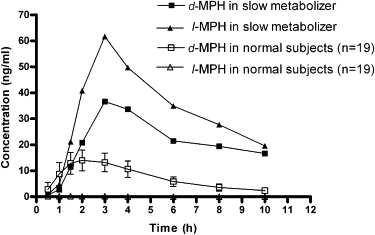
The Plasma Concentrations of d- and l-MPH in the Aberrant Metabolizer versus Study Peers
The plasma concentration versus time curve presenting individual isomer concentrations (d- versus l-MPH) in the aberrant metabolizer compared to the mean values of 19 study peers following a single 0.3 mg/kg dose of racemic MPH.
We hypothesized decreased or absent activity of CES1 as the underlying cause of the peculiar pharmacokinetics observed in this individual. This report describes the discovery of two variants that were present in the CES1 gene of this individual as well as his biological parents. We also report the frequency of these variants in representative racial and ethnic populations. Furthermore, we describe a markedly different hemodynamic response in this subject after MPH administration, suggesting that these mutations may well contribute to clinically significant alterations in drug response and tolerability to MPH. Finally, we conducted in vitro functional studies, which demonstrate that catalytic activity (i.e., ester hydrolysis) toward MPH as well as a model substrate p-nitrophenyl acetate (PNPA) are significantly decreased in these two CES1 mutants.
Material and Methods
Identification of CES1 Genetic Variants
Total genomic DNA was extracted from whole blood for CES1 DNA sequence analysis. DNA sequencing, initial SNP identification, and mutant-sequence verification was performed by SeqWright, Laboratories (Houston, TX, USA). Fifty-two custom primers were used in the bidirectional sequencing of all 14 CES1 exons, including 50–200 bp of flanking intronic region at each exon (GenBank accession numbers: genomic reference, AB119997; cDNA, AB119995). Introns were not investigated further. Sequence at the 5′ end extended ∼12 bp upstream of exon 1 and at the 3′ end ∼13 bp downstream of exon 14. Additional primer sets used for verifying the two described mutations are listed in Table 1.
Table 1.
Primers for Mutants Verification Used by SeqWright Laboratories
| Names | Sequences |
|---|---|
| Exon 4 forward | 5′-TGATGGGAGTGTCCTCCCGAAG-3′ |
| Exon 4 reverse | 5′-GGGTAGGTAGTGTGTCCAATTAC-3′ |
| Exon 6 forward | 5′-AGGAAGACTTCCACCTCCTTG-3′ |
| Exon 6 reverse | 5′-AGGAGTGTGGTCACACAGATAG-3′ |
Sequence delineation and base calling was performed with automated fluorescent DNA sequencers (ABI model 3730xl; Applied Biosystems, Foster City, CA, USA). Cycling conditions were as follows: 30 cycles of 95°C for 30 s, 50°C–60°C (depending on Tm) for 30 s, and 70°C for 1 min.
All procedures were approved by the Medical University of South Carolina Institutional Review Board and were performed only after obtaining written informed consent. In the case of additional DNA samples obtained from additional subjects for purposes of determining SNP frequency in the general population, all procedures were approved by the University of Florida Institutional Review Board, and written informed consent was obtained.
Genotyping for CES1 Variants and Determination of SNP Frequency
Genotyping assays were performed in duplicate and analyzed on a Bio-Rad iCycler iQ Multicolor real-time detection system. Real-time polymerase chain reaction (PCR) allelic discrimination assays were designed with Assay by Design service and the specific variants in the CES1 gene, p.Gly143Glu (genomic: nt 9486; cDNA: nt 428, dbSNP ss number: 99307125) and p.Asp260fs (genomic: nt 12754; cDNA: nt 780, dbSNP ss number: 99307126), were identified with fluorogenic TaqMan Probes. The sequences of primers and probes are shown in Table 2.
Table 2.
Sequences of Primers and Probes Used for Real-Time PCR Allelic Discrimination Assay
| Names | Sequences |
|---|---|
| p.Gly143Glu forward | 5′-CCCAGGTGATGGTGTGGAT-3′ |
| p.Gly143Glu reverse | 5′-GCCAGCCCATCATAGGTTGA-3′ |
| p.Gly143Glu Probe, Vic labeled | 5′-CCATCAGCCCCCCTC-3′ |
| p.Gly143Glu Probe, Fam labeled | 5′-CCATCAGCTCCCCTC-3′ |
| p.Asp260fs forward | 5′-TGGCCCTCACTTCTGTTCTG-3′ |
| p.Asp260fs reverse | 5′-CCAGCCGGAGACCTACCT-3′ |
| p.Asp260fs probe, Vic labeled | 5′-AAAGGTGATGTCAAGCC-3′ |
| p.Asp260fs probe, Fam labeled | 5′-AAAGGTGAGTCAAGCC-3′ |
Real-time PCR amplifications were carried out in a 10 μl reaction mix containing 5 ng genomic DNA, 900 nM of each primer, 200 nM of each probe and 5 μl of 2× TaqMan Universal PCR Master Mix (contains PCR buffer, passive reference dye ROX, deoxynucleotides, uridine, uracil-N-glycosylase, and AmpliTaq Gold DNA polymerase; Perkin-Elmer, Applied Biosystems, Foster City, CA, USA). Cycle parameters were as follows: 95°C for 10 min and then 50 cycles of 92°C for 15 s and 60°C for 1 min. Real-time fluorescence detection was performed during the 60°C annealing and extension step of each cycle. We used the IQ software to plot and automatically call genotypes on the basis of a two-parameter plot with fluorescence intensities of FAM and VIC at 49 cycles.
Genomic DNA from 13 additional participants (ten male and three female individuals of European descent) from the same pharmacokinetic study as the aberrant metabolizer was also screened for CES1 variants. These participants exhibited “normal” MPH concentrations consistent with those typically observed in research subjects and available patient studies. The aberrant metabolizer's biological parents were also screened for the CES1 variants. In order to estimate the allelic frequency of these CES1 variants in the general white population, a genomic DNA panel (HD100CAU) representing a cohort of 100 self-declared individuals of European descent (51 males, 49 females) obtained through Coriell Cell Repositories (Coriell Institute, Camden, NJ, USA) was screened. Additionally, genomic DNA samples collected from various self-identified racial and ethnic groups during the course of participation in a large multicenter clinical study of combination antihypertensive treatment (INternational VErapamil SR/Trandolapril Study [INVEST]) were also available for analysis.15 This group consisted of 355 additional white subjects, 117 black subjects, 299 subjects of Hispanic ethnicity, and 54 Asian individuals. The aberrant metabolizer, his parents, and study peers were not included in the calculation of allelic frequency because a priori information regarding their CES1 activity was known to investigators.
Analysis of Pharmacokinetic, Hemodynamic, and Statistical Data
Standard pharmacokinetic analyses were applied to the MPH data with WinNonLin software (Pharsight, Mountainview, CA, USA) and are described in a previous publication.13 We analyzed the AUC, Cmax, and t1/2 with the extreme studentized deviate (ESD) single-outlier procedure16 to determine whether the parameter measurements for the slow metabolizer constituted true statistical outliers. For each parameter, the ESD procedure confirmed the measurement as an outlier at the p < 0.01 level. Because this procedure is known to be conservative, the data from the aberrant metabolizer were reassessed with a similar procedure with respect to the normal participants only.
To determine whether the slow metabolizer of MPH experienced significantly different pharmacodynamic effects as a result of elevated MPH blood concentrations, we examined hemodynamic data that had been collected at eight time points after MPH administration during the study.13 Beyond each subject's measurements of systolic blood pressure (SBP), diastolic blood pressure (DBP), and heart rate (HR), the mean arterial pressure (MAP) was also calculated according to the following formula: MAP = DBP + 1/3 (SBP − DBP).
We considered the set of measures for each endpoint to be a multivariate vector and assessed the Mahalanobis distance for subject's measurements. The Mahalanobis distance, a measure of distance from a central multivariate mean relative to the variance of the endpoints, is useful for identifying outliers via referral to the F distribution. This analysis assumes no explicit model of time effects on the vital signs but recognizes the potential correlation between the repeated measures over time on each participant and tests for simultaneous differences from the mean over the set of time points while controlling the type I error rate. For each of the four endpoint vectors, we tested the a priori hypothesis that the slow metabolizer's measurements were outliers by comparison to Wilk's critical values (α = 0.0125, critical value: 13.8).17 Because we were only testing outlier status for this single participant, no Bonferroni corrections were made within participants; however, we performed each test at the Bonferroni-corrected α = 0.0125 level to adjust for the four endpoints being tested. There were little differences in plasma MPH concentrations between the slow metabolizer and his study peers during the initial 0–1.5 hr time frame (Figure S2), and such a result is probably because of a delay in tablet disintegration, dissolution, and absorption. After this initial period, MPH is subject to first-pass metabolism and CES1-mediated stereoselective hydrolysis, and the two concentration-versus-time curves rapidly diverge from one another (Figure 1 and Figure S2). Therefore, on the basis of this finding and a visual examination of the data, it was decided that a second analysis that excluded measurements taken during the 0–1.5 hr time points would be more appropriate.
The allele frequency was determined by gene counting. Additionally, we tested genotype frequencies within individual sexes and ethnicity groups for any significant departure from the Hardy-Weinberg Equilibrium, using the Chi square test with one degree of freedom.
In Vitro Functional Studies
Establish Cell Lines Stably Expressing Wild-Type and Mutant CES1
Human CES1A1 cDNA cloned into a pCMV-SPORT6 vector was purchased from ATCC. A construct capable of expressing human CES1 in Flp-In™-293 cells (Invitrogen, Carlsbad, CA, USA) was generated with a TA cloning strategy. In brief, the human CES1A1 gene was amplified via PCR, inserted into pcDNA5/FRT/V5-His-TOPO vector, and transformed into One Shot TOP10 Chemically Competent E. coli cells (Invitrogen). The desired plasmid was designed such that the recombinant CES1 would be expressed in mammalian cells with a V5-His tag to facilitate detection and purification. Additionally, we generated another plasmid by inserting a stop codon after CES1A1 gene to yield the constructs expressing CES1 without V5-His tag. Western blotting revealed that the detectable expression levels of V5-His-tagged CES1 were significantly lower than that of untagged CES1; such a result may be caused by incorrect protein folding of tagged CES1. Thus, only untagged CES1 and its associated mutants were used in the enzymatic hydrolysis study. Two constructs of CES1 mutations, p.Gly143Glu and p.Asp260fs, were generated with a site-directed mutagenesis assay. All constructs were subjected to DNA sequencing analysis for confirmation that the desired plasmids were obtained. The identified CES1A1 plasmids (WT, p.Gly143Glu, and p.Asp260fs) were cotransfected with a pOG44 plasmid at a ratio of 1:10 into Flp-In-293 cells with Lipofectamine 2000 (Invitrogen). Additionally, the self-ligated pcDNA5/FRT/V5-His-TOPO vector was included as a vector control. Twenty-four hours after transfection, cells were washed with PBS and fresh complete medium (Dulbecco's modified Eagle's medium containing 10% fetal-bovine serum) was added. Forty-eight hours after transfection, cells were split at a 1:10 ratio and cultured at 37°C until cell attachment was observed. Culture medium was then removed and replenished with complete medium supplemented with the selecting antibiotic hygromycin B (100 μg/mL). The cell lines stably expressing WT, p.Gly143Glu, and p.Asp260fs CES1 were obtained only after a minimum 3 week selection process employing hygromycin B. Each generated cell line was identified by both expression detection and enzymatic-function assays.
Enzymatic-Function Study
After attaining ∼95% confluence, cells were rinsed and harvested in PBS containing 10 mM HEPES (pH 7.4). The cell suspension was then sonicated, and the supernatant 9000 (S9) fraction was collected by centrifugation at 9000 g for 30 min at 4°C. The protein concentration was determined using a Pierce BCA assay kit (Rockford, IL, USA).
The hydrolysis of PNPA was carried out in 96-well culture plates at 37°C in a final volume of 200 μl. The S9 of cells expressing WT and mutant CES1 were diluted in reaction buffer (PBS containing 10 mM HEPES [pH 7.4]) with a final S9 concentration of 20 μg/mL and preincubated at 37°C for 10 min. We initiated the reaction by adding a range of concentrations of PNPA (20–1000 μM). The formation of p-nitrophenol (PNP) from PNPA was determined by the absorbance at 405 nm after incubation at 37°C for 10 min.
For the study of MPH hydrolysis, the reaction was conducted in 1.5 ml Eppendorf tubes with a final S9 concentration of 0.5 mg/mL at a total volume of 100 μL. Prior to incubations, d- and l- MPH solutions were prepared freshly in 50 μl reaction buffer and then mixed with 50 μl of S9 with final substrate concentrations ranging from 20 μM to 1000 μM. After incubation at 37°C for 2 hr, the reaction was terminated by addition of 500 μl of methanol. The precipitated protein was then removed by centrifugation (20,000 g for 5 min at 4°C). Concentrations of the primary phase I MPH metabolite produced via hydrolysis, RA, was determined with an established HPLC method described below.
Both PNPA and MPH were spontaneously hydrolyzed in the reaction buffer. Thus, after the enzymatic assay, the values determined for spontaneous PNP and RA hydrolysis were subtracted from the total PNP and RA production. Notably, the empty-vector-transfected cells did not display any measurable catalytic activity or expression of CES1. All collected data were fit to the Michaelis-Menten equation, and kinetic parameters were calculated with nonlinear regression analysis with Graphpad Prism software (Graphpad Software, San Diego, CA, USA).
HPLC Analysis
A high-performance liquid chromatography (HPLC) method was employed to determine RA concentrations on the basis of the method described by Soldin and associates.18 The HPLC system consisted of an Agilent 1100 module, a C18 reversed-phase column (250 × 4.6 mm, 5 μm) preceded by a 4 mm × 3 mm C18 guard column (Phenomenex, Torrance, CA, USA), and a diode-array detector. The separation was performed with acetonitrile/20 mM KH2PO4, pH 3.8 (16/84, v/v) with a flow rate of 1.0 mL/min and column temperature set at 40°C. The detection wavelength was set at 192 nm. RA was eluted at 7.6 min. The lower limit of quantification of RA was 0.2 μM.
Results
Pharmacokinetic Statistical Analysis
On the basis of the ESD analyses applied to the data, we estimated the subject's AUC, Cmax, and t1/2 values of d-MPH were 7.3, 4.9, and 5.2 standard deviations from the mean of the other 19 normal volunteers, respectively (Table S1). These results demonstrate that this aberrant metabolizer's individual key pharmacokinetic parameters (i.e., AUCinf, Cmax, and t1/2) were statistical outliers suggestive of a metabolic abnormality.
Pharmacodynamic Statistical Analysis and Consequences of a CES1 Deficiency
When all data including that from the time points 0–1.5 hr were included in the data set, the slow metabolizer was an outlier for the endpoint of MAP (distance: 18.0), whereas SBP approached statistical significance (distance: 13.3 compared to the critical value 13.8). However, the subject was not an outlier for the measures of DBP and HR. When the time frame during which MPH absorption generally occurs after oral administration was excluded (i.e., 0–1.5 hr) statistical outlier status was achieved for all hemodynamic measures (i.e., SBP, DBP, HR, and MAP). Values prior to dosing as well as maximum values for the slow metabolizer versus the other 19 subjects are shown in Table 3.
Table 3.
Hemodynamic Parameters in the Slow Metabolizer versus the 19 Study Peers Prior to Dosing with Methylphenidate and the Maximum Values Obtained
| Hemodynamic parameter |
Predose |
Maximum Value |
||
|---|---|---|---|---|
| Mean (SD) | Outlier | Mean (SD) | Outlier | |
| Systolic blood pressure | 114 (12) | 100 | 120 (10) | 138 |
| Diastolic blood pressure | 65 (9) | 60 | 68 (8) | 78 |
| Mean arterial pressure | 82 (9) | 73 | 85 (8) | 97 |
| Pulse | 62 (10) | 70 | 74 (11) | 93 |
Identification of CES1 Polymorphisms
All 14 exons of the CES1 gene were sequenced. Two nonsynonymous, coding region variants of CES1 were identified (Figure S3). The first was a substitution (p.Gly143Glu) in exon 4 at the second nucleotide (nt) of codon 143 (genomic: nt 9486; cDNA: nt 428), changing G to A (GGG→GAG). This results in the nonconservative amino acid substitution of glycine 143 to glutamic acid (Gly143Glu). The second variant identified (p.Asp260fs) was a deletion (T/−) occurring in exon 6 at the last nucleotide (genomic: nt 12754; cDNA: nt 780) of codon 260 (GAT→GA-G). This results in a frameshift (p.Asp260fs) mutation that changes aspartic acid 260 to glutamic acid and alters the next 39 residues from the wild-type (WT) sequence, before truncating early at a premature stop codon (Figure S3). Thus, wild-type CES1 and the substitution (p.Gly143Glu) variant are each 567 amino acids long, but the frameshift (p.Asp260fs) variant is limited to 298 amino acids (the first 259 wild-type followed by 39 missense residues and early truncation).
Allelic Frequency of Mutations in Specific Racial and Ethnic Groups
The allelic frequency of these CES1 variants was determined utilizing the described genomic DNA data set. Of those, 455 white subjects, 117 black subjects, and 299 Hispanic individuals were studied, and a total of 34, 10, and 12 were identified as heterozygous for p.Gly143Glu, respectively. Thus, the minor allele frequency (MAF) of p.Gly143Glu is estimated to be 3.7%, 4.3%, and 2.0% in white, black, and Hispanic populations, respectively. There was no deviation from Hardy-Weinberg Equilibrium in any of the populations in which the variant was detected. Additionally, p.Gly143Glu was not identified in 54 Asian subjects studied, indicating the variant should be considered as rare in Asian population (Table S2). The p.Asp260fs appears to be a rare mutation being found in none of the 925 subjects genotyped with a frequency substantially lower than 1%. There were no statistically significant differences between sexes in the MAF of p.Gly143Glu in any racial or ethnic group. Lastly, genotyping of each of the aberrant metabolizer's biological parents revealed that the father was heterozygous for p.Gly143Glu, whereas the mother was heterozygous for p.Asp260fs. This indicates that the two variants are not in linkage disequilibrium and are thus found on separate alleles.
Enzymatic Activity of CES1 and Its Mutants on MPH and PNPA Hydrolysis
We determined kinetic parameters (Vmax and Km) of CES1 and its mutations for PNPA and d- and l-MPH by measuring the rate of enzymatic production of PNP and RA at different substrate concentrations and fitting the data to the Michaelis-Menten equation with nonlinear regression analysis.
PNPA is a sensitive and established model substrate of CES1 as well as other human esterases. The results demonstrated that WT CES1 exhibited significant catalytic activity on PNPA hydrolysis with Vmax and Km values of 493.9 nmole/min/mg protein and 106.6 μM, respectively. Significantly decreased enzymatic activity of p.Gly143Glu and p.Asp260fs were observed. The Vmax values of p.Gly143Glu and p.Asp260fs were only 18.6% and 5.7% of that of WT CES1, respectively. The Km value for p.Gly143Glu is comparable to that of WT, whereas p.Asp260fs is ∼9.5 times greater than that of WT, indicating the affinity of p.Asp260fs (but not p.Gly143Glu) to its recognized substrate was noted to be significantly decreased (Figure 2 and Table 4).
Figure 2.
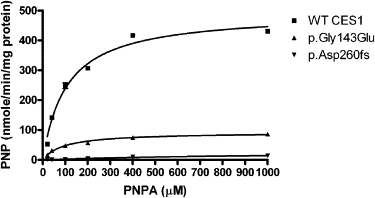
Hydrolysis of PNPA by CES1 and Its Mutants
Cell S9 fractions prepared from cells transfected with cDNA constructs encoding WT, p.Gly143Glu, and p.Asp260fs CES1 were assayed for their catalytic activity to PNPA hydrolysis. The hydrolytic product PNP was monitored by the absorbance at 405 nm after incubating PNPA with cell S9 (20 μg/ml) at 37°C for 10 min. Data were expressed as the mean ± SD (n = 3).
Table 4.
Kinetic Parameters of Enzymic Hydrolysis of PNPA, l-MPH, and d-MPH
| Substrates | Enzymes | Vmax | Km | Vmax/Km |
|---|---|---|---|---|
| PNPA | ||||
| WT | 493.9 ± 14.3 | 106.6 ± 10.1 | 4.63 | |
| p.Gly143Glu | 92.0 ± 2.9 | 93.2 ± 9.8 | 0.99 | |
| p.Asp260fs | 28.0 ± 6.1 | 950.4 ± 352.1 | 0.03 | |
| l-MPH | ||||
| WT | 1701.0 ± 196.5 | 775.7 ± 161.9 | 2.19 | |
| p.Gly143Glu | N.D. | N.D. | N.D. | |
| p.Asp260fs | N.D. | N.D. | N.D. | |
| d-MPH | ||||
| WT | 177.2 ± 29.6 | 663.5 ± 210.0 | 0.27 | |
| p.Gly143Glu | N.D. | N.D. | N.D. | |
| p.Asp260fs | N.D. | N.D. | N.D. | |
Values represent the mean ± SD (n = 3). N.D., not detectable. Km values are in micromolar. Vmax values for PNPA and MPH are in nmole/min/mg protein and pmole/min/mg protein, respectively. Vmax/Km values for PNPA and MPH are in ml/min/mg protein and μl/min/mg protein, respectively.
The MPH hydrolysis study demonstrated that WT CES1 exhibited substantial stereoselectivity relative to catalytic efficiency with l-MPH favored over the d-isomer with a Vmax of 1701.0 and 177.2 pmole/min/mg protein, respectively. These stereoselective actions were entirely consistent with our previous clinical observations and those of other investigators.10,13,19 The catalytic activity produced by CES1 mutants, p.Gly143Glu, and p.Asp260fs toward MPH hydrolysis were too low to be determined under our experimental conditions even when a very high S9 concentration (2 mg/ml) was employed (Figure 3 and Table 4).
Figure 3.
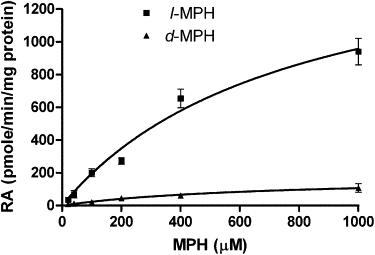
Catalytic Activity of WT CES1 and Its Variants on d-MPH and l-MPH Hydrolysis
After d- and l-MPH (20–1000 μM) were incubated with S9 (500 μg/ml) from cells transfected with WT, p.Gly143Glu, and p.Asp260fs CES1 at 37°C for 2 hr, the produced RA was measured by HPLC assay. Significant catalytic stereoselectivity of WT CES1 was found in catalyzing d- and l-MPH hydrolysis. p.Gly143Glu and p.Asp260fs failed to show any hydrolytic activity on both d- and l-isomer of MPH. Data are means ± SD for three independent experiments.
Discussion
This study identified two variants in the CES1 gene. One in exon 4 is located in codon 143 (GGG→GAG) and leads to the nonconservative glycine 143 to glutamic acid amino acid substitution (p.Gly143Glu). A deletion in exon 6 at codon 260 results in a frameshift mutation that alters residues 260–299 before truncating early at a premature stop codon (p.Asp260fs). These mutations led to grossly elevated total MPH blood concentrations along with a distortion in the typical isomer disposition within an individual who was heterozygous for both mutations on separate alleles of the CES1 gene.
In order to determine whether the variations in CES1 activity led to a quantifiable difference in the pharmacodynamic effects of MPH, we compared the hemodynamic response of this individual to his study peers. The subject was an outlier for all endpoints (SBP, DBP, HR, and MAP) with data points obtained 1.5 hr after MPH administration. Importantly, therapeutic doses of MPH can occasionally cause adverse cardiovascular effects.20–22 In rare instances, stroke or sudden death has been reported in patients with underlying risk factors (FDA, FDA Directs ADHD Drug Manufacturers to Notify Patients about Cardiovascular Adverse Events and Psychiatric Adverse Events). The present results suggest a potential for an increased risk of adverse events in individuals with either identified CES1 variants, a risk that would be expected to increase with the thrice daily dosing typically recommended with immediate release MPH or the use of the once daily formulations that presently dominate the market.7,11
To reveal the molecular genetic basis of the profoundly altered pharmacokinetics and enhanced pharmacodynamic effects of MPH in the deficient metabolizer, we investigated the catalytic function of each CES1 variant with the cells stably expressing WT CES1, p.Gly143Glu, and p.Asp260fs. The results demonstrated that the catalytic efficiency of CES1 was dramatically decreased in p.Gly143Glu and p.Asp260fs. This observation is in good agreement with the hypothesis of CES1-mediated catalysis mechanism recently proposed.23 The CES1 enzyme belongs to a larger family of serine hydrolases, which include human acetylcholinesterase (AcChE) and butyrylcholine esterase (BuChE). Crystal structures of CES1, AcChE, and BuChE indicate that each has an analogous active-site groove containing a catalytic triad consisting of a serine, a glutamic acid, and a histidine residue.23 For CES1, the corresponding active-site triad residues are serine 221 (S), glutamic acid 354 (E), and histidine 468 (H; shown in bold in Figure S3). A series of three consecutive glycine residues is also located in the active site of CES1 (Gly141–143) and create what is now referred to as an oxyanion hole. The oxyanion hole is thought to stabilize substrate-enzyme intermediates and, thus, would prove fundamental to CES1 functionality.23 The catalytic triad and oxyanion hole are evolutionarily conserved both across species and within related serine hydrolases.23 In p.Asp260fs, the subsequent frameshift and early truncation as a result of deletion of nucleotide 780 results in a protein missing two of the three conserved catalytic-triad residues (Figure S3). However, the apparent rarity of the p.Asp260fs indicates this mutation is of considerably less clinical concern than p.Gly143Glu. When the glycine in BuChE (analogous to Gly143 in CES1) was mutated, both substrate affinity and catalysis were markedly reduced or abolished.24 This suggests that the mutation resulting in substitution of Gly143 with glutamic acid (i.e., p.Gly143Glu) is of critical importance and could probably result in dysfunctional CES1. Taken together, these findings support the hypothesis that both identified CES1 variants are likely to result in significant loss of CES1 activity, which has been demonstrated by our in vitro functional studies, and either is sufficient to significantly disrupt catalytic activity. The aberrant metabolizer was heterozygous for both mutations, and each mutation occurred on a different allele. Because of the estimated frequencies of each variants, having one of these mutants on both alleles is expected to be an extremely rare occurrence. Nevertheless, the serendipitous identification of the subject's phenotype was key to discovering and exploring the two variants described.
The CES1 enzyme catalyzes the hydrolysis of drugs from numerous classes. Ester cleavage generally produces inactive metabolite(s) as in the case of MPH.1,11 However, CES1 is also known to be involved in the generation of active metabolites including the conversion of heroin to monoacetylmorphine and morphine.1,2 Of perhaps greater significance is the role of CES1 in the activation of prodrugs including a number of ACE inhibitors (e.g., quinapril) and the anti-influenza agent oseltamivir.25,26 There is at least one research report in which a SNP in the promoter region of CES1, A(−816)C, favorably influenced the antihypertensive response to the prodrug angiotensin-converting enzyme inhibitor imidapril, which highlights the importance of adequate and functional CES1 when administering prodrug substrates of this enzyme.27 Additionally, functional CES1 is required for the mediation of transesterification reactions.14 With regard to drugs of abuse, the existence of an unrecognized CES1 deficiency could potentially lead to toxicities and/or fatal exposures misinterpreted as intentional or accidental drug overdoses if the judgment were made on the basis of antemortem or postmortem concentrations. Furthermore, these hydrolytic reactions can proceed on a stereoselective basis resulting in a distortion of the anticipated disposition of a racemic compound such as dl-MPH (Figure 1).10 The effect of each individual variant on the metabolism of other substrates will need to be further investigated. Finally, the presence of dysfunctional or nonfunctional CES1 may result in a poor response to a variety of prodrugs formulated as esters for the purpose of enhanced bioavailability3 because of the inability of CES1 to cleave and liberate the active therapeutic moiety.
Further studies are needed to define the clinical significance of each allele as it relates to drug response and adverse events. Beyond MPH, these variants in the CES1 gene are pertinent to the use of a diverse group of therapeutic agents as well as individuals abusing illicit substances. Genotyping individuals participating in well-designed clinical studies of known CES1 substrates will be an initial step in evaluating the true clinical significance of these variants and their contribution to individualized pharmacotherapy.
Supplemental Data
Three figures and two tables are available at http://www.ajhg.org/.
Supplemental Data
Web Resources
The URLs for data presented herein are as follows:
GenBank, http://www.ncbi.nlm.nih.gov/Genbank
Online Mendelian Inheritance in Man (OMIM), http://www.ncbi.nlm.nih.gov/Omim
Accession Numbers
The dbSNP ss accession number for the p.Gly143Glu and p.Asp260fs sequences discussed in this report are 99307125 and 99307126, respectively.
Acknowledgments
This work was partially supported by National Institutes of Health (NIH) Grants R01 DA-15797, R01 AA-016707, M01 RR01070-18, R01 HL74730, and Abbott Laboratories. The authors also acknowledge the invaluable input of Rebecca S. McNeil, Ph.D., regarding the statistical analysis of outlier data and Yan Gong, Ph.D., regarding statistical analysis of genotyping data.
References
- 1.Laizure S.C., Mandrell T., Gades N.M., Parker R.B. Cocaethylene metabolism and interaction with cocaine and ethanol: Role of carboxylesterases. Drug Metab. Dispos. 2003;31:16–20. doi: 10.1124/dmd.31.1.16. [DOI] [PubMed] [Google Scholar]
- 2.Redinbo M.R., Bencharit S., Potter P.M. Human carboxylesterase 1: From drug metabolism to drug discovery. Biochem. Soc. Trans. 2003;31:620–624. doi: 10.1042/bst0310620. [DOI] [PubMed] [Google Scholar]
- 3.Beaumont K., Webster R., Gardner I., Dack K. Design of ester prodrugs to enhance oral absorption of poorly permeable compounds: Challenges to the discovery scientist. Curr. Drug Metab. 2003;4:461–485. doi: 10.2174/1389200033489253. [DOI] [PubMed] [Google Scholar]
- 4.Biederman J. Attention-deficit/hyperactivity disorder: A selective overview. Biol. Psychiatry. 2005;57:1215–1220. doi: 10.1016/j.biopsych.2004.10.020. [DOI] [PubMed] [Google Scholar]
- 5.Faraone S.V., Sergeant J., Gillberg C., Biederman J. The worldwide prevalence of ADHD: Is it an American condition? World Psychiatry. 2003;2:104–113. [PMC free article] [PubMed] [Google Scholar]
- 6.McGough J.J. Attention-deficit/hyperactivity disorder pharmacogenomics. Biol. Psychiatry. 2005;57:1367–1373. doi: 10.1016/j.biopsych.2004.10.021. [DOI] [PubMed] [Google Scholar]
- 7.Markowitz J.S., Straughn A.B., Patrick K.S. Advances in the pharmacotherapy of attention-deficit-hyperactivity disorder: Focus on methylphenidate formulations. Pharmacotherapy. 2003;23:1281–1299. doi: 10.1592/phco.23.12.1281.32697. [DOI] [PubMed] [Google Scholar]
- 8.Patrick K.S., Caldwell R.W., Ferris R.M., Breese G.R. Pharmacology of the enantiomers of threo-methylphenidate. J. Pharmacol. Exp. Ther. 1987;241:152–158. [PubMed] [Google Scholar]
- 9.Patrick K.S., Kilts C.D., Breese G.R. Synthesis and pharmacology of hydroxylated metabolites of methylphenidate. J. Med. Chem. 1981;24:1237–1240. doi: 10.1021/jm00142a021. [DOI] [PubMed] [Google Scholar]
- 10.Sun Z., Murry D.J., Sanghani S.P., Davis W.I., Kedishvili N.Y., Zou Q., Hurley T.D., Bosron W.F. Methylphenidate is stereoselectively hydrolyzed by human carboxylesterase CES1A1. J. Pharmacol. Exp. Ther. 2004;310:469–476. doi: 10.1124/jpet.104.067116. [DOI] [PubMed] [Google Scholar]
- 11.Patrick K.S., Gonzalez M.A., Straughn A.B., Markowitz J.S. New methylphenidate formulations for the treatment of attention-deficit/hyperactivity disorder. Expert Opin. Drug. Deliv. 2005;2:121–143. doi: 10.1517/17425247.2.1.121. [DOI] [PubMed] [Google Scholar]
- 12.Markowitz J.S., Patrick K.S. Differential pharmacokinetics and pharmacodynamics of methylphenidate enantiomers: Does chirality matter? J. Clin. Psychopharmacol. 2008;28:S54–S61. doi: 10.1097/JCP.0b013e3181733560. [DOI] [PubMed] [Google Scholar]
- 13.Patrick K.S., Straughn A.B., Minhinnett R.R., Yeatts S.D., Herrin A.E., DeVane C.L., Malcolm R., Janis G.C., Markowitz J.S. Influence of ethanol and gender on methylphenidate pharmacokinetics and pharmacodynamics. Clin. Pharmacol. Ther. 2007;81:346–353. doi: 10.1038/sj.clpt.6100082. [DOI] [PMC free article] [PubMed] [Google Scholar]
- 14.Imai T. Human carboxylesterase isozymes: Catalytic properties and rational drug design. Drug Metab. Pharmacokinet. 2006;21:173–185. doi: 10.2133/dmpk.21.173. [DOI] [PubMed] [Google Scholar]
- 15.Brunner M., Cooper-DeHoff R.M., Gong Y., Karnes J.H., Langaee T.Y., Pepine C.J., Johnson J.A. Factors influencing blood pressure response to trandolapril add-on therapy in patients taking verapamil SR (from the International Verapamil SR/Trandolapril [INVEST] Study) Am. J. Cardiol. 2007;99:1549–1554. doi: 10.1016/j.amjcard.2007.01.029. [DOI] [PMC free article] [PubMed] [Google Scholar]
- 16.Rosner B. Fifth Edition. Duxbury Press; Pacific Grove, CA: 2000. Fundamentals of Biostatistics. [Google Scholar]
- 17.Penny K. Appropriate critical values when testing for a single multivariate outlier by using the Mahalanobis distance. Appl. Stat. 1996;45:73–81. [Google Scholar]
- 18.Soldin S.J., Chan Y.P., Hill B.M., Swanson J.M. Liquid-chromatographic analysis for methylphenidate (Ritalin) in serum. Clin. Chem. 1979;25:401–404. [PubMed] [Google Scholar]
- 19.Zhang J., Deng Y., Fang J., McKay G. Enantioselective analysis of ritalinic acids in biological samples by using a protein-based chiral stationary phase. Pharm. Res. 2003;20:1881–1884. doi: 10.1023/b:pham.0000003389.77585.be. [DOI] [PubMed] [Google Scholar]
- 20.Kelly R.P., Yeo K.P., Teng C.-H., Smith B.P., Lowe S., Soon D., Read H.A., Wise S.D. Hemodynamic effects of acute administration of atomoxetine and methylphenidate. J. Clin. Pharmacol. 2005;45:851–855. doi: 10.1177/0091270005276737. [DOI] [PubMed] [Google Scholar]
- 21.Findling R., Short E., Manos M. Short-term cardiovascular effects of methylphenidate and adderall. J. Am. Acad. Child Adolesc. Psychiatry. 2001;40:525–529. doi: 10.1097/00004583-200105000-00011. [DOI] [PubMed] [Google Scholar]
- 22.Volkow N.D., Wang G.-J., Fowler J.S., Molina P.E., Logan J., Gatley S.J., Gifford A., Ding Y.-S., Wong C., Pappas N.R. Cardiovascular effects of methylphenidate in humans are associated with increases of dopamine in brain and of epinephrine in plasma. Psychopharmacology (Berl.) 2003;166:264–270. doi: 10.1007/s00213-002-1340-7. [DOI] [PubMed] [Google Scholar]
- 23.Fleming C.D., Bencharit S., Edwards C.C., Hyatt J.L., Tsurkan L., Bai F., Fraga C., Morton C.L., Howard-Williams E.L., Potter P.M. Structural Insights into Drug Processing by Human Carboxylesterase 1: Tamoxifen, Mevastatin, and Inhibition by Benzil. J. Mol. Biol. 2005;352:165–177. doi: 10.1016/j.jmb.2005.07.016. [DOI] [PubMed] [Google Scholar]
- 24.Masson P., Froment M.-T., Gillon E., Nachon F., Lockridge O., Schopfer L.M. Hydrolysis of oxo- and thio-esters by human butyrylcholinesterase. Biochim. Biophys. Acta. 2007;1774:16–34. doi: 10.1016/j.bbapap.2006.10.012. [DOI] [PubMed] [Google Scholar]
- 25.Satoh T., Taylor P., Bosron W.F., Sanghani S.P., Hosokawa M., Du B.N.L. Current progress on esterases: From molecular structure to function. Drug Metab. Dispos. 2002;30:488–493. doi: 10.1124/dmd.30.5.488. [DOI] [PubMed] [Google Scholar]
- 26.Shi D., Yang J., Yang D., LeCluyse E.L., Black C., You L., Akhlaghi F., Yan B. Anti-influenza prodrug oseltamivir is activated by carboxylesterase human carboxylesterase 1, and the activation is inhibited by antiplatelet agent clopidogrel. J. Pharmacol. Exp. Ther. 2006;319:1477–1484. doi: 10.1124/jpet.106.111807. [DOI] [PubMed] [Google Scholar]
- 27.Geshi E., Kimura T., Yoshimura M., Suzuki H., Koba S., Sakai T., Saito T., Koga A., Muramatsu M., Katagiri T. A single nucleotide polymorphism in the carboxylesterase gene is associated with the responsiveness to imidapril medication and the promoter activity. Hypertens. Res. 2005;28:719–725. doi: 10.1291/hypres.28.719. [DOI] [PubMed] [Google Scholar]
Associated Data
This section collects any data citations, data availability statements, or supplementary materials included in this article.