

Abstract
We report here a preliminary model of the genetic architecture of Autoimmune Thyroid Disorder (AITD). Using a flexible class of mathematical modeling techniques, applied to an established set of data and supplemented with information both from candidate-gene and genome-wide-association studies and from basic bioinformatics, we find strong statistical support for a model in which AITD is the result of “hits” along three distinct genetic pathways: affected individuals have (1) a genetic susceptibility to clinical AITD, along with (2) a separate predisposition to develop the autoantibodies characteristic of AITD, and they also have (3) a predisposition to develop high levels of autoantibodies once they occur. Genes underlying each of these factors then appear to interact with one another to cause clinical AITD. We also find that a genetic variant in CTLA4 that increases risk for AITD in some people might actually protect against AITD in others, depending on which additional risk variants an individual carries. Our data show that the use of statistical methods for the incorporation of information from multiple sources, combined with careful modeling of distinct intermediate phenotypes, can provide insights into the genetic architecture of complex diseases. This model has several clinical implications, which we believe will prove relevant to other complex diseases as well.
Main Text
Autoimmune thyroid disease (AITD [MIM 608173]) includes a number of conditions that share common cellular and humoral immune responses targeted at the thyroid gland. AITD includes Graves' disease (GD [MIM 275000]) and Hashimoto's thyroiditis (HT [MIM 140300]), both of which are characterized by the infiltration of the thyroid by T and B cells that are reactive with thyroid antigens and the production of thyroid autoantibodies (Tab), with the resultant clinical manifestations.1 Although some evidence has been found that there might be genes specific to either GD or HT,2,3 there is also considerable evidence of genes common to both and, in fact, of genes common to multiple autoimmune diseases, such as AITD and Type I Diabetes.
Genes known to play a role in AITD include HLA,3,4 CTLA4 (MIM 123890), thyroglobulin (TG [MIM 188450]),3 THSR,1 and CD401 (MIM 109535). An additional class of genes implicated in multiple autoimmune diseases is the protein tyrosine phosphatases (PTP). Genome-wide association studies (GWAS) have recently reported associations between PTPN2 (MIM 176887) and both Type 1 Diabetes and AITD;5,6 a different PTP gene, PTPN22 (MIM 600716) has also been implicated in AITD as well as in other autoimmune diseases.1,3
Among the genes known to be associated with AITD, cytotoxic T lymphocyte antigen-4 (CTLA4) on 2q33 is one of the most well-studied genes.3,7 Associations with several CTLA4 SNPs have been established, with the most widely replicated of these being association with the G allele of the A49G SNP (rs57563726), which has been consistently found in multiple studies involving over 15,000 individuals in all.7 This allele has also been shown to alter T cell phosphorylation patterns in a cohort of normal individuals.8 This suggests a possible gene pathway involving both CTLA4 and genes in the PTP superfamily. Note too that KIAA0350, which was recently reported to be associated with AITD and Type 1 diabetes on the basis of GWAS,5,6 contains an immunoreceptor tyrosine-based inhibitory motif, as does CTLA4.
Given that HLA, the PTP superfamily, and CTLA4 have all been implicated in other autoimmune disorders, as well as in AITD, a picture is beginning to emerge of a pathway that may serve as a background to development of autoimmunity in general. As might be expected, each of the known background genes appears to contribute only a small risk of disease. In particular, CTLA4 is estimated to confer a relative risk of just 1.3–1.7.7 It seems likely that additional AITD-specific genes remain to be discovered and virtually certain that AITD genetic architecture involves gene-gene interactions.
An additional issue in the modeling of the genetic architecture of AITD is that little is known about the genetics of Tab. High Tab levels are pathognomonic of AITD, and elevated levels in clinically unaffected individuals are used to predict AITD risk. Understanding of the genetic relationship between Tab and AITD therefore seems crucial to understanding the mechanisms underlying AITD development. But all AITD patients initially have high Tab levels, which are subsequently reduced with treatment. Hence, parsing of the genetic regulation of Tab versus that of AITD itself is difficult, requiring both appropriate data sets and also statistical methods that can be tailored to this particular situation.
In order to model the role of CTLA4 in the genetic architecture of AITD and Tab, we took advantage of a large set of pedigrees (N = 102, comprising 742 individuals, of whom 540 were genotyped), ascertained for the presence of at least two members with clinical AITD (GD or HT) and at least four available first-degree relatives from two generations (avg. number of AITD individuals per pedigree = 2.6). This study had institutional review board approval. GD was diagnosed by (1) documented clinical and biochemical hyperthyroidism requiring treatment, (2) a diffuse goiter, (3) the presence of TSHR antibodies, and/or (4) diffusely increased I-131 uptake in the thyroid gland. HT was diagnosed by (1) documented clinical and biochemical hypothyroidism requiring thyroid-hormone replacement and (2) the presence of autoantibodies to thyroid peroxidase (TPO). These families were previously analyzed for linkage to AITD with the use of LOD scores,2 yielding evidence of linkage to 6p, 8q, and 10q, with maximum multipoint heterogeneity LOD scores of 2.0, 3.5, and 4.1, respectively.
Here we go beyond the search for individual loci to the modeling of more complex phenotypic relationships and gene-gene interactions. Novel data utilized in the current analyses include Tab as a quantitative trait. For purposes of these analyses, Tab was taken to be the maximum reading obtained from assays for antithyroglobulin (Tg) and anti-TPO; in both cases antibodies were measured by specific radioimmunoassay (Kronus). Tab was assayed in all available unaffected relatives (N = 222). In addition, for these analyses all samples were genotyped at the associated CTLA4 A49G SNP.
The previous 10 cM microsatellite genome scan was also available for all families. In brief, these data were generated as follows: DNA was extracted from whole blood through use of the Puregene kit (Gentra Systems), and the Perkin Elmer microsatellite panel (version 2.0, total of 400 markers) were typed as reported elsewhere;2 an additional 36 markers were run in regions of interest prior to the current analyses (including CTLA4 A49G). PCR products were generated with standard protocols followed and processed with an ABI 310 genetic analyzer (Applied Biosystems). Allele calling was done with Genotyper 2.0 software. Marker data were cleaned for the presence of Mendelian inconsistencies, and Merlin9 was run in regions of interest to detect unlikely double recombinants; the repeating of analyses with potential genotyping errors removed did not change results reported here.
All analyses were conducted with the software package Kelvin,10 which implements the PPL class of models for measurement of the strength of genetic evidence.11,12 The PPL is parameterized in terms of a general approximating likelihood, and all parameters of the trait model are then integrated out, permitting the use of Bayes' theorem for computation of the posterior probability of the hypothesis of interest. All results were based on multipoint analysis; Hardy-Weinberg equilibrium has been assumed throughout. The Rutgers combined genetic map was used.13–15
In modeling of the genotype-phenotype relationship, definition of the phenotype is critically important. Because we were interested in the genetic relationship between AITD and Tab, we considered three distinct models: (A) AITD, which considers AITD alone as a dichotomous (Y or N) trait, independent of Tab; (B) Tab, which treats Tab (presence/absence) as an independent risk factor for development of AITD; and (C) Tab→AITD, under which Tab is an underlying risk factor for AITD, with clinical AITD being a manifestation of high levels of Tab under a classical quantitative-trait-threshold model. (We lack sufficient data in these particular pedigrees to search for Tab alone as a quantitative trait.)
Accordingly, three basic models were utilized in the analyses presented here. The first is a simple dichotomous trait model, with parameters α (the standard admixture parameter of Smith,16 representing the proportion of “linked” pedigrees), p (the disease-allele frequency), and the penetrance vector fi (i = 1..3, representing the probability that an individual with genotype i develops disease, for each of the three possible genotypes: DD, Dd, and dd). As with all forms of the PPL, the trait parameters are integrated out of the final statistic; while the gene frequency is integrated over its full range, an ordering constraint is imposed on the penetrances such that f1 ≥ f2 ≥ f3. This model has been shown to represent a robust approximation for the mapping of complex traits,17–19 and because the parameters are integrated out of the underlying likelihoods, no specific assumptions regarding their values are required. This model was used for AITD, with only AITD individuals considered “affected” regardless of Tab status; and for Tab, with all individuals with either AITD or Tab > 0.30 (the lower limit of laboratory precision) considered “affected” for Tab. (Recall that all AITD individuals have elevated Tab.)
The second model is a variation on the quantitative-trait-threshold model described in detail in20,21 (For additional details on the PPL method in general see 21). The trait locus is parameterized in terms of α and p, as above, but the trait distribution is parameterized as a mixture of continuous probability density functions, one for each trait genotype. In the case of Tab, which has a floor value at 0.3 (Kronus units/ml), we use a mixture of χ2s, which gives an excellent empirical fit to the overall data. In addition, in order to take full advantage of all of the (dichotomous and quantitative) data in modeling of the AITD-Tab relationship, we extend this basic quantitative-trait model to include a threshold parameter t, such that any affected individual is presumed to have an underlying Tab value greater than t and, similarly, any unaffected individual is presumed to have a value less than t. As in the case of the dichotomous trait, all parameters of the trait model are then integrated out: thus, in this case the integration is over α, p, a vector of three χ2 means (degrees of freedom), and t. Again an ordering constraint is placed on the means. For purposes of these analyses, individuals with AITD were considered affected, whereas unaffected individuals with Tab ≥ 0.3 were assigned their quantitative Tab levels. (Recall that in AITD patients, levels of Tab are reduced by treatment; thus, quantitative values in affected individuals are not genetically useful phenotypes.) Unaffected individuals with a measured Tab < 0.3 were coded as unaffected. This model enables us to parse genetic contributions to AITD and Tab through simultaneous analysis in the same set of pedigrees.
The final model used here is a simple variant of each of the models just described, in which instead of using a single ordered vector of penetrances (or means, in the case of the quantitative-trait-threshold model), we parameterize the model in terms of two separate penetrance (mean) vectors, allowing the penetrance (mean) to differ between individuals who are GG or GA at the A49G CTLA4 SNP and individuals who are AA.10 This gives rise to the epistasis PPL, or E-PPL. As previously, the additional parameters are integrated out of the final model. (While allowing the means to differ across CTLA4 genotype classes, we constrained the threshold to be the same regardless of CTLA4 status.) In this way we explicitly model two-locus epistasis, in which the penetrance (mean) at any given locus is allowed to depend upon the genotype at CTLA4. A further extension of this method would be to model three-locus interactions; however, this is not feasible at present for computational reasons.
The PPL is on the probability scale, and its interpretation is therefore straightforward: a PPL of, for instance, 40% means that there is a 40% probability of a trait gene at the given location on the basis of these data. For biological reasons and on the basis of earlier calculations,22 the prior probability at each location is set to 2%, so that PPLs > 2% indicate (some degree of) evidence in favor of the location as the site of a trait gene, whereas PPLs < 2% represent evidence against the location. The PPL is a measure of statistical evidence, not a decision-making procedure; therefore there are no “significance levels” associated with PPL values and the PPL is not interpreted in terms of its associated error probabilities.23–26 Nevertheless, it may assist readers to have some sense of scale relative to more-familiar frequentist test statistics. In a simulation of 10,000 replicates under the null hypothesis (no trait gene at the location being tested), PPLs of 5%, 25%, and 80% were associated with Type 1 error probabilities of 0.02, 0.0009, and 0.0001, respectively.17 Because all model parameters are integrated out of the PPL, its scale remains constant across models. Thus, these results apply to all analyses conducted here. (By contrast, maximized statistics need to be “adjusted” for the number of parameters over which they are maximized.) We note too that, again, because it is a measure of evidence rather than a test of hypothesis, a multiple-testing correction is not applied to the PPL, just as one would not “correct” a measure of the temperature made in one location for readings taken at different locations.
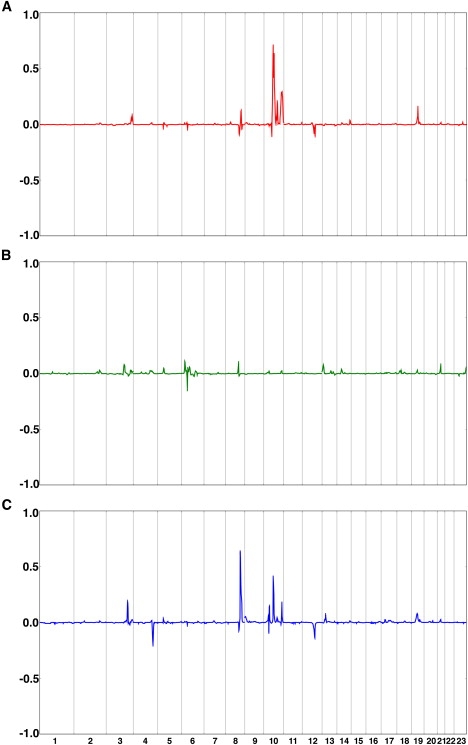
Figure 1 shows results for the baseline genome scan. Overall, 72% of the genome showed evidence against the presence of a trait gene (PPL < 2%) for AITD (Figure 1A), and 95% of the genome showed PPLs < 5%. Against this very clean baseline, six peaks (on 5p14, 8q24, 10q11, 10q21, 10q26, and 12q23) stand out. The peak on chromosome 8q24 is within a few cM of the thyroglobulin gene (TG), a region implicated in earlier linkage studies.1,3
Figure 1.

Baseline PPLs for AITD, Tab, and Tab→AITD
(A) Baseline PPLs for AITD.
(B) Baseline PPLs for Tab.
(C) Baseline PPLs for Tab→AITD.
The x axis represents the genome in Kosambi cM units for chromosomes 1- X. The y axis shows the PPL on the probability scale, representing the probability of a gene for the given phenotype at each position.
Tab analysis greatly strengthened evidence of a gene on 6p22 and suggested a potential new locus on 18p11, in the vicinity of PTPN26 (Figure 1B). Note too the small but clearly visible peak on 2q33, which contains CTLA4. Each of these loci lines up with an attractive immune candidate gene or region. Interestingly, none of the six large peaks for AITD recur in Figure 1B, suggesting that genes that cause susceptibility to Tab in AITD patients can be different from genes that increase risk of AITD in the presence of Tab.
Tab→AITD analysis revealed two new peaks (Figure 1C) on 4q32 and 10p12 and produced a substantially higher PPL over the original AITD peak on 8q24. Again, it appears that genes that regulate quantitative levels of Tab can be distinct from both genes conferring susceptibility to AITD and genes determining susceptibility to the presence or absence of Tab.
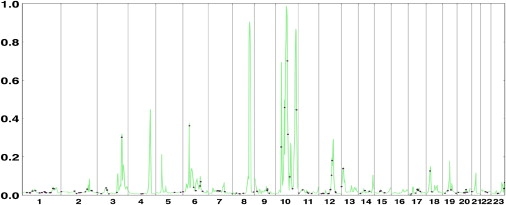
We then rescanned the genome for epistatic interactions involving CTLA4. Interestingly, this analysis did not detect any loci unseen in baseline analyses. However, three of the loci detected at baseline show substantial evidence of interaction with CTLA4 (10q21, 10q26 under the AITD model, and 8q24 under the Tab→AITD model), indicating that genetic effects at these loci are subject to modification by the CTLA4 genotype (Figure 2).
Figure 2.
Locations of CTLA4 Interactors, Detected by Epistasis Analysis, for AITD, Tab, and Tab→AITD
(A) Locations of CTLA4 interactors for AITD.
(B) Locations of CTLA4 interactors for Tab.
(C) Locations of CTLA4 interactors for Tab→AITD.
The x axis represents the genome in Kosambi cM units for chromosomes 1- X. The y axis shows E-PPL (epistasis) minus baseline PPL (no epistasis) at each position; thus, the scale of the y axis differs from that of Figure 1. Because the E-PPL involves integration over the full parameter space, including both “epistasis” and “no epistasis” models, this difference will be > 0 in the presence of evidence supporting epistasis and < 0 in the presence of evidence against epistasis, with the magnitude of the difference (positive or negative) indicating the relative strength of evidence for or against interaction with CTLA4. Note that PPL differences have been set to equal 0 (no evidence for or against epistasis) over the region containing CTLA4 itself.
Along with PPLs, Kelvin also reports the maximizing (maximum likelihood) trait model. Caveats apply when one interprets the numerical values of parameters estimated in this way (including the fact that consideration of only the point estimates themselves might obscure dimensions in which the surface is essentially flat, as well as more arcane issues27). However, all other things being equal, this constitutes a statistically rigorous (approximating) procedure for estimation of trait parameters.28–31 We took advantage of this feature to examine the epistasis results in more detail.
We had anticipated that epistasis at the interacting loci (8q24, 10q21, and 10q26) would confirm G as the risk-conferring allele, consistent with the association data from our group and others. This would manifest itself as increased genotypic relative risk (in the case of the dichotomous ATID model) among carriers of both the G allele and the high-risk genotype(s) at an interacting locus or as corresponding increases in the differences between genotypic means (in the case of the quantitative Tab→AITD model). Table 1 shows effect-size estimates for each of these loci. On 8q24 and 10q26, AA individuals have no increase or only a very slight increase in estimated risk even when they carry the high-risk 8q24 genotypes or the high risk 10q26 genotypes. By contrast, the combination of the D allele and the G CTLA4 allele produces dramatic phenotypic effects at both loci. (Note that when the penetrance for dd individuals is estimated to be 0, the genotypic relative risk is undefined, or effectively infinite.) Thus, for these two loci, the G allele does appear to be the risk-conferring allele.
Table 1.
Effect of CTLA4 Genotypes on Relative Risks at Interacting Loci
|
Genotype at CTLA4: GG/GA |
Genotype at CTLA4: AA |
|||
|---|---|---|---|---|
| Locus | Genotype at Locus: DD | Genotype at Locus: Dd | Genotype at Locus: DD | Genotype at Locus: Dd |
| 8q24 | 15∗ | 5∗ | 0 | 0 |
| 10q21 | 4 | 1 | ∞∗ | 1 |
| 10q26 | ∞∗ | ∞∗ | 2 | 2 |
For the AITD model (10q21 and 10q26), the effect size is estimated as the ratio of the penetrance for DD or Dd individuals, respectively, to the penetrance in dd individuals, where DD etc. are the unobserved disease genotypes at the locus in question. A risk ratio of ∞ indicates that the estimated penetrance for the dd genotype was 0. For the Tab→AITD model (8q24), the effect size is estimated as the corresponding differences in genotypic means. These quantities are therefore not directly comparable between row 1 (differences in mean) and rows 2 and 3 (relative risks) of the table.
High-risk two-locus genotype.
However, on 10q21, carriers of the CTLA4 G allele and the DD risk genotype have at most a very modest estimated increase in risk, while CTLA4 AA homozygous individuals with the high risk 10q21 genotype are the ones at greatly increased risk of disease. Thus, notably, on 10q21 it is actually the AA CTLA4 genotype that increases risk.
It is also of interest to note the estimated threshold values under the Tab→AITD model: these are 23, 0.3, 23, and 8, on 3q27, 4q32, 8q24, and 10p12, respectively. The common clinical rule of thumb is that Tab ≥ 3 (Kronus units) represents a change in level of risk for AITD. However, if the threshold actually depends upon the specific combination of genes involved for any particular individual with AITD, then it should be possible to modify this rule on the basis of more specific knowledge of genetic architecture. This could illustrate a realistic type of application of personalized genomic medicine for many complex disorders.
In view of the known involvement of some PTP family genes in AITD, we also investigated whether any additional PTP genes localized to our PPL peaks. We conducted a GO-term search based on two Biomart builds because the annotations between these databases are not synchronized. From a list of GO terms associated with both PTPN2 and PTPN22, we searched for “protein tyrosine phosphatase” (GO: 4725) and “phosphoric monoester hydrolase activity” (GO:16791). Between the two databases, a total of 246 unique genes were identified; however, after restriction of the list to independently annotated genes common to both databases, just 120 genes remain. Figure 3 shows the locations of these genes superimposed on a summary PPL plot. We also include PLD1 (3q27) and GPLD1 (6p22) (which each appear in one of the two databases), because the activity of CTLA4 has been demonstrated to be dependent on phospholipase D activity.32
Figure 3.
All Detected PTP-Related Genes, Shown as Individual Dots, Superimposed on a Summary PPL Graph
For summary purposes, each chromosome is plotted under the phenotypic model that maximizes the PPL on that chromosome; for chromosome 10, because there are multiple peaks maximizing under different phenotypic models, the plot is based on the models that maximize the PPL within each of four segments of the chromosome.
Intriguingly, several of the PPL peaks coincide with genes from the PTP superfamily. Although this is far from conclusive, we view these PTP genes as prime candidate genes for additional study.
Table 2 contains a summary of salient results. Here, we list all loci with PPL > 25% (corresponding in some sense to p values < 0.0009). We have also included 2q33 and 18p11, which were picked up under the Tab model. From a biological perspective, given the model under which we detect them, these peaks might be anticipated to contain genes relating to general immune response and therefore to be relatively nonspecific to AITD. This would tend to make effect sizes in the AITD sample (and, perhaps, in general) relatively small and more difficult to detect. Indeed, there is strong prima facie support for this conjecture on 2q33 (over CTLA4), if not also on 18p11.6
Table 2.
Summary of Salient Results
| Chromosome | Position (cM) | PPL (%)∗ | Phenotypic Model | Closest PTP-Related Gene∗∗ |
|---|---|---|---|---|
| 2q33 | 218 | 8 | Tab | CTLA4 at 215 cM |
| 3q27 | 190 | 32 | Epistasis Tab→AITD | PLD1 at 187.7 cM |
| 5p14 | 47 | 28 | AITD | — |
| 4q32 | 172 | 44 | Tab→AITD | — |
| 6p22 | 50 | 38 | Tab | GPLD1 at 50 cM |
| 8q24 | 132 | 90 | Epistasis Tab→AITD | — |
| 10p12 | 44 | 69 | Tab→AITD | PTPLA at 42.4 cM |
| 10q11 | 69 | 52 | AITD | PTPN20B at 67 cM |
| 10q21 | 82 | 98 | Epistasis AITD | KIAA1274 at 88.9 cM |
| 10q26 | 156 | 86 | Epistasis AITD | PTPRE at 159.8 cM |
| 12q23 | 113 | 28 | AITD | — |
| 18p11 | 36 | 14 | Tab | PTPRM at 29.6 cM; IMPA2 at 42.6 cM∗∗∗ |
The PPL is on the probability scale and has a direct interpretation as the probability of a gene for the specified phenotype at a particular location given the data at hand. Note also that PPLs reported here for the epistasis models are the actual E-PPLs rather than the differences (E-PPL − PPL) plotted in Figure 2.
Also of potential interest from the GO-term search are MTMR6, which is visible in Figure 3 over the small peak on chromosome 13 (at 14 cM); and DUSP6, near a secondary peak of 24% on chromosome 12 at 102 cM.
An association to PTPN2, also in 18p11, has been found with both Type 1 diabetes and AITD.5
Assembling these results into a unifying model (Figure 4), we begin to see an outline of the CTLA4-related genetic architecture of AITD as a complex interplay among multiple genes, with distinct genes for each of the three phenotypic models. Thus, clinical AITD appears to be the result of “hits” along (at least) three separate genetic paths: a genetic susceptibility to AITD; a predisposition to develop the autoantibodies characteristic of AITD; and a propensity to develop high levels of Tab once disease development begins. Superimposed upon this collection of genes are interactions across phenotypic categories. For instance, CTLA4 itself appears to regulate propensity to develop Tab (Y or N), while interacting with both genes that predispose one to AITD and genes that regulate quantitative levels of Tab.
Figure 4.
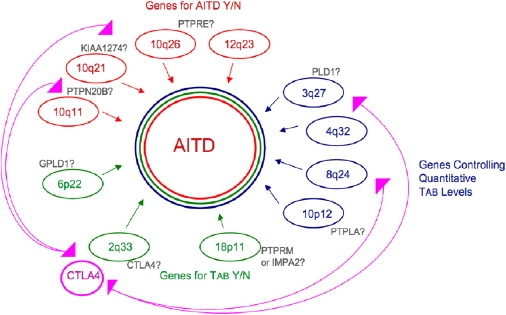
Preliminary Model of CTLA4 Mediation of the Genetic Architecture of AITD
Perhaps of most immediate relevance to other complex disorders is the finding that it is not only the associated CTLA4 G allele that is risk-conferring but, against certain specific genetic backgrounds, it can apparently be the A allele that is deleterious. The consistent association with G in population studies is, then, presumably due to the higher prevalence of those interacting factors for which G rather than A is the deleterious variant (or, possibly, in strong disequilibrium with a separate deleterious variant), but the relative prevalence of interacting factors is a matter of population history and structure rather than of underlying biology. Thus, even within the same gene, different alleles at a single SNP might be associated with risk in different subsets of patients. These findings are relevant to the wealth of new associations being detected by genome-wide association studies.
Identification of these subsets will be essential for the design of targeted treatments based on the immunogenetic mechanisms causing disease. Therapies targeted to alteration of the disregulated immunological pathways associated with the G allele would be beneficial in some patients, but they could be harmful or ineffective in those patients whose disease is associated with the A allele. Indeed, genetic background is emerging as a significant factor affecting efficacy of therapeutic modalities in several conditions, such as hypertension.33 These findings not only suggest a new line of research into the role of CTLA4 in autoimmune disease but, also, suggest that associations based on aggregate data at the population level should be interpreted with care before being merged into clinical practice. This also illustrates that differences in population history can change which of the two SNP alleles is the associated allele at a true disease locus, a possibility to keep in mind when interpreting replication studies.
It is still unclear whether the other known AITD-related genes (TSHR, CD40, and HLA itself) form a part of the same pathway diagrammed in Figure 4 or whether they participate in independent pathways leading to the AITD phenotype under an expanded “locus heterogeneity” model in which each component of the model is actually a separate network of genes rather than an independently operating single locus. Full exploration of this possibility will require the modeling of interactions among more than two loci at a time. In principle this requires only a trivial extension of the current PPL framework. However, at present it remains a challenge on purely computational grounds. This will be a major focus of our further computational developments. It also remains to be seen whether typical human data sets will carry enough information on higher-order interactions to be useful or whether the search for genetic architecture at that level of complexity will require recourse to model organisms.
Even though the particulars of our proposed model await molecular confirmation, it seems clear to us from the present study that considerable information regarding complex genetic architecture can be recovered from human data sets under the right circumstances. These circumstances will include measurement and modeling of sets of related phenotypes; incorporation of allelic associations and linkage information into unified analyses; and, as bioinformatics resources continue to develop, supplementation of statistical modeling with bioinformatically obtained information about gene networks and pathways.
Acknowledgments
This work was supported by National Institutes of Health grants DK61659, DK067555, and DK073681 to Y.T., DK052464 and DK069713 to T.F.D., and by the Research & Development Core of the Battelle Center for Mathematical Medicine at the Research Institute at Nationwide Children's Hospital.
Web Resources
The URLs for data presented herein are as follows:
Rutgers combined genetic map, http://compgen.rutgers.edu/mapopmat
Biomart, http://www.ensembl.org/biomart/index.html and http://www.biomart.org
Online Mendelian Inheritance in Man (OMIM), http://www.ncbi.nlm.nih.gov/OMIM/.
References
- 1.Jacobson E.M., Tomer Y. The CD40, CTLA-4, thyroglobulin, TSH receptor, and PTPN22 gene quintet and its contribution to thyroid autoimmunity: back to the future. J. Autoimmun. 2007;28:85–98. doi: 10.1016/j.jaut.2007.02.006. [DOI] [PMC free article] [PubMed] [Google Scholar]
- 2.Tomer Y., Ban Y., Concepcion E., Barbesino G., Villanueva R., Greenberg D.A., Davies T.F. Common and unique susceptibility loci in Graves and Hashimoto diseases: results of whole-genome screening in a data set of 102 multiplex families. Am. J. Hum. Genet. 2003;73:736–747. doi: 10.1086/378588. [DOI] [PMC free article] [PubMed] [Google Scholar]
- 3.Tomer Y., Davies T.F. Searching for the autoimmune thyroid disease susceptibility genes: from gene mapping to gene function. Endocr. Rev. 2003;24:694–717. doi: 10.1210/er.2002-0030. [DOI] [PubMed] [Google Scholar]
- 4.Hodge S.E., Ban Y., Strug L.J., Greenberg D.A., Davies T.F., Concepcion E.S., Villanueva R., Tomer Y. Possible interaction between HLA-DRbeta1 and thyroglobulin variants in Graves' disease. Thyroid. 2006;16:351–355. doi: 10.1089/thy.2006.16.351. [DOI] [PubMed] [Google Scholar]
- 5.Todd J.A., Walker N.M., Cooper J.D., Smyth D.J., Downes K., Plagnol V., Bailey R., Nejentsev S., Field S.F., Payne F. Robust associations of four new chromosome regions from genome-wide analyses of type 1 diabetes. Nat. Genet. 2007;39:857–864. doi: 10.1038/ng2068. [DOI] [PMC free article] [PubMed] [Google Scholar]
- 6.Welcome Trust Case Control Consortium Genome-wide association study of 14,000 cases of seven common diseases and 3,000 shared controls. Nature. 2007;447:661–678. doi: 10.1038/nature05911. [DOI] [PMC free article] [PubMed] [Google Scholar]
- 7.Kavvoura F.K., Akamizu T., Awata T., Ban Y., Chistiakov D.A., Frydecka I., Ghaderi A., Gough S.C., Hiromatsu Y., Ploski R. Cytotoxic T-lymphocyte associated antigen 4 gene polymorphisms and autoimmune thyroid disease: a meta-analysis. J. Clin. Endocrinol. Metab. 2007;92:3162–3170. doi: 10.1210/jc.2007-0147. [DOI] [PubMed] [Google Scholar]
- 8.Maier L.M., Anderson D.E., De Jager P.L., Wicker L.S., Hafler D.A. Allelic variant in CTLA4 alters T cell phosphorylation patterns. Proc. Natl. Acad. Sci. USA. 2007;104:18607–18612. doi: 10.1073/pnas.0706409104. [DOI] [PMC free article] [PubMed] [Google Scholar]
- 9.Abecasis G.R., Cherny S.S., Cookson W.O., Cardon L.R. Merlin–rapid analysis of dense genetic maps using sparse gene flow trees. Nat. Genet. 2002;30:97–101. doi: 10.1038/ng786. [DOI] [PubMed] [Google Scholar]
- 10.Huang, Y., Bartlett, C. W., Segre, A. M., O'Connell, J. R., Mangin, L., Vieland, V. J. (2007). Exploiting gene x gene interaction in linkage analysis. BMC Proceedings 1(Suppl 1):S64 (61–65). [DOI] [PMC free article] [PubMed]
- 11.Vieland V.J. Bayesian linkage analysis, or: how I learned to stop worrying and love the posterior probability of linkage. Am. J. Hum. Genet. 1998;63:947–954. doi: 10.1086/302076. [DOI] [PMC free article] [PubMed] [Google Scholar]
- 12.Vieland V.J. Thermometers: something for statistical geneticists to think about. Hum. Hered. 2006;61:144–156. doi: 10.1159/000093775. [DOI] [PubMed] [Google Scholar]
- 13.Kong X., Matise T.C. MAP-O-MAT: internet-based linkage mapping. Bioinformatics. 2005;21:557–559. doi: 10.1093/bioinformatics/bti024. [DOI] [PubMed] [Google Scholar]
- 14.Lander E.S., Green P. Construction of multilocus genetic linkage maps in humans. Proc. Natl. Acad. Sci. USA. 1987;84:2363–2367. doi: 10.1073/pnas.84.8.2363. [DOI] [PMC free article] [PubMed] [Google Scholar]
- 15.Matise T.C., Gitlin J.A. MAP-O-MAT: marker-based linkage mapping on the World Wide Web. Am. J. Hum. Genet. 2004;65:A435. [Google Scholar]
- 16.Smith C.A.B. Testing for heterogeneity of recombination fraction values in human genetics. Ann. Hum. Genet. 1963;27:175–182. doi: 10.1111/j.1469-1809.1963.tb00210.x. [DOI] [PubMed] [Google Scholar]
- 17.Logue M., Vieland V.J., Goedken R., Crowe R. Bayesian analysis of a previously published genome screen for panic disorder reveals new and compelling evidence for linkage to chromsome 7. Am. J. Med. Genet. B. Neuropsychiatr. Genet. 2003;121B:95–99. doi: 10.1002/ajmg.b.20072. [DOI] [PubMed] [Google Scholar]
- 18.Bartlett C.W., Flax J.F., Logue M.W., Smith B.J., Vieland V.J., Tallal P., Brzustowicz L.M. Examination of potential overlap in autism and language loci on chromosomes 2, 7, and 13 in two independent samples ascertained for specific language impairment. Hum. Hered. 2004;57:10–20. doi: 10.1159/000077385. [DOI] [PMC free article] [PubMed] [Google Scholar]
- 19.Logue M.W., Brzustowicz L.M., Bassett A.S., Chow E.W., Vieland V.J. A posterior probability of linkage-based re-analysis of schizophrenia data yields evidence of linkage to chromosomes 1 and 17. Hum. Hered. 2002;62:47–54. doi: 10.1159/000096035. [DOI] [PubMed] [Google Scholar]
- 20.Bartlett C.W., Vieland V.J. Two novel quantitative trait linkage analysis statistics based on the posterior probability of linkage: application to the COGA families. BMC Genet. 2005;6(Suppl 1):S121. doi: 10.1186/1471-2156-6-S1-S121. [DOI] [PMC free article] [PubMed] [Google Scholar]
- 21.Bartlett C.W., Vieland V.J. Accumulating quantitative trait linkage evidence across multiple datasets using the posterior probability of linkage. Genet. Epi. 2006;31:91–102. doi: 10.1002/gepi.20193. [DOI] [PubMed] [Google Scholar]
- 22.Elston R.C., Lange K. An approximation for the prior probability of autosomal linkage. Cytogenet. Cell Genet. 1975;14:290–292. doi: 10.1159/000130366. [DOI] [PubMed] [Google Scholar]
- 23.Vieland V.J., Hodge S.E. Review of Statistical Evidence: A Likelihood Paradigm. Am. J. Hum. Genet. 1998;63:283–289. [Google Scholar]
- 24.Edwards A. Johns Hopkins University Press; Baltimore: 1992. Likelihood. [Google Scholar]
- 25.Royall R. Chapman & Hall; London: 1997. Statistical Evidence: A likelihood paradigm. [Google Scholar]
- 26.Taper M., Lele S.R. Univ. Chicago Press; Chicago: 2004. The nature of scientific evidence. [Google Scholar]
- 27.Vieland V.J., Logue M. HLODs, trait models, and ascertainment: implications of admixture for parameter estimation and linkage detection. Hum. Hered. 2002;53:23–35. doi: 10.1159/000048601. [DOI] [PubMed] [Google Scholar]
- 28.Greenberg D.A. Inferring mode of inheritance by comparison of lod scores. Am. J. Med. Genet. 1989;34:480–486. doi: 10.1002/ajmg.1320340406. [DOI] [PubMed] [Google Scholar]
- 29.Elston R.C. Man bites dog? The validity of maximizing lod scores to determine mode of inheritance. Am. J. Med. Genet. 1989;34:487–488. doi: 10.1002/ajmg.1320340407. [DOI] [PubMed] [Google Scholar]
- 30.Ewens W.J., Shute N.C. A resolution of the ascertainment sampling problem. I. Theory. Theor. Popul. Biol. 1986;30:388–412. doi: 10.1016/0040-5809(86)90042-0. [DOI] [PubMed] [Google Scholar]
- 31.Vieland V.J., Hodge S.E. The problem of ascertainment for linkage analysis. Am. J. Hum. Genet. 1996;58:1072–1084. [PMC free article] [PubMed] [Google Scholar]
- 32.Mead K.I., Zheng Y., Manzotti C.N., Perry L.C., Liu M.K., Burke F., Powner D.J., Wakelam M.J., Sansom D.M. Exocytosis of CTLA-4 is dependent on phospholipase D and ADP ribosylation factor-1 and stimulated during activation of regulatory T cells. J. Immunol. 2005;174:4803–4811. doi: 10.4049/jimmunol.174.8.4803. [DOI] [PubMed] [Google Scholar]
- 33.Taylor A.L. The african american heart failure trial: a clinical trial update. Am. J. Cardiol. 2005;96(7B):44–48. doi: 10.1016/j.amjcard.2005.07.033. [DOI] [PubMed] [Google Scholar]