

Abstract
Androgenetic alopecia (AGA, male pattern baldness) is the most common form of hair loss. The origin of AGA is genetic, with the X chromosome located androgen receptor gene (AR) being the only risk gene identified to date. We present the results of a genome-wide linkage study of 95 families and linkage fine mapping of the 3q21-q29, 11q14-q25, 18p11-q23, and 19p13-q13 regions in an extended sample of 125 families of German descent. The locus with strongest evidence for linkage was mapped to 3q26 with a nonparametric linkage (NPL) score of 3.97 (empirical p value = 0.00055). This is the first step toward the identification of new susceptibility genes in AGA, a process which will provide important insights into the molecular and cellular basis of scalp hair loss.
Main Text
Androgenetic alopecia (AGA [MIM 109200]), or male pattern baldness, is a progressive patterned loss of hair from the scalp.1 The proportion of affected males increases steadily with age, so that a white 70-year-old male has an 80% chance of having some degree of AGA.1,2 Association of AGA with a variety of diseases has been reported, including coronary heart disease,3–5 hypertension,6 benign prostatic hyperplasia,7 obesity,8 prostate cancer,9,10 and disorders associated with insulin resistance.11,12 Although some associations remain controversial,13,14 the reported comorbidities underscore the value of understanding the molecular basis of AGA. Genetic disposition, which is assumed to be polygenic, plays the most substantial role in the development of AGA,15–18 and it is therefore surprising that no systematic approach has yet been undertaken to identify the contributing genes. Here, we present the results of a genome-wide linkage scan for AGA susceptibility loci in German families and a subsequent fine-mapping analysis of the four best linkage regions.
The genome scan was performed on 95 families where at least two brothers had early-onset AGA and both parents were available for the study (391 genotyped individuals including 201 affected men; 86 affected pairs of brothers, seven affected triplets, two affected quadruplets). All affected males were under 40 years of age (mean ± standard deviation [SD] age [in years] 32.0 ± 5.2) and had an AGA representative of the most severely affected 10% for the respective age class, as based on the classification of Hamilton,1 modified by Norwood.19 We collected ethylenediaminetetraacetic acid (EDTA) anticoagulated venous blood samples from all individuals, and isolated lymphocyte DNA by salting out procedure with saturated NaCl solution.20 The study was approved by the relevant ethics committees, and written informed consent was obtained from all participating individuals. All participants were of German descent.
The genome scan was conducted with procedures described by Lee and colleagues.21 The 391 DNA samples were genotyped for 540 autosomal and 37 X chromosomal short tandem repeat (STR) markers, with an average intermarker distance of 6.5 cM for the autosomes and 5.1 cM for the X chromosome (integrated Duffy's map).22 An average heterozygosity of 0.77 was observed. Data was cleaned with graphical representation of relationship errors (GRR)23 and PEDCHECK.24 Allele frequencies were estimated by a maximum-likelihood procedure with the program MENDEL v5.7.25 Single markers immediately flanked by a recombination on each side were identified with the ALLEGRO software, version 1.2,26 and genotypes were removed. Nonparametric linkage (NPL) analysis of the genome scan data was performed with the ALLEGRO software.
The genome-wide linkage analysis revealed nominal evidence of linkage (p < 0.05) to 14 chromosomal regions: 1q31-q32, 3q21-q27, 5p13-p15, 7q36, 8q13-q21, 8q24, 10p12-p14, 11q14-q24, 14q11, 16p12-p13, 18p11-q22, 19p13-q13, 21q21-q22, and Xp11-q25 (Table 1 and Figure 1). Xp11-q25 contains the AR gene, which has been shown to be associated with AGA27,28 and which can be considered the first known AGA gene. Four autosomal regions contained NPL scores greater than 2: 3q26 (NPL = 2.69 at 177.4 cM), 11q22 (NPL = 2.11 at 109.2 cM), 18q11 (NPL = 2.56 at 44.6 cM), and 19p13 (NPL = 2.06 at 20 cM).
Table 1.
Genome-wide Multipoint NPL Analysis, Regions with Nominal p Values Less than 0.05
| Chromosomal Region | Genomic Linkage Intervala [cM]b | Flanking STRs of Interval(NPL Score) | STR with Lowest p Value |
|||
|---|---|---|---|---|---|---|
| Name | Position [cM]b | NPL Score | p Value | |||
| 1q31-q32 | 199.8–213.5 | D1S518(1.6)–D1S1678(1.89) | D1S1660 | 207.3 | 1.9 | 0.029 |
| 3q21-q27 | 131.8–201 | D3S1267(1.3)–D3S3686(1.34) | D3S3053 | 177.4 | 2.69 | 0.0035 |
| 5p13-p15 | 15.9–64.9 | D5S2505(1.33)–D5S1457(1.21) | D5S1991 | 34.4 | 1.71 | 0.0349 |
| 7q36 | 168.1–182.3 | D7S3070(1.09)–D7S559(1.16) | D7S3058 | 176.4 | 1.65 | 0.0438 |
| 8q13-q21 | 81.4–99.7 | D8S1136(1.45)–D8S1119(1.76) | D8S1119 | 99.7 | 1.76 | 0.0396 |
| 8q24 | 151.1–157.2 | D8S256(1.24)–D8S272(1.94) | D8S272 | 157.2 | 1.94 | 0.0264 |
| 10p12-p14 | 19–43.1 | D10S189(1.31)–D10S1423(1.09) | D10S674 | 39.3 | 1.76 | 0.0398 |
| 11q14-q24 | 94.8–135.5 | D11S2632(1.01)–D11S4464(1.56) | D11S898 | 109.2 | 2.11 | 0.017 |
| 14q11 | 1.1–6.7 | D14S261(1.90)–D14S742(1.34) | D14S261 | 1.1 | 1.9 | 0.0291 |
| 16p12-p13 | 30.7–48 | D16S748(1.08)–D16S403(1.12) | D16S3036 | 43.4 | 1.7 | 0.0452 |
| 18p11-q22 | 14.61–93.1 | D18S976(1.01)–D18S1364(1.49) | D18S1104 | 44.6 | 2.56 | 0.0053 |
| 19p13-q13 | 20–93.7 | D19S1034(2.06)–D19S589(1.79) | D19S1034 | 20 | 2.06 | 0.0199 |
| 21q21-q22 | 7.2–45.2 | D21S1432(1.47)–D21S1440(1.02) | D21S1437 | 16.5 | 1.9 | 0.0293 |
| Xp11-q25 | 72.6–124.7 | DXS1003(1.01)–GATA165B12(1.75) | DXS8067 | 122.3 | 2.67 | 0.0039 |
With NPL score greater than 1.
Duffy's integrated map.
Figure 1.
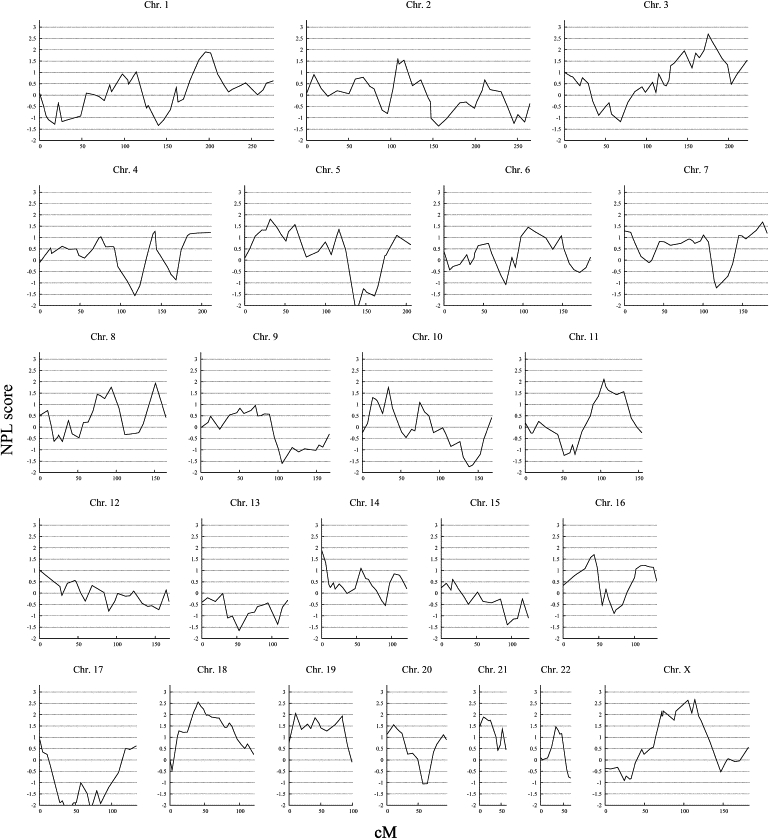
Genome-wide Linkage Analysis of 95 Families with Early-Onset AGA
The multipoint NPL score is shown on the vertical axis, and the distance (in cM, Duffy's integrated map) is given on the horizontal axis.
To define the chromosomal regions for the fine-mapping linkage study, we applied a MOD-score analysis to the four autosomes with NPL scores greater than 2. In this, the parametric LOD score is maximized with respect to the trait-model parameters. We used the program GENEHUNTER-MODSCORE,29 which calculates MOD scores by varying the disease-allele frequency and penetrances. We performed the analysis with a starting model of 0.08 for susceptibility allele frequency and the penetrances of 0.001, 0.5, and 0.99. The procedure yields the MOD score in conjunction with the best-fitting penetrance and disease-allele frequency at each genetic position of a prespecified grid. The parameters can be considered an effect estimate for the particular locus. The MOD-score analysis further supported the findings of the nonparametric analysis with LOD scores of 3.4 on 3q26, 2.5 on 11q22, 2.7 on 18q11, and 2.4 on 19p13 (Figure 2).
Figure 2.
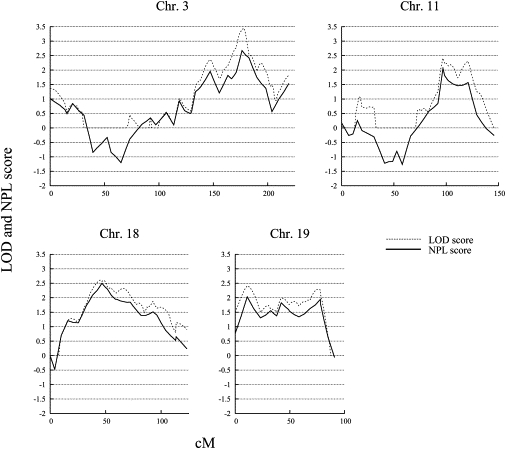
MOD-Score Analysis of Four Chromosomes
Analysis of chromosomes 3, 11, 18, and 19 was performed in 95 families with early-onset AGA. The multipoint LOD and NPL scores are shown on the vertical axis, and the distance (in cM, Duffy's integrated map) is given on the horizontal axis. Dotted lines indicate LOD scores, and solid lines indicate NPL scores.
For fine-mapping analysis, the borders of the regions were defined by a LOD score greater than 1. A total of 169 STR markers located within these regions were analyzed by deCODE Genetics, with procedures described elsewhere.30 Because of the use of pre-established marker panels, these STR markers included eight markers that had been included previously in the genome-wide scan. Including all genome-scan markers located in the fine-mapping regions, the distribution of STRs was as follows: chromosome 3q21-q29, interval D3S1269–D3S3550 (132.9–227 cM), 71 STRs, average intermarker distance 1.3 cM; chromosome 11q14-q25, interval D11S4147–D11S4125 (95.4–160.3 cM), 29 STRs, average intermarker distance 2.3 cM; chromosome 18p11-q23, interval D18S344–D18S70 (16–124.7 cM), 76 STRs, average intermarker distance 1.4 cM; chromosome 19p13-q13, interval D19S247–D19S544 (9.9–107.2 cM), 43 STRs, average intermarker distance 2.3 cM. One hundred twenty-five families, including the 95 families from the genome-wide study, were used for the fine-mapping study. The extended-family sample consisted of 516 genotyped individuals with 265 affected men in the younger generation. Data were analyzed according to the nonparametric genome-scan procedure. To determine robustness of the maximum NPL scores obtained with the fine-mapping data, we performed systematic simulations under the null hypothesis of no linkage. We generated 10,000 replicates with MERLIN, version 1.1-alpha3.31 Each replicate was generated under the assumption of random segregation, with identical pedigree structure, affection status, marker spacing, allele frequencies, and patterns of the missing data in the real data set. Each replicate was analyzed with MERLIN with computation of the Z mean score, which is equivalent to the NPL score in ALLEGRO. The empirical p value was calculated as the portion of all replicates showing an NPL score equal to or higher than the one observed in the real data set.
The results of the fine mapping are shown in Figure 3, and the STR markers with the highest NPL scores are listed in Table 2. On chromosome 3q21-q27, the inclusion of 55 additional STR markers in the analysis (compared to the genome-scan marker set) gave further support to this region with an NPL score of 3.14 (nominal p value = 0.0004, D3S1556) in the 95 families of the genome scan. This NPL score rose to 3.97 (nominal p value = 0.00003, D3S2425) when 30 families were added to the analysis (extended-family set), an observation supporting this as a true region of linkage. In the other fine-mapping regions, the addition of markers and families had only a small effect or even led to a decrease of NPL scores: In chromosomal region 11q22-q24, the addition of 21 STRs resulted in an NPL score of 2.55 (nominal p value = 0.0055, D11S1891) in 95 families and 1.87 (nominal p value = 0.0311, D11S1891) in 125 families; on chromosome 18p11-q22, the addition of 57 STRs resulted in an NPL score of 2.47 (nominal p value = 0.0068, D18S877) in 95 families and 1.97 (nominal p value = 0.0244, D18S1104) in 125 families; on chromosome 19p13-q13, the addition of 28 STRs resulted in an NPL score of 1.93 (nominal p value = 0.0273, D19S1034) and 2.19 (nominal p value = 0.0143, D19S921) in 95 families and 2.15 (nominal p value = 0.0157, D19S1034) and 1.95 (nominal p value = 0.0257, D19S921) in 125 families. D19S1034 and D19S921 are separated by 73.7 cM and might be considered as markers of independent regions. Of the four fine-mapping regions, only chromosome 3q26 showed simulation-based genome-wide significance with an empirical p value of 0.00055 (Table 2). The absence of simulation-based significance of chromosomes 11q22-q24, 18p11-q22, and 19p13-q13 does not rule out that genes that contribute to the development of AGA are present at these loci. The relevance of these regions for AGA susceptibility has to be investigated in larger samples.
Figure 3.
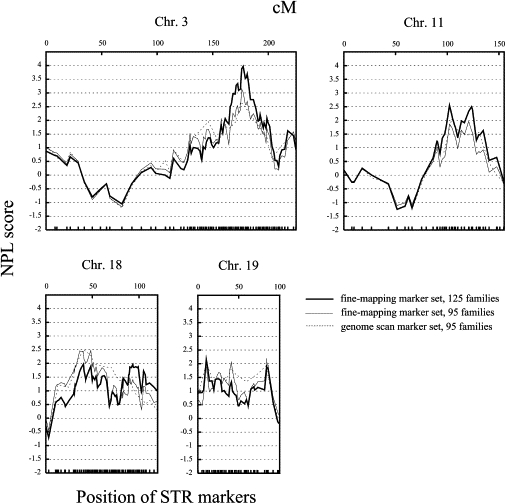
Fine-Mapping Linkage Analysis of Four Chromosomal Regions
The multipoint NPL score is shown on the vertical axis and the distance (top; in cM, Duffy's integrated map) and positions of the fine-mapping STR markers (bottom) on the horizontal axis. Dashed lines indicate NPL scores of the genome scan, thin lines indicate NPL scores of the fine-mapping marker set in families of the genome scan, and thick lines indicate NPL scores of the fine-mapping marker set in extended-family sample.
Table 2.
Multipoint NPL Fine-Mapping Analysis
| NPL Score (Nominal p Value) |
Empirical p Valuec |
||||
|---|---|---|---|---|---|
| Region and Position [cM]a | STR | Genome Scan, 95 Families | Fine Mapping, 95 Families | Fine Mapping, 125 Families | Fine Mapping, 125 Families |
| 3q26 | |||||
| 177.4 | D3S3053 | 2.67 (0.0038) | 2.58 (0.0049) | 3.32 (0.0004) | 0.00652 |
| 178.4 | D3S1556b | 3.14 (0.0004) | 3.88 (0.00005) | 0.00085 | |
| 179.7 | D3S2425b | 3.02 (0.0012) | 3.97 (0.00003) | 0.00055 | |
| 11q22 | |||||
| 107.1 | D11S1891b | 2.55 (0.0055) | 1.87 (0.0311) | n.s. | |
| 109.2 | D11S898 | 2.06 (0.0199) | 2.22 (0.0132) | 1.74 (0.0408) | n.s. |
| 18q11 | |||||
| 44.6 | D18S1104 | 2.5 (0.0063) | 2.44 (0.0075) | 1.97 (0.0244) | n.s. |
| 52.4 | D18S877 | 2.3 (0.0109) | 2.47 (0.0068) | 1.90 (0.0291) | n.s. |
| 19p13 | |||||
| 20 | D19S1034 | 2.03 (0.0213) | 1.93 (0.0273) | 2.15 (0.0157) | n.s. |
| 93.7 | D19S921 | 1.94 (0.026) | 2.19 (0.0143) | 1.95 (0.0257) | n.s. |
n.s. indicates not significant.
Duffy's integrated map.
Not present in the genome-scan marker set.
Genome-wide empirical p values based on 10,000 simulations.
In traits of complex inheritance, it is possible that two or more genes contributing to the development of the disease are functionally connected and interact epistatically. We therefore tested our genome-scan data for interaction between the X chromosomal region containing the AR gene locus and all autosomal loci. We applied a multipoint nonparametric interaction analysis according to the method described by Kong and Cox,32 with the use of proportional family weights.33 The procedure has been described in detail elsewhere.34 In brief, the NPL score of a given family at a given marker at the AR locus was used as a weighting factor for the same family, and a multipoint NPL analysis at an autosomal marker locus was performed. Only families with NPL scores greater than 0 at the AR locus were included for the interaction linkage analysis at the autosomal markers. At each autosomal marker of the genome, two NPL scores were determined: one unweighted, called the baseline NPL score, and one under the weighting scheme, called the interaction NPL score. The difference between these two NPL scores is termed ΔNPL score. To assess the significance of our interaction findings, we performed a permutation analysis. We randomly permuted the family weights for the X chromosomal markers in the region of the AR locus (eight markers) simultaneously to assess their contributions to the interaction NPL scores. For each X chromosomal and autosomal marker combination, 10,000 permutations were done, and for each combination, the permutation was followed by the calculation of the difference between the interaction NPL scores and the original NPL score (ΔNPL) under each weight. Permutation-based NPL scores that exceeded those from the original weighting procedure were counted and were then used for the determination of the significance of the findings.
We found no significant evidence for interaction between the AR locus and the autosomes for either the genome-wide or the fine-mapping data sets (Figure 4). This might suggest that the AGA susceptibility genes in autosomal regions showing evidence for linkage confer their risk through pathways other than the classical androgen pathway. However, the power to detect interaction is limited because only 54–56 families were included in the analysis (based on their NPL scores at the AR locus), and interaction cannot be ruled out with the current data set. Regions on several chromosomes show ΔNPLs between 1 and 2, compatible with effects that might only be detectable in larger family samples.
Figure 4.
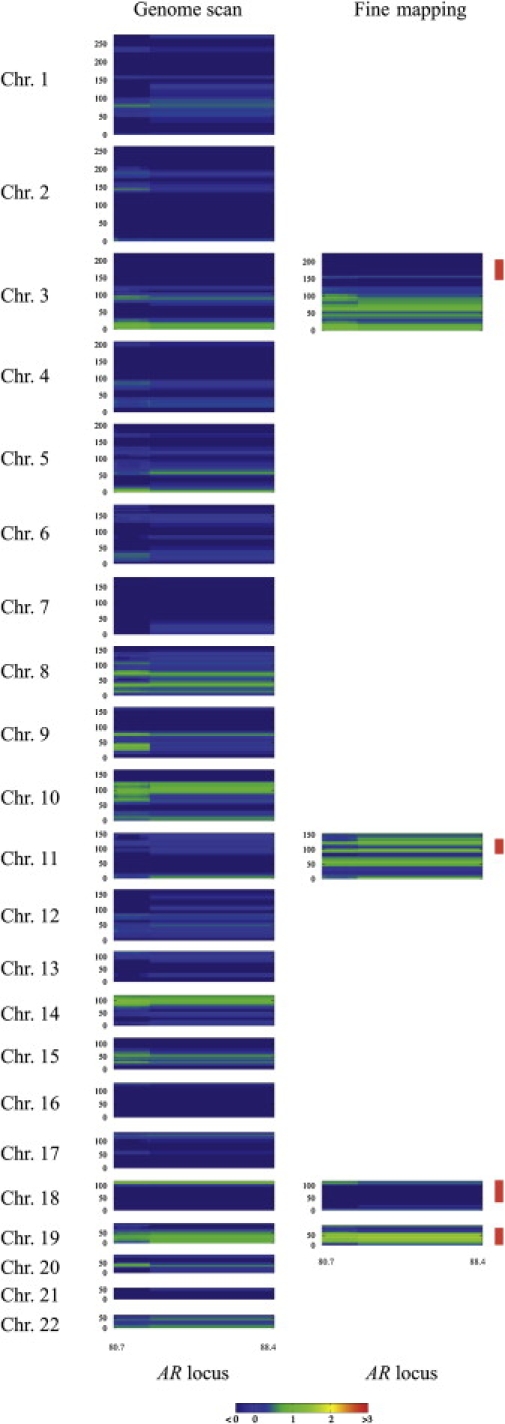
Interaction Scan for AGA between the AR Locus and the Autosomes
Boxes indicate the interaction between eight STR marker (DXS7132–DXS6800) spanning 8 cM around the AR gene on the horizontal axis in cM (Duffy's map) and the autosomal chromosomes, as indicated on the vertical axis in cM (Duffy's map). Fine-mapping linkage regions with NPL scores greater than 1 are indicated by red vertical bars. The various levels of ΔNPL scores are presented with different colors: Red indicates ΔNPL scores of at least 3, yellow indicates ΔNPL scores of 2, green indicates ΔNPL scores of 1, blue indicates ΔNPL scores of no more than 0.
The identification of 14 regions with nominal evidence of linkage reflects and supports the opinion that AGA is caused by multiple genes. The data provide strong evidence for the existence of an AGA susceptibility locus on 3q26. The 11.5 Mb core region with NPL scores greater than 3 (flanking STR markers D3S1763 and D3S3730) bears 34 reference sequence genes (University of California, Santa Cruz genome browser, build 36) that will be the target of future association-based studies. Among the transcripts are no genes known to be involved in hair biology, and the best candidates might be genes which have been implicated in AGA-associated diseases. The growth hormone secretagogue receptor gene (GHSR), for example, has been previously associated with obesity.35 Another interesting candidate is TERC, which encodes the telomerase RNA component. Mutations in TERC and the knockout of the mouse homolog are well known to result in various aging phenotypes.36–38 Because AGA is an age-correlated trait, variability in genes modulating the process of aging might have an impact on AGA susceptibility.
In contrast to the AR gene located on the X chromosome,27,28 the autosomal location of the AGA susceptibility loci of the present study might explain the resemblance of fathers and sons with respect to the development of AGA.15,16 Because AGA also occurs in females (female pattern hair loss), future studies will need to investigate whether the loci implicated in the present study have a similar effect in affected females. In conclusion, our data are the first step toward the identification of new genes contributing to the development of early onset AGA, a process which will contribute to the understanding of human hair biology.
Acknowledgments
We thank all participants for consenting to the study and providing blood samples. We are grateful to Kathrin Saar for valuable support in high-throughput marker analysis and to Françoise André, Ingelore Bäßmann, Heike Fischer, Nadine Wittstruck, and Madeleine Skorna (Berlin or Cologne) for excellent technical assistance. This study was supported by a grant from the Deutsche Forschungsgemeinschaft (DFG) to M.M.N. and R.K. (FOR 423 “Genetic epidemiology and medical genetics of complex diseases,” Projects B2, D2, Q1, and Q2) and by a grant from the Alfried Krupp von Bohlen und Halbach-Stiftung to M.M.N. R.C.B. is a recipient of an Emmy Noether fellowship of the DFG.
Web Resources
The URLs for data presented herein are as follows:
Duffy's master map, http://www.qimr.edu.au/davidD/Duffy_unifiedmap2005.html (for integrated genetic map)
Online Mendelian Inheritance in Man (OMIM), http://www.ncbi.nlm.nih.gov/Omim/
UCSC Genome Bioinformatics, http://genome.ucsc.edu/ (for gene information)
References
- 1.Hamilton J.B. Patterned loss of hair in man; types and incidence. Ann. N Y Acad. Sci. 1951;53:708–728. doi: 10.1111/j.1749-6632.1951.tb31971.x. [DOI] [PubMed] [Google Scholar]
- 2.Birch M.P., Messenger A.G. Genetic factors predispose to balding and non-balding in men. Eur. J. Dermatol. 2001;11:309–314. [PubMed] [Google Scholar]
- 3.Herrera C.R., D'Agostino R.B., Gerstman B.B., Bosco L.A., Belanger A.J. Baldness and coronary heart disease rates in men from the framingham study. Am. J. Epidemiol. 1995;142:828–833. doi: 10.1093/oxfordjournals.aje.a117722. [DOI] [PubMed] [Google Scholar]
- 4.Lotufo P.A., Chae C.U., Ajani U.A., Hennekens C.H., Manson J.E. Male pattern baldness and coronary heart disease: The physicians' health study. Arch. Intern. Med. 2000;160:165–171. doi: 10.1001/archinte.160.2.165. [DOI] [PubMed] [Google Scholar]
- 5.Matilainen V.A., Mäkinen P.K., Keinänen-Kiukaanniemi S.M. Early onset of androgenetic alopecia associated with early severe coronary heart disease: A population-based, case-control study. J. Cardiovasc. Risk. 2001;8:147–151. doi: 10.1177/174182670100800305. [DOI] [PubMed] [Google Scholar]
- 6.Ahouansou S., Le Toumelin P., Crickx B., Descamps V. Association of androgenetic alopecia and hypertension. Eur. J. Dermatol. 2007;17:220–222. doi: 10.1684/ejd.2007.0152. [DOI] [PubMed] [Google Scholar]
- 7.Hawk E., Breslow R.A., Graubard B.I. Male pattern baldness and clinical prostate cancer in the epidemiologic follow-up of the first national health and nutrition examination survey. Cancer Epidemiol. Biomarkers Prev. 2000;9:523–527. [PubMed] [Google Scholar]
- 8.Hirsso P., Rajala U., Hiltunen L., Jokelainen J., Keinänen-Kiukaanniemi S., Näyhä S. Obesity and low-grade inflammation among young Finnish men with early-onset alopecia. Dermatology. 2007;214:125–129. doi: 10.1159/000098570. [DOI] [PubMed] [Google Scholar]
- 9.Oh B.R., Kim S.J., Moon J.D., Kim H.N., Kwon D.D., Won Y.H., Ryu S.B., Park Y.I. Association of benign prostatic hyperplasia with male pattern baldness. Urology. 1998;51:744–748. doi: 10.1016/s0090-4295(98)00108-3. [DOI] [PubMed] [Google Scholar]
- 10.Giles G.G., Severi G., Sinclair R., English D.R., McCredie M.R., Johnson W., Boyle P., Hopper J.L. Androgenetic alopecia and prostate cancer: Findings from an Australian case-control study. Cancer Epidemiol. Biomarkers Prev. 2002;11:549–553. [PubMed] [Google Scholar]
- 11.Matilainen V., Koskela P., Keinanen-Kiukaanniemi S. Early androgenetic alopecia as a marker of insulin resistance. Lancet. 2000;356:1165–1166. doi: 10.1016/S0140-6736(00)02763-X. [DOI] [PubMed] [Google Scholar]
- 12.Hirsso P., Laakso M., Matilainen V., Hiltunen L., Rajala U., Jokelainen J., Keinänen-Kiukaanniemi S. Association of insulin resistance linked diseases and hair loss in elderly men. Finnish population-based study. Cent. Eur. J. Public Health. 2006;14:78–81. doi: 10.21101/cejph.b0045. [DOI] [PubMed] [Google Scholar]
- 13.Ellis J.A., Stebbing M., Harrap S.B. Male pattern baldness is not associated with established cardiovascular risk factors in the general population. Clin. Sci. (Lond.) 2001;100:401–404. [PubMed] [Google Scholar]
- 14.Cooke N.T. Male pattern alopecia and coronary artery disease in men. Br. J. Dermatol. 1979;101:455–458. doi: 10.1111/j.1365-2133.1979.tb00026.x. [DOI] [PubMed] [Google Scholar]
- 15.Küster W., Happle R. The inheritance of common baldness: Two b or not two b? J. Am. Acad. Dermatol. 1984;11:921–926. doi: 10.1016/s0190-9622(84)80498-3. [DOI] [PubMed] [Google Scholar]
- 16.Ellis J.A., Stebbing M., Harrap S.B. Genetic analysis of male pattern baldness and the 5alpha-reductase genes. J. Invest. Dermatol. 1998;110:849–853. doi: 10.1046/j.1523-1747.1998.00224.x. [DOI] [PubMed] [Google Scholar]
- 17.Nyholt D.R., Gillespie N.A., Heath A.C., Martin N.G. Genetic basis of male pattern baldness. J. Invest. Dermatol. 2003;121:1561–1564. doi: 10.1111/j.1523-1747.2003.12615.x. [DOI] [PubMed] [Google Scholar]
- 18.Rexbye H., Petersen I., Iachina M., Mortensen J., McGue M., Vaupel J.W., Christensen K. Hair loss among elderly men: Etiology and impact on perceived age. J. Gerontol. A Biol. Sci. Med. Sci. 2005;60:1077–1082. doi: 10.1093/gerona/60.8.1077. [DOI] [PubMed] [Google Scholar]
- 19.Norwood O.T. Male pattern baldness: Classification and incidence. South. Med. J. 1975;68:1359–1365. doi: 10.1097/00007611-197511000-00009. [DOI] [PubMed] [Google Scholar]
- 20.Miller S.A., Dykes D.D., Polesky H.F. A simple salting out procedure for extracting DNA from human nucleated cells. Nucleic Acids Res. 1988;16:1215. doi: 10.1093/nar/16.3.1215. [DOI] [PMC free article] [PubMed] [Google Scholar]
- 21.Lee Y.A., Rüschendorf F., Windemuth C., Schmitt-Egenolf M., Stadelmann A., Nürnberg G., Ständer M., Wienker T.F., Reis A., Traupe H. Genomewide scan in german families reveals evidence for a novel psoriasis-susceptibility locus on chromosome 19p13. Am. J. Hum. Genet. 2000;67:1020–1024. doi: 10.1086/303075. [DOI] [PMC free article] [PubMed] [Google Scholar]
- 22.Duffy D.L. An integrated genetic map for linkage analysis. Behav. Genet. 2006;36:4–6. doi: 10.1007/s10519-005-9015-x. [DOI] [PubMed] [Google Scholar]
- 23.Abecasis G.R., Cherny S.S., Cookson W.O., Cardon L.R. Grr: Graphical representation of relationship errors. Bioinformatics. 2001;17:742–743. doi: 10.1093/bioinformatics/17.8.742. [DOI] [PubMed] [Google Scholar]
- 24.O'Connell J.R., Weeks D.E. Pedcheck: A program for identification of genotype incompatibilities in linkage analysis. Am. J. Hum. Genet. 1998;63:259–266. doi: 10.1086/301904. [DOI] [PMC free article] [PubMed] [Google Scholar]
- 25.Lange K., Cantor R., Horvath S., Perola M., Sabatti C., Sinsheimer J., Sobel E. Mendel version 4.0: A complete package for the exact genetic analysis of discrete traits in pedigree and population data sets. Am. J. Hum. Genet. 2001;69(Suppl):A1886. [Google Scholar]
- 26.Gudbjartsson D.F., Jonasson K., Frigge M.L., Kong A. Allegro, a new computer program for multipoint linkage analysis. Nat. Genet. 2000;25:12–13. doi: 10.1038/75514. [DOI] [PubMed] [Google Scholar]
- 27.Ellis J.A., Stebbing M., Harrap S.B. Polymorphism of the androgen receptor gene is associated with male pattern baldness. J. Invest. Dermatol. 2001;116:452–455. doi: 10.1046/j.1523-1747.2001.01261.x. [DOI] [PubMed] [Google Scholar]
- 28.Hillmer A.M., Hanneken S., Ritzmann S., Becker T., Freudenberg J., Brockschmidt F.F., Flaquer A., Freudenberg-Hua Y., Jamra R.A., Metzen C. Genetic variation in the human androgen receptor gene is the major determinant of common early-onset androgenetic alopecia. Am. J. Hum. Genet. 2005;77:140–148. doi: 10.1086/431425. [DOI] [PMC free article] [PubMed] [Google Scholar]
- 29.Strauch K., Fimmers R., Kurz T., Deichmann K.A., Wienker T.F., Baur M.P. Parametric and nonparametric multipoint linkage analysis with imprinting and two-locus-trait models: Application to mite sensitization. Am. J. Hum. Genet. 2000;66:1945–1957. doi: 10.1086/302911. [DOI] [PMC free article] [PubMed] [Google Scholar]
- 30.Björnsson Á., Gudmundsson G., Gudfinnsson E., Hrafnsdóttir M., Benedikz J., Skúladóttir S., Kristjánsson K., Frigge M.L., Kong A., Stefánsson K. Localization of a gene for migraine without aura to chromosome 4q21. Am. J. Hum. Genet. 2003;73:986–993. doi: 10.1086/378417. [DOI] [PMC free article] [PubMed] [Google Scholar]
- 31.Abecasis G.R., Cherny S.S., Cookson W.O., Cardon L.R. Merlin–rapid analysis of dense genetic maps using sparse gene flow trees. Nat. Genet. 2002;30:97–101. doi: 10.1038/ng786. [DOI] [PubMed] [Google Scholar]
- 32.Kong A., Cox N.J. Allele-sharing models: Lod scores and accurate linkage tests. Am. J. Hum. Genet. 1997;61:1179–1188. doi: 10.1086/301592. [DOI] [PMC free article] [PubMed] [Google Scholar]
- 33.Cox N.J., Frigge M., Nicolae D.L., Concannon P., Hanis C.L., Bell G.I., Kong A. Loci on chromosomes 2 (niddm1) and 15 interact to increase susceptibility to diabetes in mexican americans. Nat. Genet. 1999;21:213–215. doi: 10.1038/6002. [DOI] [PubMed] [Google Scholar]
- 34.Abou Jamra R., Fuerst R., Kaneva R., Orozco Diaz G., Rivas F., Mayoral F., Gay E., Sans S., González M.J., Gil S. The first genomewide interaction and locus-heterogeneity linkage scan in bipolar affective disorder: Strong evidence of epistatic effects between loci on chromosomes 2q and 6q. Am. J. Hum. Genet. 2007;81:974–986. doi: 10.1086/521690. [DOI] [PMC free article] [PubMed] [Google Scholar]
- 35.Baessler A., Hasinoff M.J., Fischer M., Reinhard W., Sonnenberg G.E., Olivier M., Erdmann J., Schunkert H., Doering A., Jacob H.J. Genetic linkage and association of the growth hormone secretagogue receptor (ghrelin receptor) gene in human obesity. Diabetes. 2005;54:259–267. doi: 10.2337/diabetes.54.1.259. [DOI] [PMC free article] [PubMed] [Google Scholar]
- 36.Herrera E., Samper E., Martín-Caballero J., Flores J.M., Lee H.W., Blasco M.A. Disease states associated with telomerase deficiency appear earlier in mice with short telomeres. EMBO J. 1999;18:2950–2960. doi: 10.1093/emboj/18.11.2950. [DOI] [PMC free article] [PubMed] [Google Scholar]
- 37.Rudolph K.L., Chang S., Lee H.W., Blasco M., Gottlieb G.J., Greider C., DePinho R.A. Longevity, stress response, and cancer in aging telomerase-deficient mice. Cell. 1999;96:701–712. doi: 10.1016/s0092-8674(00)80580-2. [DOI] [PubMed] [Google Scholar]
- 38.Garcia C.K., Wright W.E., Shay J.W. Human diseases of telomerase dysfunction: Insights into tissue aging. Nucleic Acids Res. 2007;35:7406–7416. doi: 10.1093/nar/gkm644. [DOI] [PMC free article] [PubMed] [Google Scholar]