

Abstract
Data from the Pharmacogenomics and Risk of Cardiovascular Disease (PARC) study and the Cardiovascular Health Study (CHS) provide independent and confirmatory evidence for association between common polymorphisms of the HNF1A gene encoding hepatocyte nuclear factor-1α and plasma C-reactive protein (CRP) concentration. Analyses with the use of imputation-based methods to combine genotype data from both studies and to test untyped SNPs from the HapMap database identified several SNPs within a 5 kb region of HNF1A intron 1 with the strongest evidence of association with CRP phenotype.
Main Text
High basal levels of C-reactive protein predict future cardiovascular disease and metabolic abnormalities in otherwise healthy adults. Several CRP gene (MIM 123260) polymorphisms are associated with plasma CRP concentration,1 but these account for only a small proportion of the 30%–50% reported heritability2,3 Whether polymorphisms within other regulatory genes account for interindividual variation in plasma CRP levels is largely unknown. We report the results of two genetic-association studies of CRP, the Pharmacogenomics and Risk of Cardiovascular Disease (PARC) study and the Cardiovascular Health Study (CHS). In both studies, procedures were conducted under institutionally approved protocols for work with human subjects.
The PARC study is a two-stage genome-wide association (GWA) study. In stage 1, 980 subjects were typed for 317,000 tagSNPs with the Illumina Human-1 BeadChip. In stage 2, 930 additional subjects were typed for a subset of 13,680 SNPs with the Illumina iSelect platform, as described in the Appendix. The PARC study participants were derived from two component studies, the Cholesterol and Atherosclerosis Pharmacogenetics (CAP)4 and the Pravastatin Inflammation/CRP Evaluation (PRINCE)5 studies. All subjects were of self-reported European ancestry. In both studies, CRP levels were determined with a clinically validated high-sensitivity assay.6 The current analyses are based on the combination of serial plasma CRP obtained at baseline and that obtained after 12 weeks of pravastatin treatment in PRINCE and at screening, after a two-week placebo run-in, and following four and six weeks of simvastatin treatment in CAP (see Appendix). CRP phenotype information is available for a total of 909 subjects in stage 1 and 773 in stage 2. Descriptive characteristics of the PARC study participants are summarized in Table 1.
Table 1.
PARC and CHS Participant Baseline Characteristics
| Characteristic | PARC stage 1 | PARC stage 2 | CHS |
|---|---|---|---|
| Number | 909 | 773 | 4,333 |
| Mean age (years) | 62 ± 14 | 63 ± 13 | 73 ± 6 |
| Female sex (%) | 32 | 25 | 57 |
| Current smokers (%) | 14 | 14 | 11 |
| Hormone replacement therapy use (%) | 3 | 1 | 6 |
| Body mass index (kg/m2) | 28.6 ± 5.3 | 28.8 ± 5.3 | 26.4 ± 4.5 |
| Total cholesterol (mg/dl) | 215 ± 37 | 215 ± 39 | 212 ± 39 |
| LDL cholesterol (mg/dl) | 132 ± 28 | 133 ± 31 | 130 ± 36 |
| HDL cholesterol (mg/dl) | 42 ± 14 | 40 ± 13 | 54 ± 16 |
| Triglycerides (mg/dl) | 182 ± 122 | 186 ± 125 | 144 ± 79 |
| CRP level (mg/l) | 0.89 ± 1.52 | 0.69 ± 1.27 | 3.4 ± 5.9 |
Data are presented as number (%) or mean ± standard deviation, unless otherwise indicated.
We tested each SNP for association with plasma CRP concentration by computing single-SNP log10(Bayes Factors or BFs) to quantify the strength of evidence for association.7 Bayes Factors have several advantages over p values in their assessment of evidence of an association.7,8 In particular, BF calculations take account of power, so that, unlike p values, proper interpretation of a BF does not depend on the size of the study, SNP minor-allele frequency, or other factors affecting power. To interpret a BF, the relationship “Posterior Odds = Prior Odds × BF” is helpful. For example, if 1 in 10,000 SNPs are genuinely associated with CRP (Prior Odds = 1:10,001), then a single-SNP log10(BF) of 5, 4, or 3 will result, respectively, in Posterior Odds of approximately 10:1, 1:1 and 1:10, which correspond to a 91%, 50%, and 9% chance of being a genuine association. (Naturally, different prior odds yield different probabilities of a genuine association, and the reader is free to substitute alternative prior odds. Note that the proportion of associations with a given p value that are genuine will also depend on the prior odds, but not in an easily specified way.)
The top nine SNPs [log10(BF) > +3] associated with plasma CRP concentration in the combined PARC phase 1 + phase 2 analysis are shown in Table 2. These include four SNPs located within ∼50 kb of the CRP gene on chromosome 1 and one SNP located on chromosome 19 in the 5′ flanking region of the APOE gene (MIM 107741). Two SNPs (rs7953249 and rs735396) were located on chromosome 12 in the region of the HNF1A gene (also known as TCF1 [MIM 142410]), which encodes the transcription factor hepatocyte nuclear factor (HNF)-1α. Analyses that controlled for potential within-Europe population structure with the use of principal-components analysis9 produced only slightly reduced Bayes Factors for these SNPs (data not shown), suggesting that these are not spurious associations due to population stratification. Further, the overall distribution of log10(BF) agreed well with its expectation under the null (Figure 1), suggesting that our results are not greatly affected by other potential sources of systematic bias.
Table 2.
SNPs with Strongest Evidence of Association with C-Reactive Protein in the PARC Combined Stage 1 and Stage 2 Genome-Wide Association Study
| rs Number | Chr. | Position | Gene | Number with Nonmissing Genotype and CRP Phenotype | Log10 Bayes Factor | p Value(Permutation) |
|---|---|---|---|---|---|---|
| rs2794520 | 1 | 157945440 | CRP | 1682 | 6.6 | < 1 × 10⁻⁷ |
| rs2075650 | 19 | 50087459 | APOE | 1678 | 5.7 | < 1 × 10⁻⁷ |
| rs2592887 | 1 | 157919563 | CRP | 1680 | 4.8 | < 1 × 10⁻⁷ |
| rs6481464 | 10 | 60790490 | FAM13C1 | 1682 | 3.9 | 2 × 10⁻⁶ |
| rs7953249 | 12 | 119888107 | HNF1A | 1681 | 3.5 | 4 × 10⁻⁶ |
| rs735396 | 12 | 119923227 | HNF1A | 1682 | 3.3 | 5 × 10⁻⁶ |
| rs12093699 | 1 | 157914612 | CRP | 1682 | 3.3 | 7 × 10⁻⁶ |
| rs11265260 | 1 | 157966663 | CRP | 1682 | 3.3 | 7 × 10⁻⁶ |
| rs7730843 | 5 | 36578069 | SLC1A3 | 1679 | 3.2 | 1.5 × 10⁻⁵ |
Figure 1.
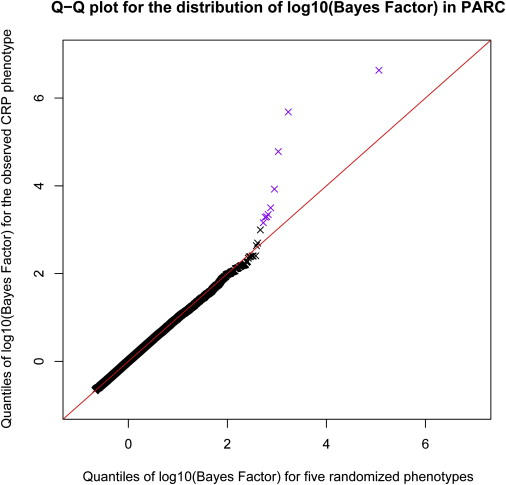
Distribution of Bayes Factors Associated with C-Reactive Protein in Stage 1 of PARC Genome-wide Association Study
A quantile-quantile plot comparing the distribution of log10(Bayes Factor) in the PARC study with the distribution under the null (generated by computation of the log10[Bayes Factor] for all SNPs for five random phenotype vectors, each obtained by randomly permutation of the original phenotypes across individuals). The red line indicates a straight line through the origin with unit slope. The color purple indicates the points that relate to the SNPs in Table 2.
Although the log10(BF) of 3.5 for the most strongly associated SNP in HNF1A (rs7953249) represents only modest evidence for association with CRP, independent confirmation of this finding was provided through a candidate-gene-based association analysis of 4333 European-descended participants 65 years and older from the Cardiovascular Health Study (CHS).10 Descriptive characteristics of the CHS participants are summarized in Table 1. In the CHS, 979 tagSNPs were typed across 132 candidate genes chosen on the basis of involvement in inflammation, aging, innate immunity, blood coagulation, and/or regulation of the acute-phase response, as described previously.11 Measurement of plasma CRP was performed at two time points: at study entry and during a follow-up examination that occurred three years after the baseline examination, with the use of a high-sensitivity enzyme-linked immunosorbent assay12 and an immunonephelometry (BN-II instrument, Dade-Behring, Deerfield, Ill), respectively. Both the enzyme-linked immunosorbent assay and the nephelometric assays were standardized according to the World Health Organization reference plasma and yield highly correlated values.
For the candidate-gene study in the CHS, we performed the analysis in two stages. For each gene, a “global” BF and a p value test of the null hypothesis of no association between any SNP in the candidate region were computed. If there was non-negligible evidence against the global null hypothesis for a particular candidate gene, we then computed single-SNP-specific BF and p values to summarize the evidence for which variants in the region are associated with plasma CRP levels. The CRP gene [log10(global BF) = +24.8], the APOE gene [log10(global BF) = +9.9] and the HNF1A gene [log10(global BF) = +7.7] showed the strongest evidence of association with CRP phenotype in the CHS (Table 3). Several other candidate genes had much weaker evidence for association with CRP (Table 3).
Table 3.
Global Bayes Factors for Candidate Genes Showing Strongest Evidence of Association with C-Reactive Protein in CHS
| Gene | Gene # | Chr. | Position | # SNPs Typed | Description | Log10 Bayes Factor | p Value (Permutation) |
|---|---|---|---|---|---|---|---|
| CRP | 1401 | 1 | 157,948,704–157,951,003 | 4 | C-reactive protein | 24.8 | < 1 × 10⁻⁶ |
| APOE | 348 | 19 | 50,100,879–50,104,489 | 2 | Apolipoprotein E | 9.9 | < 1 × 10⁻⁶ |
| HNF1A | 6927 | 12 | 119,900,932–119,924,695 | 8 | Transcription factor 1; hepatic nuclear factor (HNF)-1α | 7.7 | < 1 × 10⁻⁶ |
| PARP1 | 142 | 1 | 224,615,129–224,662,414 | 9 | Poly (ADP-ribose) polymerase family, member 1 | 0.7 | 0.012 |
| CEBPD | 1052 | 8 | 48,812,029–48,813,279 | 1 | CCAAT/enhancer binding protein delta | 0.7 | 0.016 |
| ATF3 | 467 | 1 | 210,848,617–210,860,737 | 15 | Activating transcription factor 3 | 0.5 | 0.012 |
| GP6 | 51206 | 19 | 60,216,887–60,241,444 | 8 | glycoprotein VI (platelet) | 0.4 | 0.017 |
| CPB2 | 1361 | 13 | 45,525,323–45,577,212 | 11 | Carboxypeptidase B2 | 0.3 | 0.016 |
| SP1 | 6667 | 12 | 52,060,246–52,096,493 | 5 | Sp1 transcription factor | 0.3 | 0.039 |
| IL6 | 3569 | 7 | 22,732,028–22,738,091 | 7 | Interleukin-6 | 0.3 | 0.021 |
| TIRAP | 114609 | 11 | 125,658,192–125,670,038 | 8 | Toll-interleukin 1 receptor (TIR) domain containing adaptor protein | 0.2 | 0.048 |
| F7 | 2155 | 13 | 112,808,106–112,822,995 | 5 | Coagulation factor VII | 0.2 | 0.046 |
| IL1RN | 3557 | 2 | 113,591,941–113,608,063 | 11 | Interleukin-1 receptor antagonist | 0.2 | 0.045 |
| F2 | 2147 | 11 | 46,697,331–46,717,631 | 7 | Coagulation factor II precursor | 0.2 | 0.042 |
| PROZ | 8858 | 13 | 112,860,969–112,874,695 | 31 | protein Z, vitamin K-dependent plasma glycoprotein | 0.1 | 0.034 |
| HMOX1 | 3162 | 22 | 34,107,087–34,120,194 | 8 | heme oxygenase (decycling) 1 | 0.1 | 0.034 |
| PNPT1 | 87178 | 2 | 55,715,971–55,774,463 | 9 | Polyribonucleotide nucleotidyltransferase 1 | 0.02 | 0.042 |
Global Bayes Factors test the null hypothesis of no association between any SNP in the candidate-gene region versus the alternative that one SNP is associated, and are given by the average of the single-SNP Bayes Factors in the region7.
Given that associations between the CRP gene1 or the APOE gene13,14 and CRP have been reported previously, we focused the current analysis on further characterization of the newly described association between the HNF1A genotype and the CRP phenotype. Five of the eight HNF1A SNPs typed in the CHS showed evidence of association (log10BF > +3.0 or p value < 0.00001) with CRP phenotype in the CHS (Table 4), including two common, nonsynonymous coding SNPs, rs1169288 (Ile27Leu) and rs2464196 (Ser486Asn). The strongest association was with rs1169310, which is located in the HNF1A 3′ untranslated region [log10(BF) = +8.6]. When adjusted for age, sex, clinic, body-mass index, and smoking status, each additional copy of the rs1169310 minor allele was associated with 0.13 (0.08 – 0.17) mg/l lower mean log(CRP) levels. Haplotype analysis of the eight HNF1A tagSNPs typed in the CHS showed that the minor alleles of rs1169288, rs1169286, rs2464196, and rs1169310 constitute a common haplotype (frequency 30%) associated with lower CRP levels (Table 5).
Table 4.
HNF1A SNPs Typed in CHS and their Associations with Plasma Log(CRP) Concentration
| rs # | Chr. 12 Coordinate | Location | Alleles | Minor-Allele Frequency | Number with Nonmissing Genotype and CRP Phenotype | Regression Coefficient (95% CI) | Single-SNP Bayes Factor Log(10) | Nominal p Value |
|---|---|---|---|---|---|---|---|---|
| rs1169288 | 119901033 | Exon 1 (Ile27Leu) | A/C | 0.28 | 4328 | −0.12 (−0.07 to −0.16) | +6.0 | 2.6 × 10⁻⁷ |
| rs1169286 | 119903439 | Intron 1 | T/C | 0.36 | 4332 | −0.10 (−0.06 to −0.15) | +4.8 | 1.6 × 10⁻⁶ |
| rs1169293 | 119910928 | Intron 1 | A/G | 0.11 | 4332 | −0.11 (−0.03 to 0.19) | +0.9 | 0.008 |
| rs12427353 | 119911284 | Intron 2 | G/C | 0.17 | 4333 | +0.09 (0.04 to 0.14) | +1.7 | 0.001 |
| rs2071190 | 119915655 | Intron 2 | T/A | 0.23 | 4333 | +0.04 (−0.01 to 0.09) | +1.0 | 0.16 |
| rs2464196 | 119919810 | Exon 7 (Ser486Asn) | G/A | 0.28 | 4329 | −0.11 (−0.06 to −0.16) | +6.3 | 1.9 × 10⁻⁶ |
| rs1169303 | 119920759 | Intron 7 | A/C | 0.47 | 4330 | −0.11 (−0.06 to −0.15) | +4.9 | 9.7 × 10⁻⁷ |
| rs1169310 | 119923816 | 3′ UTR | G/A | 0.38 | 4330 | −0.13 (−0.08 to −0.17) | +8.6 | 1.7 × 10⁻⁸ |
Estimates, 95%CI, and p-values were derived from single-SNP multiple linear regression models.
Regression coefficients estimate the increase/decrease in log(CRP) level per each additional copy of the minor allele, adjusted for age, sex, clinic, body mass index, and smoking.
Table 5.
HNF1A Haplotypes Estimated from Eight TagSNPs and their Associations with Plasma Log(CRP) Concentration in CHS
| HNF1A Haplotype | rs1169288 | rs1169286 | rs1169293 | rs12427353 | rs2071190 | rs2464196 | rs1169303 | rs1169310 | Frequency | Score Statistic | p Value |
|---|---|---|---|---|---|---|---|---|---|---|---|
| Haplotype 1 | 2 | 2 | 1 | 1 | 1 | 2 | 2 | 2 | 0.30 | −6.11 | < 1 × 10⁻⁵ |
| Haplotype 2 | 1 | 1 | 1 | 2 | 1 | 1 | 1 | 1 | 0.19 | 3.66 | 0.003 |
| Haplotype 3 | 1 | 1 | 1 | 1 | 1 | 1 | 1 | 1 | 0.15 | 2.24 | 0.03 |
| Haplotype 4 | 1 | 1 | 1 | 1 | 2 | 1 | 2 | 1 | 0.11 | 1.85 | 0.06 |
| Haplotype 5 | 1 | 2 | 1 | 1 | 2 | 1 | 1 | 1 | 0.10 | 1.99 | 0.05 |
| Haplotype 6 | 1 | 1 | 2 | 1 | 1 | 1 | 2 | 2 | 0.06 | −2.26 | 0.02 |
Presence of the major or minor allele at each SNP is indicated by the numbers 1 and 2, respectively. Only haplotypes having an estimated frequency of > 5% were included in the analysis. The global score statistic for the overall association of HNF1A haplotypes and CRP was 52.6 (p value = 1 × 10⁻⁹).
We used the imputation-based method of Servin and Stephens7 to combine typed SNP-genotype and CRP-phenotype data from the PARC study and the CHS with information on multimarker linkage disequilibrium (LD) from the HapMap and hence to assess the strength of evidence for phenotypic association with typed and untyped SNPs located within the chromosome 12 HNF1A region. Of 193 known SNPs encompassing a ∼200 kb region flanking the HNF1A gene, the strongest evidence for CRP phenotype association in the combined PARC + CHS sample consisted of a cluster of five “untyped” SNPs in perfect LD with one another (rs7310409, rs2393775, rs7979473, rs2393791, and rs7979478) located within a 5 kb region spanning the 3′ half of the HNF1A first intron (Figure 2 and Table 6). With the assumption that a single SNP is responsible for the observed association with plasma CRP levels, our analyses estimated > 99% posterior probability that the SNP is one of these five HNF1A intron 1 SNPs. However, there was considerable uncertainty about exactly which SNP is most likely to be responsible for the association, with all five single-SNP log10(BF)s in the range of +16.0 to +16.2. It is also possible that a non-HapMap SNP, in LD with these five SNPs, is responsible for the association. Sensitivity analyses involving HNF1A genotype imputation and regression performed separately in the PARC study and the CHS showed similar results (Table 6). The estimated pairwise LDs between each of the five intron 1 SNPs and the two nonsynonymous SNPs typed in the CHS were r2 = 0.62 for rs1169288 (Ile27Leu) and r2 = 0.54 for rs2464196 (Ser486Asn).
Figure 2.

Strength of Evidence for Association between HNF1A SNP and CRP Phenotype in PARC and CHS Combined
The vertical lines represent log10(Bayes Factors) (y axis) for each SNP in a ∼200 kilobase region encompassing the HNF1A gene on chromosome 12. SNPs are numbered according to chromosomal position on the x axis. The color of the vertical line indicates whether the SNP was directly observed in PARC (green), directly observed in CHS (red), directly observed in both PARC and CHS (pink), or indirectly observed by imputation from the HapMap (black). The gray shaded region demarcates the 5′ and 3′ boundaries of the HNF1A gene. Highlighted in yellow is the 5 kilobase region containing the five intron-1 SNPs showing the strongest evidence of association with CRP.
Table 6.
Bayesian Imputation-Based Association Analysis of HNF1A SNPs and Log(CRP) Concentration: Results from PARC, CHS, and Both Studies Combined
| PARC |
CHS |
CHS + PARC Combined |
|||||||
|---|---|---|---|---|---|---|---|---|---|
| rs # | Chr. 12 coordinate | Location | SNP Typed in PARC or CHS | Single-SNP BF Log(10) | p Value | Single-SNP BF Log(10) | p Value | Single-SNP BF Log(10) | p Value |
| rs7979473 | 119904643 | Intron 1 | +4.1 | < 1 × 10⁻⁶ | +11.1 | < 1 × 10⁻⁶ | +16.2 | < 1 × 10⁻⁶ | |
| rs7979478 | 119904646 | Intron 1 | +4.1 | < 1 × 10⁻⁶ | +11.1 | < 1 × 10⁻⁶ | +16.2 | < 1 × 10⁻⁶ | |
| rs2393791 | 119908339 | Intron 1 | +4.1 | < 1 × 10⁻⁶ | +11.0 | < 1 × 10⁻⁶ | +16.1 | < 1 × 10⁻⁶ | |
| rs7310409 | 119909244 | Intron 1 | +4.1 | < 1 × 10⁻⁶ | +11.0 | < 1 × 10⁻⁶ | +16.1 | < 1 × 10⁻⁶ | |
| rs2393775 | 119908957 | Intron 1 | +4.0 | < 1 × 10⁻⁶ | +11.0 | < 1 × 10⁻⁶ | +16.0 | < 1 × 10⁻⁶ | |
| rs10774579 | 119889593 | 5′ flank | +4.4 | < 1 × 10⁻⁶ | +7.8 | < 1 × 10⁻⁶ | +14.7 | < 1 × 10⁻⁶ | |
| rs7305618 | 119887315 | 5′ flank | +3.2 | < 1 × 10⁻⁶ | +6.4 | < 1 × 10⁻⁶ | +14.0 | < 1 × 10⁻⁶ | |
| rs7953249 | 119888107 | 5′ flank | PARC | +3.6 | < 1 × 10⁻⁶ | +9.3 | < 1 × 10⁻⁶ | +13.7 | < 1 × 10⁻⁶ |
| rs2464195 | 119919858 | Intron 7 | +3.3 | < 1 × 10⁻⁶ | +8.6 | < 1 × 10⁻⁶ | +13.3 | < 1 × 10⁻⁶ | |
| rs1169306 | 119922694 | Intron 9 | +3.1 | < 1 × 10⁻⁶ | +8.3 | < 1 × 10⁻⁶ | +13.2 | < 1 × 10⁻⁶ | |
| rs2259816 | 119919970 | Intron 7 | +3.3 | < 1 × 10⁻⁶ | +8.6 | < 1 × 10⁻⁶ | +13.0 | < 1 × 10⁻⁶ | |
| rs1169312 | 119925844 | 3′ UTR | +3.5 | < 1 × 10⁻⁶ | +8.5 | < 1 × 10⁻⁶ | +13.0 | < 1 × 10⁻⁶ | |
| rs1169310 | 119923816 | 3′ UTR | CHS | +3.3 | < 1 × 10⁻⁶ | +8.6 | < 1 × 10⁻⁶ | +12.9 | < 1 × 10⁻⁶ |
| rs735396 | 119923227 | Intron 9 | PARC | +3.3 | < 1 × 10⁻⁶ | +8.5 | < 1 × 10⁻⁶ | +12.8 | < 1 × 10⁻⁶ |
| rs1169313 | 119927053 | 3′ flank | +3.4 | < 1 × 10⁻⁶ | +8.3 | < 1 × 10⁻⁶ | +12.7 | < 1 × 10⁻⁶ | |
| rs1182933 | 119939005 | 3′ flank | +3.2 | < 1 × 10⁻⁶ | +7.5 | < 1 × 10⁻⁶ | +11.5 | < 1 × 10⁻⁶ | |
| rs11065385 | 119907769 | Intron 1 | +3.5 | < 1 × 10⁻⁶ | +7.4 | < 1 × 10⁻⁶ | +11.5 | < 1 × 10⁻⁶ | |
| rs1183910 | 119905190 | Intron 1 | +3.5 | < 1 × 10⁻⁶ | +7.5 | < 1 × 10⁻⁶ | +11.5 | < 1 × 10⁻⁶ | |
| rs2649999 | 119864927 | 5′ flank | +2.8 | < 1 × 10⁻⁶ | +6.5 | < 1 × 10⁻⁶ | +11.3 | < 1 × 10⁻⁶ | |
| rs2244608 | 119901371 | Intron 1 | +3.2 | < 1 × 10⁻⁶ | +6.8 | < 1 × 10⁻⁶ | +10.9 | < 1 × 10⁻⁶ | |
| Global test | – | – | +2.9 | 2 × 10⁻⁵ | +9.4 | < 1 × 10⁻⁶ | +14.5 | < 1 × 10⁻⁶ | |
CRP is produced primarily by hepatocytes, and its synthesis is largely under transcriptional control of various cytokines (interleukin [IL]-6 and IL-1β) and transcription-factor complexes, including CAAT enhancer binding protein and NF-κB.15 An HNF-1α binding site in the CRP gene promoter overlaps with a binding site for NFκB and is involved in the regulation of basal and constitutive CRP synthesis in the liver.16,17 Our combined evidence from two genetic-association studies shows that the HNF1A gene encoding HNF-1α is associated with plasma CRP concentration. Additional confirmatory evidence of the association between the HNF1A genotype and the CRP phenotype in a GWA analysis of over 6000 participants from the Women's Genome Health Study (WGHS) is provided in the accompanying article by Ridker et al.18 Notably, one of the five intron 1 ‘untyped’ SNPs identified as the strongest candidates for CRP phenotype association in the combined PARC and CHS analysis (rs7310409) was the typed HNF1A SNP most strongly associated with CRP in WGHS.18 This observation emphasizes the utility of imputation-based methods for the combination and comparing of results across studies that have typed different SNPs.
In addition to HNF1A, CRP, and APOE, three other genes (LEPR [MIM 601007], IL6R [MIM 147880], and GCKR [MIM 600842]) were reported to be associated with CRP in the accompanying article by Ridker et al. In our PARC GWA study, the log10(BF) for rs1260326 in GCKR was +1.3 (p = 0.005). The same GCKR SNP (rs1260326) or other GCKR SNPs in strong LD have been associated with serum triglycerides in recent GWA data from several groups,19 including PARC (R.M.K., personal communication). GCKR encodes a hepatic and pancreatic glucokinase regulatory protein, which regulates glucokinase (GCK [MIM 138079]), a susceptibility gene for maturity-onset diabetes of the young (MODY [MIM 606391]).20 Interestingly, rare mutations in HNF1A are also associated with MODY,21 and the HNF1A gene product HNF-1α is an important transcriptional regulator of a number of hepatic and pancreatic islet cell genes. Together, these observations suggest the possibility that CRP and metabolic phenotypes might, at least in part, be under coordinate genetic control. It is unclear whether our failure to find a strong genome-wide signal for CRP association at LEPR or IL6R in PARC (Table 7) reflects our smaller sample size or a genuine difference between the PARC results and the WGHS results. Nonetheless, there is prior evidence linking leptin and the leptin receptor to CRP.22
Table 7.
Evidence for Association between CRP and LEPR, IL6R, and GCKR SNPs Typed in PARC Genome-wide Association Study
| Gene | SNP | Chr. | Position | Number with Nonmissing Genotype and CRP Phenotype | Log10 Bayes Factor | p Value |
|---|---|---|---|---|---|---|
| LEPR | rs1892534 | 1 | 65878532 | 909 | −0.16 | 0.24 |
| rs2889195 | 1 | 65929318 | 909 | −0.26 | 0.35 | |
| rs2211651 | 1 | 65928609 | 908 | −0.22 | 0.31 | |
| rs12753193 | 1 | 65942267 | 909 | −0.22 | 0.26 | |
| rs2186245 | 1 | 65890652 | 909 | −0.35 | 0.76 | |
| rs12022410 | 1 | 65926521 | 909 | −0.02 | 0.12 | |
| rs7539471 | 1 | 65957991 | 909 | −0.18 | 0.23 | |
| rs4291477 | 1 | 65963663 | 909 | +0.12 | 0.06 | |
| rs4655537 | 1 | 65831389 | 908 | +0.24 | 0.05 | |
| IL6R | rs4129267 | 1 | 152692888 | 909 | +0.26 | 0.04 |
| GCKR | rs780094 | 2 | 27594741 | 909 | +0.16 | 0.06 |
| rs1260326 | 2 | 27584444 | 1678 | +1.3 | 0.005 | |
| rs1260333 | 2 | 27602128 | 906 | −0.20 | 0.27 |
In summary, we report an association between common variants of the HNF1A gene encoding HNF-1α and plasma CRP concentration in two independent populations of older adults. Given the association between plasma CRP concentration and various metabolic and cardiovascular diseases, larger studies assessing the potential association of HNF1A genotype with more complex, clinical-disease-related endpoints could shed additional light on the role of genetic regulation of CRP on the occurrence of disorders such as myocardial infarction, stroke, diabetes, and metabolic syndrome.23,24
Acknowledgments
The authors thank Jiong Zhang for providing assistance with the PARC-data analysis. The research reported in this article was supported by PARC grants U01 HL-069757 (R.M.K) and U01 HL084689 (M.S.); CHS contracts N01-HC-85079–N01-HC-85086, N01-HC-35129, N01 HC-15103, and N01 HC-55222; and CHS grants U01 HL080295 and R01 HL-071862 (A.P.R.) from the National Heart, Lung, and Blood Institute; as well as by grant U19 AG023122 (A.P.R) from the National Institute on Aging Longevity Consortium. An additional contribution was given from the National Institute of Neurological Disorders and Stroke. Genotyping services for the CHS were provided by the Center for Inherited Disease Research (CIDR). CIDR is fully funded through a federal contract from the National Institutes of Health to The Johns Hopkins University, contract Number N01-HG-65403. Genotyping services for the CHS were also provided by the Johns Hopkins University under federal contract number N01-HV-48195 from the National Heart, Lung, and Blood Institute. The original PRINCE clinical trial was funded by Bristol-Myers Squibb. DNA extraction from PRINCE was funded by Roche, Inc., with additional funds from the Leducq Foundation (Paris, France). P.M.R. is listed as a coinventor on patents held by the Brigham and Women's Hospital that relate to the use of inflammatory biomarkers in cardiovascular disease.
Appendix
CRP Phenotype
Multiple CRP measurements were available for the majority of participants in both the PARC (pre- and post-statin treatment) study and the CHS (baseline and after three years of follow up). For reduction of the effects of measurement error and environmental variation on the CRP phenotype, all available values for plasma CRP of each participant were combined into a single value, as follows.
In the CHS, a normal quantile transformation of CRP was first performed at each time point to improve the normality of model residuals. To reduce effects of environmental influences, we adjusted quantile-transformed CRP levels for strong predictors (age, sex, clinic, smoking, body-mass index) at each time point by using multiple linear regression and taking the standardized residuals. Covariate-adjusted normalized CRP residuals were then averaged across time points when multiple measures were available for a given participant, and a single value was used for those subjects with only one measure. The final averaged values were again quantile normalized to have mean of 0 and variance of 1 prior to analysis.
In PARC, the phenotypes were processed separately in the two studies (CAP and PRINCE), following the same procedure as that in the CHS except that the quantile-transformed CRP phenotypes were first averaged across time points and then covariate-corrected (for age, sex, smoking, body-mass index), rather than the covariate correction being performed within each time point. Separate processing of the phenotype in each study avoids potential spurious associations due to systematic differences (e.g., in population structure) between the two studies. Note that phenotype averaging across time points in PARC includes values from both pre- and post- statin exposure. Because statin exposure affects CRP levels variably across individuals, the post-statin measurements in PARC might be considered “noisy” measures of the baseline CRP. However, the noise levels are low (intra-individual correlation of pre- and post-statin CRP = 0.75). In addition, the Bayes Factors for previously reported associations of CRP phenotype with SNPs in APOE and CRP genes were larger (by up to a factor of 10) for the averaged phenotype than for baseline phenotype only, suggesting that measurement error is reduced, and true genetic signals enhanced, by the averaging of pre- and post-statin values. These results emphasize the potential utility of the averaging of multiple measures of phenotypes over time.
Adjustment for Population Stratification
To examine the potential effects of within-Europe population stratification in PARC, we also analyzed phenotypes for individuals in stage 1 after correction for population stratification with principal-components analysis.9 Specifically, we computed the first ten principal components from the 317,000 SNPs typed in stage 1 individuals, masking regions of the genome known to harbor inversions, or unusual patterns of LD, which can give rise to PCs unrelated to population structure.8 We also excluded SNPs on the basis of pairwise genotypic correlation, removing SNPs from pairs with r2 > 0.2 in sliding windows of 500 SNPs, while shifting the window in increments of five SNPs at each step. Three of these PCs (1, 2, and 5) were correlated with CRP phenotypes (Spearman rank-correlation p value < 0.05), so we adjusted the phenotype by taking the residuals obtained from multiple linear regression of the phenotype on these PCs.
Genotyping Methods and Quality Control
In PARC, study participants were randomly divided into discovery (stage 1) and confirmation (stage 2) sets. A total of 980 PARC subjects (305 CAP participants + 675 PRINCE participants) were typed in stage 1 for a panel of 317,000 tagSNPs derived from phase I+II of the International HapMap Project. Genomic linkage disequilibrium coverage in Caucasians for all Phase I+II loci is 91% for an r2 threshold ≤ 0.5 and 80% for an r2 threshold ≤ 0.8. Genotyping was performed at the University of Washington, Department of Genome Sciences using the Illumina Infinium technology on an automated Iluumina BeadStation system with the Sentrix(R) Human-1 BeadChip (Illumina Inc. San Diego CA). Analysis of blind duplicate quality control samples using ∼18,000 SNPs contained on the 317K GWA chip and a separate 109K GWA chip showed a genotyping concordance rate of 99.97%. In PARC stage 2, an additional 930 PARC subjects (294 CAP participants + 636 PRINCE participants) were typed for a total of 13,680 SNPs selected on the basis of the results of a broader GWA survey within the PARC study of SNPs and haplotypes showing statistical evidence of association with a variety of lipid-related phenotypes or CRP phenotype in Stage 1, as well as to provide more detailed tagSNP coverage for additional candidate genes within pathways related to lipid metabolism. The PARC stage 2 custom genotyping panel contained 3 SNPs (rs868795, rs7953249, rs735396) located within the ∼200kb region encompassing HNF1A. The stage 2 SNPs were typed using the Illumina iSelect system (Illumina Inc. San Diego CA).The genotyping of the custom panel in PARC stage 2 showed call rates of > 99.85% with only 193 (1.48%) of the 12,959 sites failing to work. The replicate error rate for six samples run in duplicate was 0.002%.
In the CHS, genomic sequence variation data were available for many of our candidate genes through the National Heart, Lung, and Blood Institute-funded SeattleSNPs Program for Genomics Applications (PGA). For genes not re-sequenced by the PGA, we used genotype data available from the International HapMap project. Using the LDselect algorithm of Carlson et al.,25 we selected a set of tagSNPs that capture common patterns of genetic variation within our genes of interest. Genotyping for the majority of our candidate genes was performed using the Illumina GoldenGate platform by the Center for Inherited Disease Research, Johns Hopkins University (Baltimore, Maryland, USA). TagSNPs from 20 additional candidate genes were typed at the Laboratory for Clinical Biochemistry Research (University Vermont) with the ABI TaqMan platform using Assays By Design on an ABI 7900 real time thermal cycler under standard conditions (TaqMan® SNP Genotyping Assays Protocol, Rev. B, Part #4332856b, Applied Biosystems, Foster City, CA). After removing SNPs with minor allele frequency < 5% and those with missing rates > 25%, there were 979 SNPs for analysis. For both the Illumina and TaqMan platforms, overall genotype missing rate was < 0.1%; genotyping failure rate did not exceed 4.2% for any of the SNPs under study. Concordance rates for blind duplicate samples was > 99.5% for all SNPs assays across both genotyping platforms. After removing 195 individuals with > 25% missing genotypes, the total genotyping rate in the remaining individuals was > 99%.
Bayesian Regression and Imputation Analysis
To assess the strength of evidence for association between candidate genes or individual SNPs and CRP, we used the “Bayesian IMputation-Based Association Mapping” method of Servin and Stephens implemented in the program BIMBAM.7 BIMBAM quantifies the strength of evidence for association by computing Bayes Factors (BFs) for each SNP. The quantile normalized mean covariate-adjusted CRP values were used as the quantitative phenotype for the BIMBAM analysis. BFs were computed under the linear model
where Yi denotes the CRP phenotype for individual i, Xi denotes the genotype for individual i (coded as 0, 1 or 2), a denotes the additive effect, d denotes the dominance effect, and ɛi denotes an error term. The BFs were computed using the prior D2,7 averaging over σa = 0.05, 0.1, 0.2, 0.4 and σd = σa/4. In the PARC analysis we computed a single-SNP BF for each of the 317,000 genotyped SNPs, and single-SNP p values were obtained from these BFs by permutation.7 In the CHS analysis, we used BIMBAM to compute a global BF for each gene, as the average of the single-SNP BFs across SNPs in each gene, and obtained corresponding p values (for the global null that none of the SNPs in the gene are associated with phenotype) by permutation, which accounts for correlation among SNPs in the same gene due to linkage disequilibrium.7 Each permutation test involved 100,000 to 10,000,000 permutations, depending on the level of significance attained.
Imputation-based methods such as BIMBAM are particularly useful for combining data from multiple studies that have typed different SNPs in the same candidate region using different genotyping platforms. Patterns of correlation or LD among the markers typed in each phenotypic data set (CHS, PARC discovery set, PARC confirmation set) and a more densely-genotyped genotype panel (HapMap CEU parents) were used to impute the genotypes at all HapMap markers in and near HNF1A, in all individuals, allowing the combined data to be used when assessing the strength of the association between genotypes and the phenotype.7 In the combined imputation analysis, we computed single-SNP BF and permutation p-values for each untyped SNP using the posterior mean genotype as the estimated genotype. This single-imputation method, ignoring uncertainty in imputed genotypes, gives similar results to averaging over multiple imputations (Y. Guan and M. Stephens, unpublished data). Posterior probabilities for each SNP being responsible for an observed association, conditional on exactly one SNP in the region being responsible, were obtained from the single-SNP BFs by normalizing them to sum to 1 (implicitly assuming that each SNP is equally likely, a priori, to be responsible).
To estimate effect sizes of individual SNP genotypes on CRP phenotype in the CHS, we performed multiple linear regression models, using log-transformed CRP as the dependent variable and assuming a constant effect size for each additional copy of the minor allele. Covariate-adjusted SNP-specific change in estimated mean plasma log(CRP) level was estimated from the regression coefficient (β). Analysis of the association between HNF1A haplotypes and baseline log-transformed CRP levels in the CHS participants, adjusted for covariates (age, sex, clinic, body mass index, smoking) was performed using the haplotype estimation and generalized linear model score test framework of Schaid et al.,26 implemented in the statistical package Haplo.stats.
To assess the robustness of our results of the association between the HNF1A genotype and the CRP phenotype, we performed several additional sensitivity analyses. Analyses restricted to subjects with CRP levels < 10 mg/l produced results similar to those using all subjects. Additional adjustment for, or exclusion of, the small number of hormone therapy replacement users from the CHS similarly did not have an appreciable impact on any of our results.
Web Resources
The URLs for data presented herein are as follows:
BIMBAM program, http://stephenslab.uchicago.edu/software.html
The Cardiovascular Health Study, http://www.chs-nhlbi.org
Haplo.stats program, http://mayoresearch.mayo.edu/mayo/research/schaid_lab/software.cfm
International HapMap Project, http://www.hapmap.org
Online Mendelian Inheritance in Man (OMIM), http://www.ncbi.nlm.nih.gov/Omim/
SeattleSNPs Program for Genomics Applications, http://pga.mbt.washington.edu/
References
- 1.Hage F.G., Szalai A.J. C-reactive protein gene polymorphisms, C-reactive protein blood levels, and cardiovascular disease risk. J. Am. Coll. Cardiol. 2007;50:1115–1122. doi: 10.1016/j.jacc.2007.06.012. [DOI] [PubMed] [Google Scholar]
- 2.Pankow J.S., Folsom A.R., Cushman M., Borecki I.B., Hopkins P.N., Eckfeldt J.H., Tracy R.P. Familial and genetic determinants of systemic markers of inflammation: the NHLBI family heart study. Atherosclerosis. 2001;154:681–689. doi: 10.1016/s0021-9150(00)00586-4. [DOI] [PubMed] [Google Scholar]
- 3.de Maat M.P., Bladbjerg E.M., Hjelmborg J.B., Bathum L., Jespersen J., Christensen K. Genetic influence on inflammation variables in the elderly. Arterioscler. Thromb. Vasc. Biol. 2004;24:2168–2173. doi: 10.1161/01.ATV.0000143856.01669.e7. [DOI] [PubMed] [Google Scholar]
- 4.Simon J.A., Lin F., Hulley S.B., Blanche P.J., Waters D., Shiboski S., Rotter J.I., Nickerson D.A., Yang H., Saad M. Phenotypic predictors of response to simvastatin therapy among African-Americans and Caucasians: the Cholesterol and Pharmacogenetics (CAP) Study. Am. J. Cardiol. 2006;97:843–850. doi: 10.1016/j.amjcard.2005.09.134. [DOI] [PubMed] [Google Scholar]
- 5.Albert M.A., Danielson E., Rifai N., Ridker P.M., PRINCE Investigators Effect of statin therapy on C-reactive protein levels: the pravastatin inflammation/CRP evaluation (PRINCE): a randomized trial and cohort study. JAMA. 2001;286:64–70. doi: 10.1001/jama.286.1.64. [DOI] [PubMed] [Google Scholar]
- 6.Roberts W.L., Molton L., Law T.C., Farrow G., Cooper-Anderson M., Savory J., Rifai N. Evaluation of nine automated high sensitivity C-reactive protein methods: implications for clinical and epidemiological application, part 2. Clin. Chem. 2001;47:418–425. [PubMed] [Google Scholar]
- 7.Servin B., Stephens M. Imputation-based analysis of association studies: candidate regions and quantitative traits. PLoS Genet. 2007;3:e114. doi: 10.1371/journal.pgen.0030114. [DOI] [PMC free article] [PubMed] [Google Scholar]
- 8.The Wellcome Trust Case Control Consortium Genome-wide association study of 14,000 cases of seven common diseases and 3,000 shared controls. Nature. 2007;447:661–678. doi: 10.1038/nature05911. [DOI] [PMC free article] [PubMed] [Google Scholar]
- 9.Price A.L., Patterson N.J., Plenge R.M., Weinblatt M.E., Shadick N.A., Reich D. Principal components analysis corrects for stratification in genome-wide association studies. Nat. Genet. 2006;38:904–919. doi: 10.1038/ng1847. [DOI] [PubMed] [Google Scholar]
- 10.Fried L.P., Borhani N.O., Enright P., Furberg C.D., Gardin J.M., Kronmal R.A., Kuller L.H., Manolio T.M., Mittelmark M.B., Newman A. The cardiovascular health study: Design and rationale. Ann. Epidemiol. 1991;1:263–276. doi: 10.1016/1047-2797(91)90005-w. [DOI] [PubMed] [Google Scholar]
- 11.Lange L.A., Reiner A.P., Carty C.A., Jenny N.S., Cushman M., Lange E.M. Common genetic determinants of plasma fibrin D-dimer concentration in older European- and African-American adults. J. Thromb. Haemost. 2008;6:654–659. doi: 10.1111/j.1538-7836.2008.02906.x. [DOI] [PubMed] [Google Scholar]
- 12.Macy E.M., Hayes T.E., Tracy R.P. Variability in the measurement of C-reactive protein in healthy subjects: implications for reference intervals and epidemiologic applications. Clin. Chem. 1997;43:52–58. [PubMed] [Google Scholar]
- 13.Chasman D.I., Kozlowski P., Zee R.Y., Kwiatkowski D.J., Ridker P.M. Qualitative and quantitative effects of APOE genetic variation on plasma C-reactive protein, LDL-cholesterol, and apoE protein. Genes Immun. 2006;7:211–219. doi: 10.1038/sj.gene.6364289. [DOI] [PubMed] [Google Scholar]
- 14.Austin M.A., Zhang C., Humphries S.E., Chandler W.L., Talmud P.J., Edwards K.L., Leonetti D.L., McNeely M.J., Fujimoto W.Y. Heritability of C-reactive protein and association with apolipoprotein E genotypes in Japanese Americans. Ann. Hum. Genet. 2004;68:179–188. doi: 10.1046/j.1529-8817.2004.00078.x. [DOI] [PubMed] [Google Scholar]
- 15.Agrawal A., Samols D., Kushner I. Transcription factor c-Rel enhances C-reactive protein expression by facilitating the binding of C/EBPbeta to the promoter. Mol. Immunol. 2003;40:373–380. doi: 10.1016/s0161-5890(03)00148-2. [DOI] [PubMed] [Google Scholar]
- 16.Li S.P., Goldman N.D. Regulation of human C-reactive protein gene expression by two synergistic IL-6 responsive elements. Biochemistry. 1996;35:9060–9068. doi: 10.1021/bi953033d. [DOI] [PubMed] [Google Scholar]
- 17.Voleti B., Agrawal A. Regulation of basal and induced expression of C-reactive protein through an overlapping element for OCT-1 and NF-kappaB on the proximal promoter. J. Immunol. 2005;175:3386–3390. doi: 10.4049/jimmunol.175.5.3386. [DOI] [PMC free article] [PubMed] [Google Scholar]
- 18.Ridker P.M., Pare G., Parker A., Zee Y.L., Danik J.S., Buring J.E., Kwiatkowski D., Cook N.R., Miletich J.P., Chasman D.I. Loci related to metabolic-syndrome pathways including LEPR,HNF1A, IL6R, and GCKR associate with plasma c-reactive protein: The women's genome health study. Am. J. Hum. Genet. 2008;82:1185–1192. doi: 10.1016/j.ajhg.2008.03.015. this issue. [DOI] [PMC free article] [PubMed] [Google Scholar]
- 19.Saxena R., Voight B.F., Lyssenko V., Burtt N.P., de Bakker P.I., Chen H., Roix J.J., Kathiresan S., Hirschhorn J.N., Daly M.J. Genome-wide association analysis identifies loci for type 2 diabetes and triglyceride levels. Science. 2007;316:1331–1336. doi: 10.1126/science.1142358. [DOI] [PubMed] [Google Scholar]
- 20.Sagen J.V., Odili S., Bjørkhaug L., Zelent D., Buettger C., Kwagh J., Stanley C., Dahl-Jørgensen K., de Beaufort C., Bell G.I. From clinicogenetic studies of maturity-onset diabetes of the young to unraveling complex mechanisms of glucokinase regulation. Diabetes. 2006;55:1713–1722. doi: 10.2337/db05-1513. [DOI] [PubMed] [Google Scholar]
- 21.Holmkvist J., Cervin C., Lyssenko V., Winckler W., Anevski D., Cilio C., Almgren P., Berglund G., Nilsson P., Tuomi T. Common variants in HNF-1 alpha and risk of type 2 diabetes. Diabetologia. 2006;49:2882–2891. doi: 10.1007/s00125-006-0450-x. [DOI] [PubMed] [Google Scholar]
- 22.Zhang Y.Y., Gottardo L., Mlynarski W., Frazier W., Nolan D., Duffy J., Marescotti M.C., Gervino E.V., Johnstone M.T., Mantzoros C.S. Genetic variability at the leptin receptor (LEPR) locus is a determinant of plasma fibrinogen and C-reactive protein levels. Atherosclerosis. 2007;191:121–127. doi: 10.1016/j.atherosclerosis.2006.02.043. [DOI] [PubMed] [Google Scholar]
- 23.Lange L.A., Carlson C.S., Hindorff L.A., Lange E.M., Walston J., Durda J.P., Cushman M., Bis J.C., Zeng D., Lin D. Association of polymorphisms in the CRP gene with circulating C-reactive protein levels and cardiovascular events. JAMA. 2006;296:2703–2711. doi: 10.1001/jama.296.22.2703. [DOI] [PubMed] [Google Scholar]
- 24.Timpson N.J., Lawlor D.A., Harbord R.M., Gaunt T.R., Day I.N., Palmer L.J., Hattersley A.T., Ebrahim S., Lowe G.D., Rumley A. C-reactive protein and its role in metabolic syndrome: mendelian randomization study. Lancet. 2005;366:1954–1959. doi: 10.1016/S0140-6736(05)67786-0. [DOI] [PubMed] [Google Scholar]
- 25.Carlson C.S., Eberle M.A., Rieder M.J., Yi Q., Kruglyak L., Nickerson D.A. Selecting a maximally informative set of single-nucleotide polymorphisms for association analyses using linkage disequilibrium. Am. J. Hum. Genet. 2004;74:106–120. doi: 10.1086/381000. [DOI] [PMC free article] [PubMed] [Google Scholar]
- 26.Schaid D.J., Rowland C.M., Tines D.E., Jacobson R.M., Poland G.A. Score tests for association between traits and haplotypes when linkage phase is ambiguous. Am. J. Hum. Genet. 2002;70:425–434. doi: 10.1086/338688. [DOI] [PMC free article] [PubMed] [Google Scholar]