Abstract
Oxidative stress-induced lipid peroxidation leads to the formation of cytotoxic and genotoxic 2-alkenals, such as 4-hydroxy-2-nonenal (HNE) and 4-oxo-2-nonenal (ONE). Lipid-derived reactive aldehydes are subject to phase-2 metabolism and are predominantly found as mercapturic acid (MA) conjugates in urine. This study shows evidence for the in vivo formation of ONE and its phase-1 metabolites, 4-oxo-2-nonen-1-ol (ONO) and 4-oxo-2-nonenoic acid (ONA). We have detected the MA conjugates of HNE, 1,4-dihydroxy-2-nonene (DHN), 4-hydroxy-2-nonenoic acid (HNA), the lactone of HNA, ONE, ONO, and ONA in rat urine by liquid chromatography-tandem mass spectrometry comparison with synthetic standards prepared in our laboratory. CCl4 treatment of rats, a widely accepted animal model of acute oxidative stress, resulted in a significant increase in the urinary levels of DHN-MA, HNA-MA lactone, ONE-MA, and ONA-MA. Our data suggest that conjugates of HNE and ONE metabolites have value as markers of in vivo oxidative stress and lipid peroxidation.
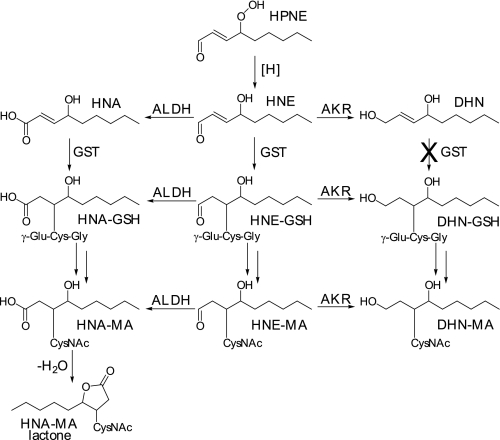
Lipid peroxidation (LPO)2 products are breakdown products of fatty acids formed under conditions of oxidative stress. 4-Hydroxy-2-nonenal (HNE) is a well established LPO product that has been shown to contribute to the development and progression of age-related diseases such as Alzheimer and atherosclerosis (1–4) in addition to being cytotoxic and genotoxic (5, 6). The mechanism of formation for HNE from linoleic acid via 4-hydroperoxy-2-nonenal (HPNE) has been previously demonstrated (7). Once HNE is formed, it can be further metabolized by cytochrome P450, aldehyde dehydrogenase, aldo-keto reductase (AKR), and conjugated by glutathione S-transferase (GST). Certain isoforms of murine and human P450s (8) and aldehyde dehydrogenase (9) can catalyze the oxidation of HNE to 4-hydroxy-2-nonenoic acid (HNA). When conjugated, HNA can undergo spontaneous intramolecular condensation, resulting in lactone formation (10). Aldo-keto reductase 1B1 has been shown to reduce HNE to form 1,4-dihydroxy-2-nonene (DHN) (11). Glutathione (GSH) can form conjugates with HNE and other LPO products (6) via a Michael-type addition mediated by GST (12–14). The GSH can then be further metabolized in the liver and in the kidney to form mercapturic acid (MA), resulting in the conjugates shown in Fig. 1. A number of studies have examined HNE and its metabolites in vivo (10, 15–18) and have demonstrated the formation of the MA conjugates HNE-MA, DHN-MA, HNA-MA, and HNA-MA lactone in vivo (10). In addition, histidine-1,4-dihydroxynonane (His-DHN) and His-HNA have been found in the urine of obese Zucker rats, a model of metabolic syndrome (19).
FIGURE 1.
Formation of LPO-MA conjugates from HNE. Under conditions of oxidative stress, linoleic and arachidonic acids can be oxidized to form HPNE. HPNE can then be reduced to HNE and further metabolized by aldehyde dehydrogenase (ALDH), aldo-keto reductase (AKR), and GST. These enzymes cause oxidization, reduction, or GSH conjugation, respectively. Once LPO-GSH conjugates have formed, the GSH is further metabolized to MA. The LPO-MA conjugates are analyzed in this study. It is important to note that once HNE has been reduced to DHN, it will no longer form a Michael-type conjugate with GSH due to the lack of α,β-unsaturation. Also, HNA-MA is subject to intramolecular condensation, resulting in the formation of a lactone.
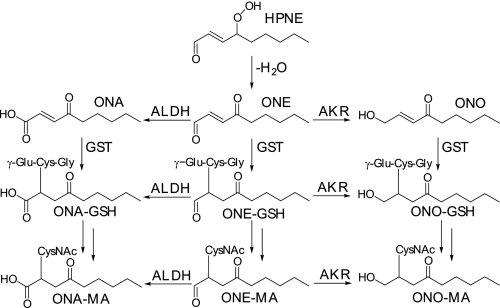
Not only can HPNE break down into HNE, but it can also form 4-oxo-2-nonenal (ONE) as shown in vitro (20) and in cultured cells (21). ONE can be reduced at the C-4 position by carbonyl reductase to form HNE (22), but it can also be reduced at the C-1 position by aldo-keto reductase to form 4-oxo-2-nonen-1-ol (ONO) (21, 23, 24) or oxidized by aldehyde dehydrogenase (human aldehyde dehydrogenase 2) to form 4-oxo-2-nonenoic acid (ONA) (25). Again, GST can mediate conjugate formation, resulting in metabolism to the MA conjugates shown in Fig. 2. In view of these findings, ONE metabolites are expected to be formed in vivo as end products of LPO, but their presence in vivo has not been demonstrated.
FIGURE 2.
Formation of LPO-MA conjugates from ONE. HPNE can eliminate a water molecule, resulting in the formation of ONE. Similarly to HNE, ONE undergoes oxidation by aldehyde dehydrogenase (ALDH), reduction by aldo-keto reductase (AKR), and GSH conjugation by GST. Unlike HNE, ONE has two possible sites of conjugate formation, at the C-2 and C-3 positions. Thus, after reduction, the ONO formed retains its α,β-unsaturation, allowing it to form GSH conjugates via this route. The MA conjugates were analyzed in this study and are shown here as the C-2 conjugates.
Here we report that phase-2 metabolites of ONE, ONA, and ONO are formed after an acute oxidative stress insult in rats. Rats were exposed to CCl4, an established model of in vivo oxidative stress (26). MA conjugates of HNE and ONE metabolites were detected in the urine by LC-MS/MS comparison with synthetic standards. Our results demonstrate, for the first time that ONE metabolites, in addition to HNE metabolites, are formed in vivo as products of LPO. Currently, F2-isoprostanes are considered to be the most reliable marker of in vivo oxidative stress and LPO (27). The CCl4 induced formation of the HPNE-derived LPO product conjugates show potential for these metabolites as additional or alternative markers of oxidative stress in animals and in humans.
EXPERIMENTAL PROCEDURES
Reagents—[9-2H3]-4-Hydroxy-2-nonenal was purchased from Cayman Chemical Co. (Ann Arbor, MI). [2H]Chloroform was purchased from Cambridge Isotope Laboratories (Andover, MA). HPLC-grade formic acid (0.1%) in water was purchased from Honeywell Burdick and Jackson (Muskegon, MI). 3-Chloroperoxybenzoic acid was purchased from TCI America (Portland, OR). All other chemicals were purchased from Sigma-Aldrich.
Synthesis of HNE and ONE Metabolites
HNE—HNE was synthesized from 3-(Z)-nonenol following a method adapted from Gardner et al. (28). Briefly, 3-(Z)-nonenol (2 mmol) was dissolved in 8 ml of CH2Cl2, and 3-chloroperoxybenzoic acid (2 mmol) was added. The reaction mixture was stirred for1hat room temperature and, after the addition of 8 ml of 10% aqueous NaHCO3, stirred for 45 min. The reaction mixture was washed with water and dried with 2 g of powdered molecular sieves. 4-Methylmorpholine N-oxide (3 mmol) was added, and the mixture was stirred under argon for 30 min. After the addition of tetrapropylammonium perruthenate (0.1 mmol), the mixture was stirred for 1 h under argon, filtered through silica gel, and rinsed with ethyl ether. Next, 16 ml of 1.3 m sodium hydroxide was added to the filtrate, and the solution was stirred vigorously for 15 min. The reaction mixture was washed with water, dried with anhydrous MgSO4, filtered, and concentrated in vacuo. The yield was 35%. Our adaptations to the method of Gardner et al. (28) gave a slightly lower yield; however, we found that the changes resulted in more consistent yields. Data are 1H NMR (400 MHz, CDCl3) δ 9.63 (d, J = 8 Hz, 1H), 6.86 (dd, J = 5, 16 Hz, 1H), 6.35 (ddd, J = 2, 8, 16 Hz, 1H), 4.48 (m, 1H), 1.76 (d, J = 5 Hz, 2H), 1.43 (m, 7H), 0.94 (t, J = 6 Hz, 3H).
ONA—ONA was synthesized from 2-pentylfuran following the method of Annangudi et al. (29). Data are 1H NMR (400 MHz, CDCl3) δ 7.18 (d, J = 16 Hz, 1H), 6.71 (d, J = 16 Hz, 1H), 2.68 (t, J = 7 Hz, 2H), 1.69 (m, 1H), 1.31 (m, 5H), 0.94 (t, J = 7, 3H).
HNA—To a stirred solution of ONA (0.05 mmol) in 5 ml of ethanol was added 0.1 mmol of sodium borohydride. After 45 min at room temperature, the reaction mixture was acidified to pH 3 with 1 n HCl. The mixture was then extracted with ethyl ether. The organic layer was dried with anhydrous MgSO4, filtered, and concentrated in vacuo. Data are 1H NMR (400 MHz, CDCl3) δ 7.10 (dd, J = 5, 16 Hz, 1H), 6.10 (d, J = 16 Hz, 1H), 4.39 (dd, J = 5, 11 Hz, 1H), 1.65 (m, 2H), 1.58–1.22 (m, 7H), 0.93 (t, J = 6, 3H).
ONE—ONE was synthesized from 2-pentylfuran following the method of Zhang et al. (30). Data are 1H NMR (400 MHz, CDCl3) δ 9.82 (d, J = 7 Hz, 1H), 6.91 (d, J = 16 Hz, 1H), 6.81 (dd, J = 7, 16 Hz, 1H), 5.45 (t, J = 7 Hz, 2H), 1.70 (m, 2H), 1.36 (m, 4H), 0.94 (t, J = 7, 3H).
ONO—To a stirred solution of ONE (0.01 mmol) in 1 ml of methanol were added 17.05 ml of phosphate buffer (0.1 m, pH3) and 950 μl of a 50 mm sodium cyanoborohydride solution in 1 n NaOH. After stirring for 15 h at room temperature, the reaction mixture was extracted with ethyl acetate, and the organic layer was concentrated in vacuo. Data are 1H NMR (400 MHz, CDCl3) δ 6.93 (dt, J = 4, 16 Hz, 1H), 6.42 (dt, J = 2, 16 Hz, 1H), 4.42 (dd, J = 2, 4 Hz, 2H), 2.59 (t, J = 7 Hz, 2H), 1.66 (m, 2H), 1.37 (m, 5H), 0.93 (t, J = 7, 3H).
LPO-MA Adducts—All adducts were synthesized in the same manner and characterized by LC-electrospray ionization-MS/MS (see Table 1). A 20 mm solution of MA was prepared in 0.1 m phosphate buffer, pH 8. To 50 μl of this solution was added 450 μl of the same phosphate buffer and 400 μl of water. A1mm solution of the LPO product of interest was made up in ethanol, and 100 μl was added to the MA solution. The reaction was stirred at 37 °C for 2 h and then acidified to pH 3 with 1 n HCl. It was then extracted with ethyl acetate, 3 × 1 ml, evaporated under nitrogen using a Zymark TurboVap LV (Caliper Life Sciences, Hopkinton, MA) and reconstituted in 1 ml of 20:80 acetonitrile:water containing 0.1% formic acid.
TABLE 1.
LC-MS/MS properties of ONE and HNE metabolites detected in the urine of rats
| Analyte | Mr | SRM transition | Collision energy | Retention time | Figure trace | p valuea |
|---|---|---|---|---|---|---|
| eV | min | |||||
| ONE-MA | 317 | 316→162 | 25 | 3.3b | 5B | 0.0017 |
| HNE-MA | 319 | 318→189 | 25 | 8.9, 9.3 | 3A | |
| 318→171 | 25 | 3A | 0.18 | |||
| 318→162 | 25 | 3A | ||||
| ONO-MA | 319 | 318→189 | 25 | 8.9, 9.3, 9.7 | 3B | |
| 318→171 | 25 | 3B | ||||
| 318→162 | 25 | 3B | 0.10 | |||
| DHN-MA | 321 | 320→191 | 30 | 8.3 | 6A | 0.020 |
| 320→143 | 30 | 6A | 0.0055 | |||
| ONA-MA | 333 | 332→169 | 25 | 10.3 | 6C | 0.010 |
| 332→162 | 25 | 6C | 0.0079 | |||
| 332→ 84 | 25 | 6C | 0.0083 | |||
| HNA-MA | 335 | 334→162 | 25 | 10.1 | 6E | 0.30 |
| HNA-MA | 317 | 316→162 | 25 | 3.9b | 5A | 0.096 |
| lactone | 316→143 | 25 | 5A | 0.048 |
p values indicate statistical differences between CCl4-dosed rats and controls.
Recorded using chromatographic system 2.
DHN-MA—Because DHN has no α,β-unsaturation with which a Michael-type adduct can form, the DHN-MA adduct was made by first synthesizing HNE-MA as described above. The aldehyde moiety was then reduced with 10 μlofa5 m sodium borohydride solution in 1 n NaOH (31). The reduction mixture was stirred at room temperature for 30 min then acidified to pH 3 with 1 n HCl. It was then extracted with ethyl acetate, 3 × 1 ml, evaporated under nitrogen, and reconstituted in 1 ml of 20:80 acetonitrile:water containing 0.1% formic acid.
Animal Treatment
The experimental protocol for the animal studies was approved by the Institutional Animal Care and Use Committee at Oregon State University. Male F344 rats (Harlan, Indianapolis, IN), weighing 280–320 g, were housed in individual plastic cages covered with Hepa filter and allowed free access to standard animal chow and water ad libitum. After 1 week of acclimatization, the rats were transferred to metabolism cages. Six animals were divided into two groups of three, with one group receiving an intraperitoneal dose of 1 ml/kg CCl4 (dissolved in corn oil), and the other group (control) receiving the vehicle alone. The CCl4 dose of 1 ml/kg was chosen on the basis of literature reports (32, 33). Urine was collected from the rats during a 24-h period after treatment.
Urine Samples
A volume of 0.5 ml of rat urine was acidified with 225 μl of 1 n HCl to pH 3. To the urine was added 5 μl of a 1 μm solution of [9-2H3]HNE-MA as an internal standard. The samples were extracted with ethyl acetate, 3 × 1 ml. The ethyl acetate layers were combined and evaporated under nitrogen. Samples were then reconstituted in 200 μl of 20:80 acetonitrile:water containing 0.1% formic acid.
Urinary creatinine was measured using a Creatinine Assay Kit, catalog no. 500701 (Cayman Chemical). The assay was performed according to the manufacturer's directions. There was no significant difference between treated and control creatinine levels (p = 0.9).
HPLC
A Shimadzu Prominence HPLC system (Shimadzu, Columbia, MD) consisting of four LC-20AD pumps, a DQU-20A5 degasser, and an SIL-HTc autosampler equipped with switching valves was used for all chromatography. Two chromatographic systems were used, and unless otherwise stated, all data presented were recorded with system 1. For system 1, the HPLC column was a 250 × 2-mm Synergi Max RP C12 column (Phenomenex, Torrance, CA). The mobile phase consisted of solvent A, 0.1% (v/v) formic acid in water, and solvent B, acetonitrile containing 0.1% (v/v) formic acid. The flow rate was 0.2 ml/min. Separations were carried out using a linear solvent gradient from 20 to 50% B in 10 min, a linear gradient from 50 to 90% B over the next 2 min, held constant at 90% B for 7 min, returned to 20% B after 1 min, and equilibrated at 20% B for 5 min. System 2 consisted of a 50 × 2.1-mm Inertsil ODS-3 column (Varian, Lake Forest, CA). The mobile phase consisted of solvent A, 0.1% (v/v) formic acid in water, and solvent B, methanol. The flow rate was 0.3 ml/min, and separations were carried out using a linear solvent gradient from 45 to 90% B over 5 min, held constant at 90% B for 1 min, then returned to 45% B and equilibrated for 3 min.
Mass Spectrometry
An Applied Biosystems MDS Sciex hybrid triple quadrupole/linear ion trap mass spectrometer (4000 QTrap) equipped with a TurboV electrospray source (Concord) was used for these analyses. The TurboV source was maintained at 400 °C. The ion-spray voltage was –4500 V, and the declustering potential was 40 V. Nitrogen was used as the source gas, curtain gas, and collision gas. Various scanning techniques, all run in negative ion mode, were used for the characterization and detection of LPO-MA products, including Q1, product ion scanning, and selected reaction monitoring (SRM). All SRM transitions and collision energies are shown in Table 1.
Data Analysis
Peak area analysis was performed using Analyst 1.4.1 (Applied Biosystems). Analyte peak areas were normalized for the internal standard (IS) peak area, a 2.5-fold sample concentration, and for the creatinine concentration in mg/ml. Thus, all data are represented as analyte peak area/(IS peak area × 2.5 × mg/ml creatinine). For these analyses, peak 3 (9.7 min, Fig. 3B) from the m/z 318 → 162 SRM transition was used to quantify ONO-MA, and peak 2 (9.3 min, Fig. 3A) from the m/z 318 → 171 SRM transition was used to quantify HNE-MA. Statistical comparisons were performed using GraphPad (San Diego, CA). Data are shown as mean ± S.E.
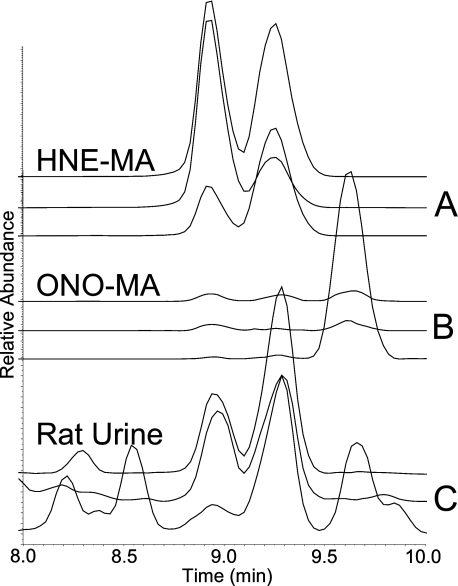
FIGURE 3.
SRM chromatograms for the isobaric compounds HNE-MA and ONO-MA. A, standard reaction mixture of HNE-MA; transitions shown are from top to bottom: m/z 318 → 171, m/z 318 → 189, and m/z 318 → 162. B, standard reaction mixture of ONO-MA; transitions shown are from top to bottom: m/z 318 → 171, m/z 318 → 189, and m/z 318 → 162. C, rat urine sample; transitions shown are from top to bottom: m/z 318 → 171, m/z 318 → 189, and m/z 318 → 162. The HNE-MA gives only two peaks (8.9 and 9.3 min), whereas the ONO-MA gives three (8.9, 9.3, and 9.7 min). The standards confirm that the third peak contains only ONO-MA. This third peak was used to represent ONO-MA for comparison between oxidatively stressed rats and control rats.
RESULTS
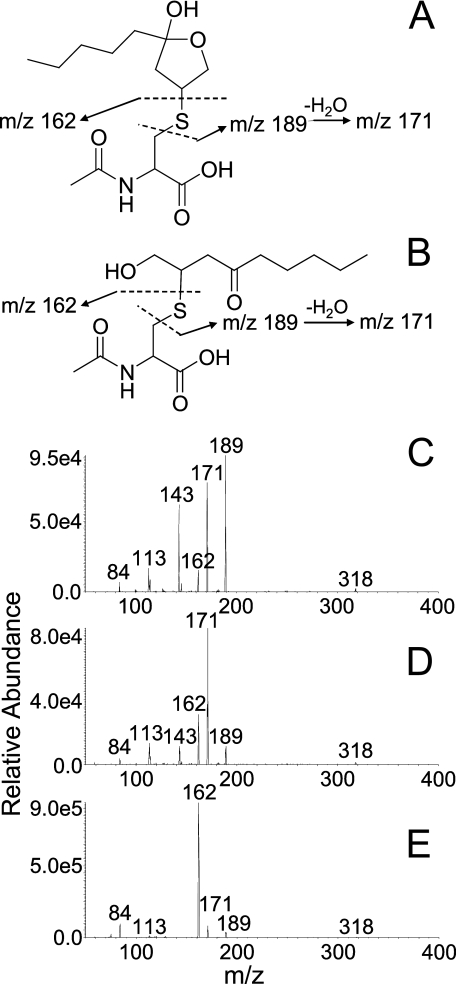
Detection of the MA Conjugate of ONO—Using SRM transitions for the MA conjugate of HNE, three chromatographic peaks (8.9, 9.3, and 9.7 min, Fig. 3C) were observed in the urine of CCl4-dosed rats, of which only the first two corresponded with the two chromatographic peaks produced by a synthetic sample of HNE-MA (Fig. 3A). The product ion spectra of the chromatographically resolved HNE-MA isomers (first two peaks at 8.9 and 9.3 min) showed β-elimination fragment ions observed at m/z 189 and m/z 171 (Fig. 4). The third chromatographic peak at 9.7 min (urine), absent from the SRM chromatogram of HNE-MA, showed the greatest signal for the m/z 318 → 162 SRM transition, indicating release of mercapturate (m/z 162) from the molecular anion. This suggests that it favored retro-Michael (RM) cleavage over β-elimination upon collision-induced dissociation, presumably because it prefers the formation of an enolate (thus, setting the stage for RM) over formation of a cyclic hemiacetal or hemiketal (more resistant to RM). Because hemiketal or hemiacetal formation is less favorable for ketones than for aldehydes (34), we hypothesized that the third peak represented the MA conjugate of ONO, which is isobaric with HNE-MA. Synthetic ONO-MA indeed showed the expected retention time (9.7 min, Fig. 3B) and MS/MS spectrum (major fragment with m/z 162), which was taken as evidence for the excretion of ONO-MA in the urine (Fig. 3). ONO metabolites have not previously been reported as in vivo products of oxidative stress.
FIGURE 4.
Fragmentation patterns for each chromatographic peak of ONO-MA. A, proposed mass fragments of the hemiketal form of ONO-MA with m/z 189 (β-elimination), m/z 171 (β-elimination followed by H2O loss), and m/z 162 (mercapturate formed upon RM cleavage). B, the preferred open chain form of ONO-MA produces mass fragments with the same m/z values as the cyclic form, but the mercapturate fragment with m/z 162 is expected to predominate due to RM cleavage. C, MS/MS spectrum for the first minor peak of a standard solution of ONO-MA. The fragments with m/z 189 and m/z 171 are the most prominent. D, MS/MS spectrum recorded for the second minor ONO-MA peak, showing the m/z 171 fragment as the most abundant ion. E, MS/MS spectrum for the unique third and major peak of ONO-MA. The mercapturate peak at m/z 162 represents the most abundant fragment ion, which is suggestive of RM cleavage of the open chain form.
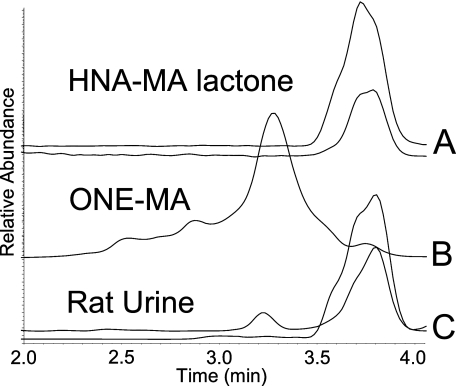
Distinction between the Isobaric Metabolites, HNA-MA Lactone, and ONE-MA—When first analyzed using chromatographic system 1, it was not possible to distinguish between the isobaric metabolites HNA-MA lactone and ONE-MA. Both compounds produced the same mercapturate fragment (m/z 162), and they co-eluted. A second chromatographic system was developed to separate the compounds (system 2). The now-resolved HNA-MA lactone differed from ONE-MA by the production of an additional fragment ion with m/z 143, which allowed the distinction between the two conjugates under the new chromatographic conditions (Fig. 5). Both MA conjugates were detected in rat urine (Fig. 5C).
FIGURE 5.
SRM chromatograms of the isobaric compounds ONE-MA and HNA-MA lactone. A, standard reaction mixture of HNA-MA, showing the lactone form and SRM transitions from top to bottom: m/z 316 → 143 and m/z 316 → 162. B, standard reaction mixture of ONE-MA, the predominant SRM transition for this compound is m/z 316 → 162. C, rat urine sample; transitions are shown from top to bottom: m/z 316 → 162 and m/z 316 → 143. These compounds were separated using chromatographic system 2.
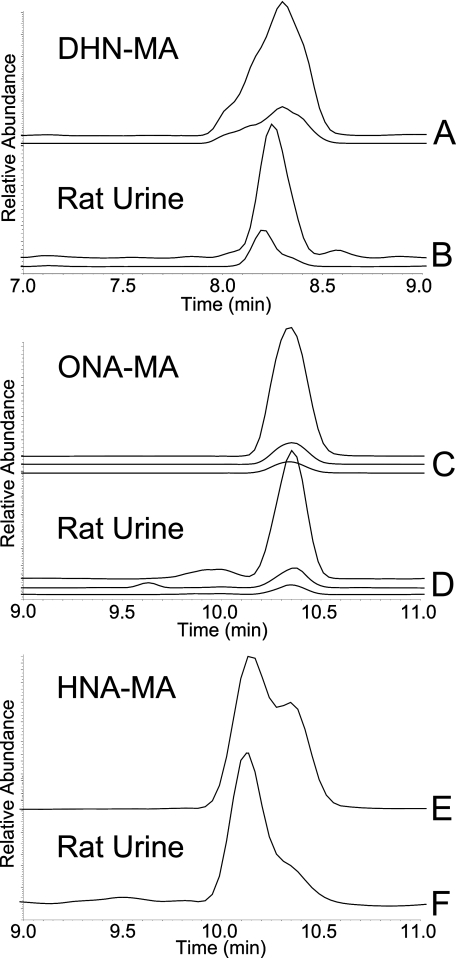
Detection of DHN-MA, ONA-MA, and HNA-MA in Rat Urine—The remaining three conjugates were readily distinguished based on their chromatographic behavior and MS/MS fragmentation (Fig. 6). DHN-MA eluted at 8.3 min, and its major fragment ions were observed with m/z 191 and m/z 143, both β-elimination fragments. ONA-MA eluted at 10.3 min and yielded fragment ions with m/z 169, m/z 162 (RM cleavage), and m/z 84. HNA-MA eluted at 10.1 min and produced a fragment ion with m/z 162, formed by RM cleavage. LC-MS/MS comparison of the synthetic conjugates with the biological samples provided confirmation of the identity of each conjugate.
FIGURE 6.
SRM chromatograms for DHN-MA, ONA-MA, and HNA-MA. A, standard reaction mixture of DHN-MA; transitions are from top to bottom: m/z 320 → 191 and m/z 320 → 143. B, rat urine sample; transitions shown are from top to bottom: m/z 320 → 191 and m/z 320 → 143. C, standard reaction mixture of ONA-MA; transitions are from top to bottom: m/z 332 → 162, m/z 332 → 169, and m/z 332 → 84. D, rat urine sample, transitions shown are from top to bottom: m/z 332 → 162, m/z 332 → 169, and m/z 332 → 84. E, standard reaction mixture of HNA-MA, transition m/z 334 → 162. F, rat urine sample, transition m/z 334 → 162.
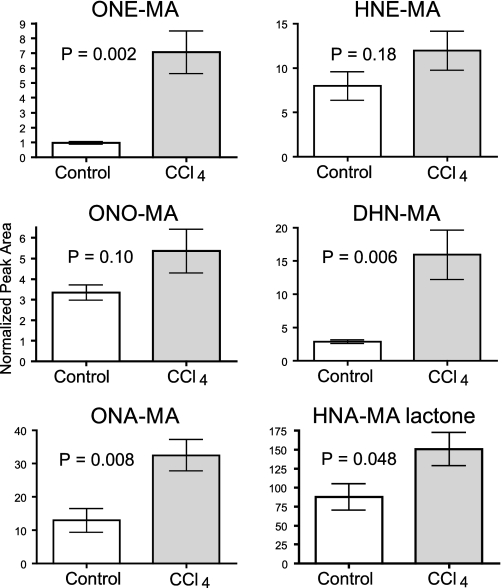
Comparison of CCl4-dosed Rats with Control Animals—CCl4 dosing caused significant increases in the levels of ONE-MA, DHN-MA, ONA-MA, and HNA-MA lactone compared with the control animals (Fig. 7). Urinary concentrations of ONO-MA, HNE-MA, and HNA-MA were elevated in the CCl4-treated rats, but the increases were not significant at the p < 0.05 level. Statistical comparisons were performed using the Student's t test, and p values for each conjugate are shown in Table 1. All calculations included normalization for creatinine levels to account for variation in urine concentration between rats. There was no difference in the creatinine levels between the treatment and control groups (p = 0.9).
FIGURE 7.
Comparison of HPNE metabolites in control rats and rats oxidatively stressed with CCl4. ONE-MA, DHN-MA, ONA-MA, and HNA-MA lactone all show a significant increase in CCl4-dosed rats with p values of 0.002, 0.006, 0.008, and 0.048, respectively. HNE-MA, ONO-MA, and HNA-MA did not increase significantly in CCl4-dosed rats. Data are shown as the mean ± S.E.
DISCUSSION
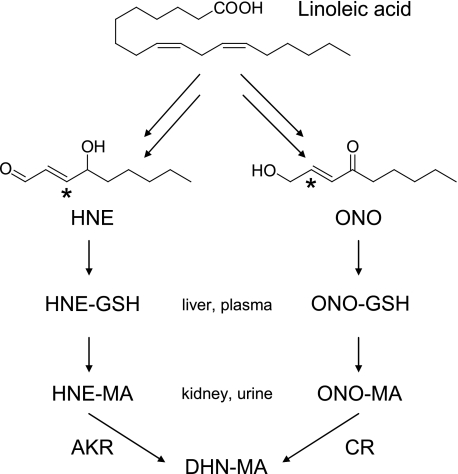
Lipid hydroperoxides, specifically hydroperoxy octadecadienoic acids (HPODEs), may be formed enzymatically through the action of lipoxygenases (35, 36) or non-enzymatically through the reaction of linoleic acid with reactive oxygen species (37). Degradation of lipid hydroperoxides yields a multitude of reactive aldehydes (38), but only HNE and, more recently, ONE have been studied extensively with regard to their detrimental effects in biological systems. HNE and ONE have been shown to cause adverse effects because of their ability to covalently bind to 2′-deoxyguanosine (39–42), to cause protein cross-linking (43), and to induce aggregation of low density lipoproteins (44). ONE shows greater toxicity in cultured cells, presumably due to its reactivity as a bifunctional electrophile (45). Furthermore, aldo-keto reductase-mediated reduction of the aldehyde functionality renders HNE inactive as a Michael acceptor, whereas ONE retains its electrophilicity after conversion into ONO, a regioisomer of HNE (Fig. 8). The formation of ONO as a reactive metabolite of ONE has received little or no attention in the literature. Moreover, it was suggested by Blair that “ONO may contribute to the biological activities that have been ascribed previously to HNE” (24). Phase-2 metabolites of ONO and HNE are difficult to distinguish from one another by LC-MS/MS due to similar chromatographic behavior, lack of mass difference, and similar MS/MS spectra. We prepared the MA adducts of HNE and ONO by chemical methods and demonstrated that at least one (set of) ONO-MA isomer can be distinguished from HNE-MA and detected in rat urine on the basis of chromatographic retention times and MS/MS fragmentation (Fig. 3). The in vivo formation of ONO-MA has not previously been reported in the literature.
FIGURE 8.
LPO-induced degradation of linoleic acid and conversion into the isobaric metabolites HNE-MA and ONO-MA. DHN-MA can be formed by aldehyde reduction of HNE-MA or ketone reduction of ONO-MA. The asterisk indicates the electrophilic position. CR, carbonyl reductase; AKR, aldo-keto reductase.
Thiadiazabicyclo-ONE-glutathione has recently been identified as a major phase-2 metabolite of ONE in cultured, immortalized endothelial (EA.hy 926) cells (46). Because the γ-glutamic acid residue of the GSH-ONE adduct participates in cyclization, the bicyclic thiadiazabicyclo-ONE-glutathione metabolite cannot be further metabolized to an MA adduct of ONE or its derivatives. Our data indicate that ONE is produced in vivo and undergoes phase-2 metabolism to form ONE-MA (Fig. 5), which would compete with thiadiazabicyclo-ONE-glutathione formation. Furthermore, our data also indicate that ONE-MA is metabolized to the corresponding carboxylic acid, ONA-MA, based on LC-MS/MS comparison with a synthetic sample of ONA-MA (Fig. 6). At present it is not known whether the oxidation of the aldehyde functionality precedes or follows the conjugation reaction because ONA retains its ability to form a conjugate with GSH. Like ONO-MA, ONE-MA and ONA-MA have not previously been reported as in vivo metabolites.
To determine whether the formation of HNE and ONE increases under conditions of oxidative stress in vivo, we measured the MA conjugates of these LPO products in the urine of rats exposed to CCl4 and in the urine of control animals. CCl4 is known for its ability to cause LPO in the liver through the formation of the trichloromethyl radical (CCl ·3) via cytochrome P450-mediated homolytic cleavage of the carbon-chlorine bond (47–49). The CCl ·3 radical can form chloroform by abstracting a hydrogen from the bisallylic methylene functionality in polyunsaturated fatty acids, thereby forming lipid-based radicals that spontaneously react with molecular oxygen to form regioisomeric lipid hydroperoxides, e.g. 9-hydroperoxy-10,12-octadecadienoic acid (9-HPODE) and 13-hydroperoxy-9,11-octadecadienoic acid (13-HPODE) from linoleic acid. Alternatively or additionally, CCl ·3 may directly react with molecular oxygen to give trichloromethyl peroxy radicals (CCl3OO·), a reactive species considered by some authors to produce HPODEs (47–49). Subsequently, these HPODEs are converted into carbon-carbon cleavage products, such as HPNE, HNE, and ONE (50). Regardless of the precise mechanism of CCl4-induced LPO, acute CCl4 poisoning is an accepted model of in vivo oxidative stress and LPO. For instance, HNE-deoxyguanosine adducts have been shown to have significantly increased levels in F344 rats treated with CCl4 as compared with control animals (39, 42).
In our studies the urinary levels of the HNE metabolites DHN-MA and HNA-MA lactone and the levels of the ONE metabolites ONE-MA and ONA-MA were significantly higher in the CCl4-treated rats compared with the control animals (Fig. 7). The urinary levels of HNE-MA and ONO-MA were higher in the CCl4-treated rats, but the difference was not statistically significant at p < 0.05 (p = 0.18 and p = 0.10, respectively). This is an unexpected finding because HNE is generally considered to be a marker of LPO and in vivo oxidative stress. It is conceivable that the lack of statistical difference is due to inter-individual variation in the metabolism of HNE conjugates to form DHN and HNA conjugates. Similarly, ONO-MA may be converted into DHN-MA by carbonyl reductase (22). Our semiquantitative data (normalized peak areas), however, suggest that oxidation of the aldehyde functionality in the HNE and ONE conjugates is the preferred metabolic pathway because HNA-MA lactone and ONA-MA are among the most abundant end products of HPNE metabolism (Fig. 7).
The arachidonic acid-derived F2α-isoprostanes are generally considered to be the most reliable markers of in vivo oxidative stress. The value of F2α-isoprostanes as oxidative stress markers in humans is exemplified by studies of smokers (51, 52), patients with renal failure (53), patients with coronary artery disease (54), and patients with lupus erythematosus (55). Kadiiska et al. (56) observed a significant increase in the urinary concentrations of F2α-isoprostanes in rats injected intraperitoneally with 120 or 1200 mg/kg of CCl4 compared with control animals. Sicilia et al. (57) reported elevated F2α-isoprostanes levels in liver and kidney tissue of rats after an oral CCl4 dose of 1 ml/kg. However, these authors observed no statistical difference between the urinary levels of F2α-isoprostanes obtained from treated and control animals in the same study (57), which they attributed to kinetic differences between oral gavage and the intraperitoneal administration used by Kadiiska et al. (56). Our findings indicate that the end products of HPNE metabolism are elevated in urine obtained from CCl4-treated rats, which holds promise for these metabolites as additional or alternative markers of oxidative stress in animals and humans.
This work was supported, in whole or in part, by National Institutes of Health Grants R01HL081721, S10RR022589, and P30ES000210. This work was also supported by the Medical Research Foundation of Oregon. The costs of publication of this article were defrayed in part by the payment of page charges. This article must therefore be hereby marked “advertisement”in accordance with 18 U.S.C. Section 1734 solely to indicate this fact.
Footnotes
The abbreviations used are: LPO, lipid peroxidation; HNE, 4-hydroxy-2-nonenal; HPNE, 4-hydroperoxy-2-nonenal; GST, glutathione S-transferase; HNA, 4-hydroxy-2-nonenoic acid; DHN, 1,4-dihydroxy-2-nonene; GSH, glutathione; MA, mercapturic acid; ONE, 4-oxo-2-nonenal; ONO, 4-oxo-2-nonen-1-ol; ONA, 4-oxo-2-nonenoic acid; SRM, selected reaction monitoring; RM, retro-Michael; HPODE, hydroperoxy octadecadienoic acid; LC, liquid chromatography; MS, mass spectrometry; HPLC, high performance liquid chromatography.
References
- 1.Butterfield, D. A., and Sultana, R. (2007) J. Alzheimer's Dis. 12 61–72 [DOI] [PubMed] [Google Scholar]
- 2.Picklo, M. J. S., and Montine, T. J. (2007) J. Alzheimer's Dis. 12 185–193 [DOI] [PubMed] [Google Scholar]
- 3.Lovell, M. A., and Markesbery, W. R. (2007) Nucleic Acids Res. 35 7497–7504 [DOI] [PMC free article] [PubMed] [Google Scholar]
- 4.Spiteller, G. (2007) Mol. Biotechnol. 37 5–12 [DOI] [PubMed] [Google Scholar]
- 5.Benedetti, A., Comporti, M., and Esterbauer, H. (1980) Biochim. Biophys. Acta 620 281–296 [DOI] [PubMed] [Google Scholar]
- 6.Esterbauer, H., Schaur, R. J., and Zollner, H. (1991) Free Radic. Biol. Med. 11 81–128 [DOI] [PubMed] [Google Scholar]
- 7.Schneider, C., Tallman, K. A., Porter, N. A., and Brash, A. R. (2001) J. Biol. Chem. 276 20831–20838 [DOI] [PubMed] [Google Scholar]
- 8.Amunom, I., Stephens, L. J., Tamasi, V., Cai, J., Pierce, W. M. J., Conklin, D. J., Bhatnagar, A., Srivastava, S., Martin, M. V., Guengerich, F. P., and Prough, R. A. (2007) Arch. Biochem. Biophys. 464 187–196 [DOI] [PMC free article] [PubMed] [Google Scholar]
- 9.Mitchell, D. Y., and Petersen, D. R. (1987) Toxicol. Appl. Pharmacol. 87 403–410 [DOI] [PubMed] [Google Scholar]
- 10.Alary, J., Bravais, F., Cravedi, J. P., Debrauwer, L., Rao, D., and Bories, G. (1995) Chem. Res. Toxicol. 8 34–39 [DOI] [PubMed] [Google Scholar]
- 11.Srivastava, S., Dixit, B. L., Cai, J., Sharma, S., Hurst, H. E., Bhatnagar, A., and Srivastava, S. K. (2000) Free Radic. Biol. Med. 29 642–651 [DOI] [PubMed] [Google Scholar]
- 12.Agianian, B., Tucker, P. A., Schouten, A., Leonard, K., Bullard, B., and Gros, P. (2003) J. Mol. Biol. 326 151–165 [DOI] [PubMed] [Google Scholar]
- 13.Knoll, N., Ruhe, C., Veeriah, S., Sauer, J., Glei, M., Gallagher, E. P., and Pool-Zobel, B. L. (2005) Toxicol. Sci. 86 27–35 [DOI] [PubMed] [Google Scholar]
- 14.Gallagher, E. P., Huisden, C. M., and Gardner, J. L. (2007) Toxicol. In Vitro 21 1365–1372 [DOI] [PMC free article] [PubMed] [Google Scholar]
- 15.Alary, J., Debrauwer, L., Fernandez, Y., Cravedi, J. P., Rao, D., and Bories, G. (1998) Chem. Res. Toxicol. 11 130–135 [DOI] [PubMed] [Google Scholar]
- 16.Alary, J., Gueraud, F., and Cravedi, J. P. (2003) Mol. Aspects Med. 24 177–187 [DOI] [PubMed] [Google Scholar]
- 17.de Zwart, L. L., Hermanns, R. C., Meerman, J. H., Commandeur, J. N., and Vermeulen, N. P. (1996) Xenobiotica 26 1087–1100 [DOI] [PubMed] [Google Scholar]
- 18.Völkel, W., Alvarez-Sánchez, R., Weick, I., Mally, A., Dekant, W., and Pähler, A. (2005) Free Radic. Biol. Med. 38 1526–1536 [DOI] [PubMed] [Google Scholar]
- 19.Orioli, M., Aldini, G., Benfatto, M. C., Facino, R. M., and Carini, M. (2007) Anal. Chem. 79 9174–9184 [DOI] [PubMed] [Google Scholar]
- 20.Lee, S. H., and Blair, I. A. (2000) Chem. Res. Toxicol. 13 698–702 [DOI] [PubMed] [Google Scholar]
- 21.Jian, W., Arora, J. S., Oe, T., Shuvaev, V. V., and Blair, I. A. (2005) Free Radic. Biol. Med. 39 1162–1176 [DOI] [PubMed] [Google Scholar]
- 22.Doorn, J. A., Maser, E., Blum, A., Claffey, D. J., and Petersen, D. R. (2004) Biochemistry 43 13106–13114 [DOI] [PubMed] [Google Scholar]
- 23.Doorn, J. A., Srivastava, S. K., and Petersen, D. R. (2003) Chem. Res. Toxicol. 16 1418–1423 [DOI] [PubMed] [Google Scholar]
- 24.Blair, I. A. (2006) Curr. Drug Metab. 7 853–872 [DOI] [PubMed] [Google Scholar]
- 25.Doorn, J. A., Hurley, T. D., and Petersen, D. R. (2006) Chem. Res. Toxicol. 19 102–110 [DOI] [PubMed] [Google Scholar]
- 26.Halliwell, B., and Gutteridge, J. (1999) Free Radicals in Biology and Medicine, 3rd Ed., pp. 547–552, Oxford University Press, London
- 27.Milne, G. L., Yin, H., Brooks, J. D., Sanchez, S., Roberts, L. J., Jr., and Morrow, J. D. (2007) Methods Enzymol. 433 113–126 [DOI] [PubMed] [Google Scholar]
- 28.Gardner, H. W., Bartelt, R. J., and Weisleder, D. (1992) Lipids 27 686–689 [Google Scholar]
- 29.Annangudi, S. P., Sun, M., and Salomon, R. G. (2005) Synlett. 9 1468–1470 [Google Scholar]
- 30.Zhang, W. H., Liu, J., Xu, G., Yuan, Q., and Sayre, L. M. (2003) Chem. Res. Toxicol. 16 512–523 [DOI] [PubMed] [Google Scholar]
- 31.Hermanson, G. T. (1996) Bioconjugate Techniques, p. 186, Academic Press, Inc., San Diego, CA
- 32.Chung, H., Hong, D. P., Jung, J. Y., Kim, H. J., Jang, K. S., Sheen, Y. Y., Ahn, J. I., Lee, Y. S., and Kong, G. (2005) Toxicol. Appl. Pharmacol. 206 27–42 [DOI] [PubMed] [Google Scholar]
- 33.Srinivasan, R., Chandrasekar, M. J., Nanjan, M. J., and Suresh, B. (2007) J. Ethnopharmacol. 113 284–291 [DOI] [PubMed] [Google Scholar]
- 34.Roberts, J. D., and Caserio, M. C. (1977) Basic Principles of Organic Chemistry, 2nd Ed., p. 624, W. A. Benjamin, Inc., Menlo Park, CA
- 35.Brash, A. R. (1999) J. Biol. Chem. 274 23679–23682 [DOI] [PubMed] [Google Scholar]
- 36.Hamberg, M., and Samuelsson, B. (1967) J. Biol. Chem. 242 5329–5335 [PubMed] [Google Scholar]
- 37.Marnett, L. J. (2000) Carcinogenesis 21 361–370 [DOI] [PubMed] [Google Scholar]
- 38.Spiteller, G. (1998) Chem. Phys. Lipids 95 105–162 [DOI] [PubMed] [Google Scholar]
- 39.Chung, F. L., Nath, R. G., Ocando, J., Nishikawa, A., and Zhang, L. (2000) Cancer Res. 60 1507–1511 [PubMed] [Google Scholar]
- 40.Douki, T., Odin, F., Caillat, S., Favier, A., and Cadet, J. (2004) Free Radic. Biol. Med. 37 62–70 [DOI] [PubMed] [Google Scholar]
- 41.Lee, S. H., and Blair, I. A. (2001) Trends Cardiovasc. Med. 11 148–155 [DOI] [PubMed] [Google Scholar]
- 42.Wacker, M., Wanek, P., and Eder, E. (2001) Chem. Biol. Interact. 137 269–283 [DOI] [PubMed] [Google Scholar]
- 43.Stewart, B. J., Doorn, J. A., and Petersen, D. R. (2007) Chem. Res. Toxicol. 20 1111–1119 [DOI] [PubMed] [Google Scholar]
- 44.Hoff, H. F., and O'Neil, J. (1993) J. Lipid Res. 34 1209–1217 [PubMed] [Google Scholar]
- 45.Lin, D., Lee, H. G., Liu, Q., Perry, G., Smith, M. A., and Sayre, L. M. (2005) Chem. Res. Toxicol. 18 1219–1231 [DOI] [PubMed] [Google Scholar]
- 46.Jian, W., Lee, S. H., Mesaros, C., Oe, T., Elipe, M. V., and Blair, I. A. (2007) Chem. Res. Toxicol. 20 1008–1018 [DOI] [PubMed] [Google Scholar]
- 47.Brent, J. A., and Rumack, B. H. (1993) J. Toxicol. Clin. Toxicol. 31 173–196 [DOI] [PubMed] [Google Scholar]
- 48.McGregor, D., and Lang, M. (1996) Mutat. Res. 366 181–195 [DOI] [PubMed] [Google Scholar]
- 49.Comporti, M. (1989) Chem. Biol. Interact. 72 1–56 [DOI] [PubMed] [Google Scholar]
- 50.Schneider, C., Boeglin, W. E., Yin, H., Ste, D. F., Hachey, D. L., Porter, N. A., and Brash, A. R. (2005) Lipids 40 1155–1162 [DOI] [PubMed] [Google Scholar]
- 51.Yin, H., Gao, L., Tai, H. H., Murphey, L. J., Porter, N. A., and Morrow, J. D. (2007) J. Biol. Chem. 282 329–336 [DOI] [PubMed] [Google Scholar]
- 52.Bruno, R. S., Leonard, S. W., Atkinson, J., Montine, T. J., Ramakrishnan, R., Bray, T. M., and Traber, M. G. (2006) Free Radic. Biol. Med. 40 689–697 [DOI] [PubMed] [Google Scholar]
- 53.Wiswedel, I., Hirsch, D., Carluccio, F., Hampl, H., and Siems, W. (2005) Biofactors 24 201–208 [DOI] [PubMed] [Google Scholar]
- 54.Shishehbor, M. H., Zhang, R., Medina, H., Brennan, M. L., Brennan, D. M., Ellis, S. G., Topol, E. J., and Hazen, S. L. (2006) Free Radic. Biol. Med. 41 1678–1683 [DOI] [PMC free article] [PubMed] [Google Scholar]
- 55.Abou-Raya, A., el-Hallous, D., and Fayed, H. (2004) Clin. Investig. Med. 27 306–311 [PubMed] [Google Scholar]
- 56.Kadiiska, M. B., Gladen, B. C., Baird, D. D., Germolec, D., Graham, L. B., Parker, C. E., Nyska, A., Wachsman, J. T., Ames, B. N., Basu, S., Brot, N., Fitzgerald, G. A., Floyd, R. A., George, M., Heinecke, J. W., Hatch, G. E., Hensley, K., Lawson, J. A., Marnett, L. J., Morrow, J. D., Murray, D. M., Plastaras, J., Roberts, L. J. 2nd, Rokach, J., Shigenaga, M. K., Sohal, R. S., Sun, J., Tice, R. R., Van Thiel, D. H., Wellner, D., Walter, P. B., Tomer, K. B., Mason, R. P., and Barrett, J. C. (2005) Free Radic. Biol. Med. 38 698–710 [DOI] [PubMed] [Google Scholar]
- 57.Sicilia, T., Mally, A., Schauer, U., Pähler, A., and Völkel, W. (2008) J. Chromatogr. B Analyt. Technol. Biomed. Life Sci. 861 48–55 [DOI] [PubMed] [Google Scholar]


