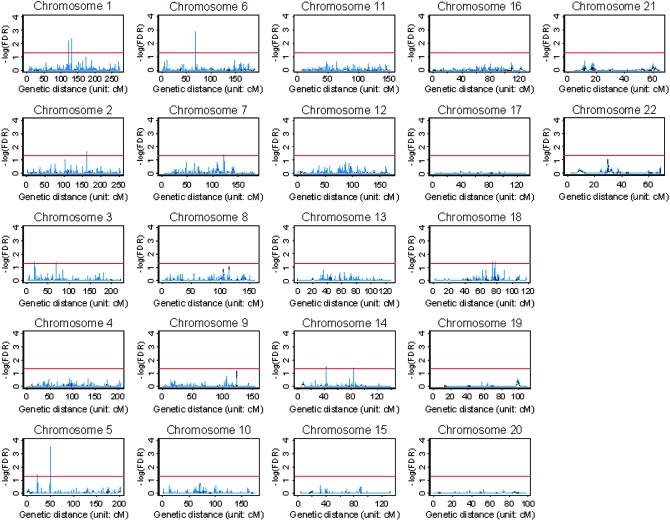
Figure 6.—
Genome-wide association scans of alcoholism data. The horizontal axis is the genetic distance in centimorgans. The vertical axis is the false discovery rate (FDR) of the FBAT in −log10. The red reference line denotes the significance threshold of −log10(FDR) = 1.30, i.e., FDR = 0.05. The black dashed line represents −log10 (FDR) of the single-locus FBAT and the blue solid line denotes −log10(FDR) of the multilocus KBAT.

