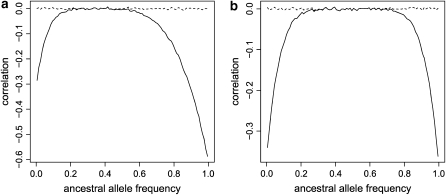
Figure 4.—
Plot of the correlation coefficient between allele frequencies of two populations for unbiased (dashed lines) and biased (with hl = 1 and fl = 1, solid lines) data sets against the ancestral allele frequency. We simulated 30 individuals and FST = 0.2 in each population for FIS = 0.1 (a) and FIS = 0.9 (b).

