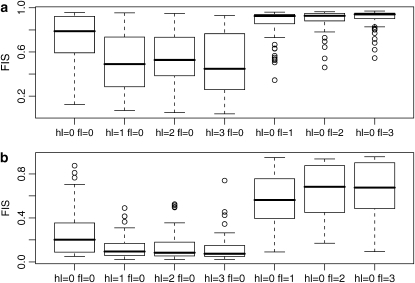
Figure 6.—
Comparison of the estimates of FIS based on 50 replicates of different data sets with the ascertainment bias hl and fl varying independently from 0 to 3. Estimates are made under the assumption that there is no ascertainment bias (supposing that hl = 0 and fl = 0). (a) FIS is fixed to 0.8; (b) FIS is fixed to 0.2. Simulated data sets consist of five populations and 100 loci, FST = 0.25, and a sample size of 30 individuals per population.

