

Abstract
Background
The complexity of ablation for atrial macro-reentry (AFL) varies significantly depending upon the circuit location. Presently, surface ECG analysis poorly separates left from right atypical AFL and from some cases of typical AFL, delaying diagnosis until invasive study.
Objective
To differentiate and localize the intra-atrial circuits of left atypical AFL, right atypical, and typical AFL using quantitative ECG analysis.
Methods
We studied 66 patients (54 M, age 59±14 years) with typical (n=35), reverse typical (n=4) and atypical (n=27) AFL. For each, we generated filtered atrial waveforms from ECG leads V5 (X-axis), aVF (Y) and V1 (Z) by correlating a 120 ms F-wave sample to successive ECG regions. Atrial spatial loops were plotted for 3 orthogonal planes (frontal, XY=V5/aVF; sagittal, YZ=aVF/V1; axial, XZ=V5/V1), then cross-correlated to measure spatial regularity (‘coherence’: range −1 to 1).
Results
Mean coherence was greatest in the XY plane (p<10−3 vs XZ or YZ). Atypical AFL showed lower coherence than typical AFL in XY (p<10−3), YZ (p<10−6) and XZ (p<10−5) planes. Atypical left AFL could be separated from atypical right AFL by lower XY coherence (p=0.02); for this plane coherence < 0.69 detected atypical left AFL with 84% specificity and 75% sensitivity. F-wave amplitude did not separate typical, atypical right or atypical left AFL (p=NS).
Conclusions
Atypical AFL shows lower spatial coherence than typical AFL, particularly in sagittal and axial planes. Coherence in the Cartesian frontal plane separated left and right atypical AFL. Such analyses may be used to plan ablation strategy from the bedside.
Keywords: Atrial Flutter, Mapping, Vectorcardiography, Electrocardiogram, Electrophysiologic study, Signal Processing
Introduction
Many approaches can be used to localize the circuits of typical and atypical (non-subeustachian isthmus-dependent) atrial flutter (AFL) at invasive electrophysiology study (1). Potentially, diagnosing atypical AFL from the surface ECG could identify the need for high-resolution mapping, and identifying left AFL circuits a priori could help plan the need for transseptal cannulation. However, the characteristic F-waves of typical and reverse typical AFL (1) alter with left atrial (LA) enlargement, heart failure (2) or prior ablation (3). Moreover, in the absence of typical F-waves, AFL localization is imprecise (4,5), and many atypical AFL circuits can mimic ‘typical’ F-waves (4). Even features such as F-wave polarity may be misleading since, for example, positive F-waves in V1 occur both in typical AFL in the right atrium (RA) (1) and with atypical AFL in the LA (6,7). For left-sided atypical AFL, F-waves may have lower amplitude (5), but this has not been tested as a means of localizing the circuit from the ECG.
We hypothesized that identifying planes of reproducible atrial activation may separate atypical left AFL, atypical right AFL and typical AFL. Although macro-reentry in AFL is precisely timed (8), we (9,10) and others (11) have quantified subtle timing variability with distance from the circuit. We reasoned that it should be possible to construct functional ECG loops to locate an AFL circuit based upon the plane of greatest spatiotemporal regularity, versus planes of greater variability, irrespective of F-wave shape (12).
We tested our hypothesis by analyzing planes of greatest atrial spatiotemporal regularity (quantified as ‘coherence’) for 66 patients referred for AFL ablation compared to the actual AFL circuit location from precise intra-atrial mapping prior to successful ablation.
Methods
We studied 66 consecutive patients (54 males, average age 59±14) referred for catheter ablation at University of California (UCSD) and Veterans’ Affairs (VAMC) Medical Centers, San Diego. The study was approved by the joint UCSD/VAMC Institutional Review Board. For this pilot study, we excluded patients with prior ablation for atrial fibrillation. All patients had been anti-coagulated or lacked thrombus on transesophageal echocardiography, and most had failed one or more anti-arrhythmic medications (Table 1). Separate analyses have been reported previously in a subset of these patients (9).
Table 1.
Clinical Characteristics
| Typical (n=39) | Atypical (n=27) | p | |
|---|---|---|---|
| Age/years | 59 ± 14 | 58 ± 15 | NS |
| AFL CL/ms | 247 ± 31 | 284 ± 48 | < 0.01 |
| Ventricular CL/ms | 618 ± 201 | 655 ± 220 | NS |
| Atrio:Ventricular ratio | 2.5 ± 0.8 | 2.3 ± 0.7 | NS |
| LA diameter/mm | 39 ± 9 | 44 ± 7 | NS |
| LVEF/% | 58 ± 17 | 55 ± 12 | NS |
| NYHA Class ≥ II | 0 | 3 | NS |
| Prior Cardiac Surgery | 6 | 12 | < 0.01 |
| Medications | |||
| Anti-arrhythmic* | 22 | 9 | NS |
| Rate-slowing† | 25 | 12 | NS |
| Hypertension | 18 | 8 | NS |
| Diabetes Mellitus | 7 | 4 | NS |
Key: CL, Cycle length; LA, Left atrial; LVEF, Left ventricular ejection fraction; NYHA, New York Heart Association Heart Failure Class;
Therapy with class I or class III agents;
Therapy with β-blocker or calcium antagonists.
Diagnosis at Electrophysiologic Study (EPS)
Electrophysiology study (EPS) was performed in the fasted state, at least 5 half-lives after discontinuing all anti-arrhythmic medications. A 6F decapolar catheter was advanced to the coronary sinus (CS) via the right internal jugular vein, and 6F quadrapolar catheters were advanced to the His bundle and right atrium (RA) via femoral veins. Trans-septal cannulation was used to map AFL in the left atrium (LA).
Typical (subeustachian isthmus-dependent) AFL (1) was diagnosed by counter-clockwise activation around the tricuspid annulus (clockwise in reverse typical), and concealed entrainment during pacing from the cavotricuspid isthmus (CTI). Diagnosis was further confirmed by the inability to re-induce AFL after creating bi-directional block across the CTI by ablation. Atypical (non-subeustachian dependent) AFL was diagnosed by a distinct activation pattern, concealed entrainment at sites of earliest activation or double potentials, and successful ablation outside the CTI. Mapping and ablation of atypical AFL was assisted by electroanatomic mapping (Carto™, Biosense-Webster, CA) in 16 cases. Atrial fibrillation (AF) was excluded by 1:1 capture of all atrial sites and successful ablation without atrial compartmentalization at non-pulmonary venous sites (1). When multiple AFL circuits were present, the ECGs and simultaneous intra-cardiac electrograms of the rhythm that was categorically entrained, localized and ablated were used for this study.
Acquisition of ECG Data
Standard surface ECGs recordings of 10-second duration of the index arrhythmia were obtained at EPS from a digital physiologic recording system (Bard Inc., Billerica, MA, USA). This system uses analog bandpass filters, passing signals between 0.05 and 100 Hz, with digitization at 1kHz to 16-bit resolution.
ECG Analysis: Derivation of Correlation Time Series
The method for deriving the correlation time series has been described (7,9). Briefly, we wrote software in Labview (National Instruments, TX) that automatically selects a 120 ms F-wave template. This template was compared to 120 ms segments from the parent ECG at successive time-points (every 1 ms) and the Pearson correlation was computed for each. The resulting correlation time series depicts atrial activity (15), unlike QRS subtraction that cannot be applied to AFL because of the consistent timing between F waves and QRS complexes (13). This process was repeated for each ECG lead.
ECG Analysis: Atrial Spatial and Temporal Coherence
We used simultaneous correlation series in orthogonal leads to plot atrial spatiotemporal loops in the Cartesian XY (V5/aVF), YZ (aVF/V1) and XZ (V5/V1) planes. Loops are more reproducible in typical than atypical AFL (9). To quantify reproducibility, we defined spatiotemporal ‘coherence’ for loops (range −1 to 1) as the Pearson cross-correlation, shown below in {1},
| {1} |
where N = the total time series length, A = the atrial waveform for one axis, B = the atrial waveform for a different axis, and i delineates successive time points. To optimally identify all AFL circuit locations, we computed coherence in the Cartesian frontal (XY), sagittal (YZ) and axial (XZ) planes, and also the 30° ‘left rotated’ planes (XY: aVL/II; YZ: II/V1; XZ: aVL/V1), and 30° ‘right-rotated’ planes (XY: aVR/III; YZ: III/V1; XZ: aVR/V1).
F-wave Amplitudes
We measured peak-to-peak F-wave amplitudes wave in the Cartesian axes, excluding F-waves that overlapped the T-wave or were noisy. We evaluated whether smaller F-waves (for example, in LA AFL (5)) may explain lower coherence (regularity), and vice versa, by computing the product of F-wave amplitudes for both axes of each Cartesian plane. This product was compared to the coherence value for that plane.
Statistical Analysis
Central tendency of continuous data was estimated as mean ± standard deviation (SD), using the Bonferroni correction for multiple comparisons. To localize left atypical, right atypical and typical AFL, we generated receiver-operator-curves (ROC) of spatiotemporal coherence for each plane.
Results
Based upon the location of concealed entrainment and successful ablation, 39 patients had typical AFL (including 4 reverse typical), and 27 had atypical AFL (19 right-sided, 8 left-sided). Their clinical characteristics are shown in Table 1.
Spatiotemporal Loops in Typical Versus Atypical AFL
Figure 1 shows representative spatiotemporal loops of atrial activity for a patient with typical and atypical AFL. Loop trajectories in typical AFL lie closer to the line of identity (e.g. X=Y), reflecting higher coherence (fig. 1A). By contrast, loop trajectories in atypical AFL show lower coherence that reflects subtle timing variability distant to the reentry circuit (9–11) (fig. 1B). Figure 2 shows an example of a patient whose ECG F-waves suggested typical AFL, but in whom spatiotemporal loops were not coherent. Electroanatomic mapping confirmed atypical AFL (lower loop reentry) that was successfully ablated.
Figure 1. Atrial Spatiotemporal Loops for (A) typical AFL and (B) atypical AFL.
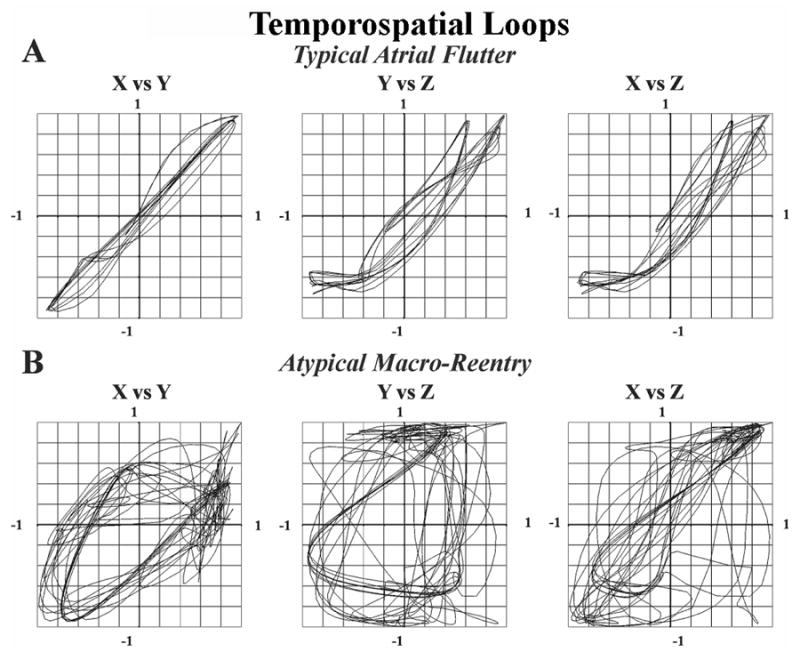
Coherence values were higher for typical than atypical AFL.
Figure 2. ECG Spatiotemporal Loops for Lower Loop Reentry (RA Atypical AFL).
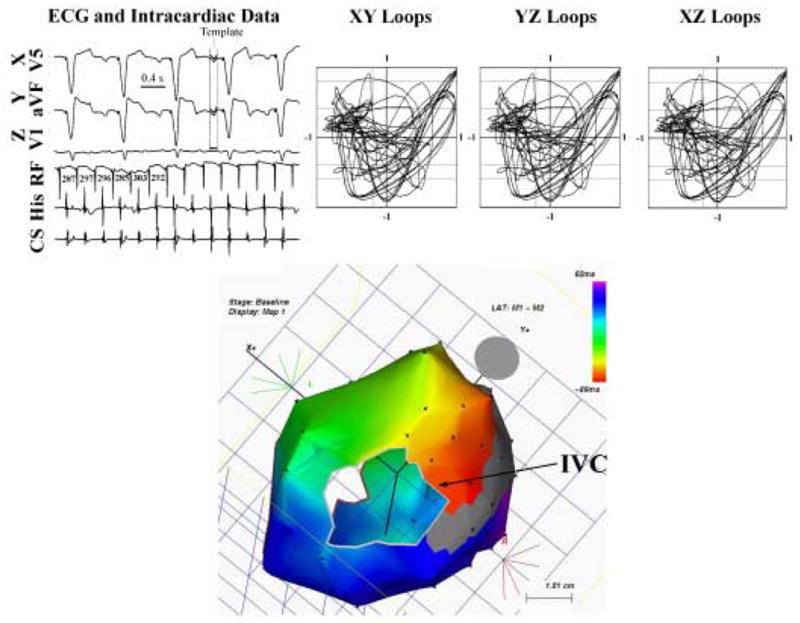
The ECG appearance suggests typical AFL (4) and ventricular pacing, yet spatiotemporal loops in the Cartesian axes are inconsistent with typical AFL, with coherence values of 0.98 (XY), 0.38 (YZ) and 0.42 (XZ). Electroanatomic (Carto™) mapping revealed lower loop reentry that was successfully ablated.
Spatiotemporal Coherence of Atypical Versus Typical AFL
Spatiotemporal loops had lower coherence for atypical than typical AFL in all planes (Fig. 3). Figure 3A shows coherence for the Cartesian planes. For both groups, coherence was higher in the XY plane (p<10−3 vs XZ or YZ). Notably, XY plane coherence was lower for atypical than typical AFL (0.65±0.34 vs 0.85±0.10; p<10−3). This separation was more pronounced in the YZ plane (atypical: 0.28±0.45 vs. typical: 0.72±0.18; p<10−6) and XZ plane (atypical: 0.28±0.46 vs. typical: 0.73±0.21; p<10−5). Coherence values for left and right rotated planes are shown in Fig. 3B and 3C, with highest coherence in the XY plane for each. Cartesian and right-rotated axes best identified the stereotypical right atrial activation in typical AFL from the variability in atypical AFL (p<10−3 in each plane).
Figure 3.
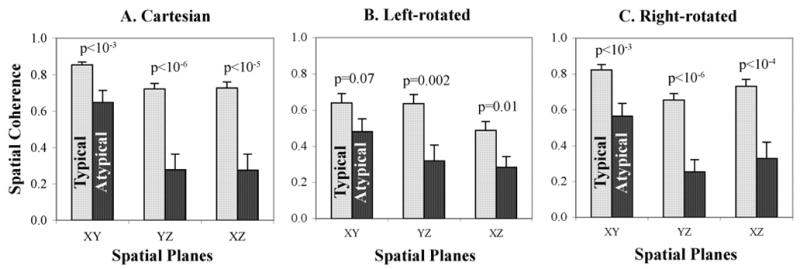
Greater Spatiotemporal Coherence for Typical (light bars) versus Atypical (dark bars) AFL in (A) Cartesian (X=V1; Y=aVF; Z=V1); (B) Left-Rotated (X=aVL; Y=II; Z=V1); (C) Right-rotated (X=aVR; Y=III; Z=V1) axes. In addition, coherence values were significantly higher for XY than other planes for both types of AFL using all coordinate sets. Standard error of the mean is indicated above each bar.
Left Atrial Compared to Right Atrial Atypical AFL
Atypical AFL plane coherence differed for left versus right atrial circuits (Fig. 4). Left atrial atypical AFL showed lower coherence than right atrial atypical AFL in the Cartesian XY plane (p=0.02), and left-rotated XZ plane (p=0.02). LA atypical AFL was most regular (greatest coherence) in the left-rotated XY plane (aVL/II; 0.66±0.19; p<0.01 vs aVL/V1, II/V1).
Figure 4.
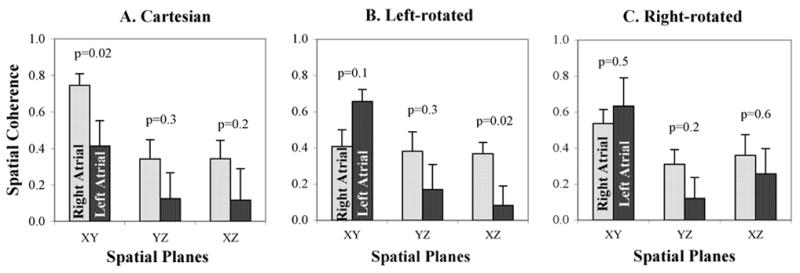
Spatiotemporal Coherence for Atypical AFL located in the Right Atrium (light bars) and Left Atrium (dark bars) for (A) Cartesian; (B) Left-Rotated; and (C) Right-Rotated axes. LA and RA atypical AFL were optimally separated by coherence in the Left rotated XZ and Cartesian XY planes (p<0.05 for each). Standard error of the mean is indicated above each bar.
F-wave Amplitudes
Table 2 shows F-wave amplitudes for typical and atypical AFL in the Cartesian axes. Seven patients with typical AFL were excluded because every F-wave overlay an ECG QRS or T-wave. There was no significant difference between F-wave amplitudes for typical versus atypical AFL in any Cartesian axis. Table 3 shows that F-wave amplitudes were lower for LA than RA atypical AFL but, again, these differences were not statistically significant. Plane coherence was not determined by F-wave amplitudes, since the product of F-wave amplitudes in the axes of each Cartesian plane correlated poorly and non-significantly with the plane coherence (XY: r = 0.16; XY: r = 0.21; XY: r = 0.26; p=NS for each).
Table 2.
Peak-to-Peak F-wave Amplitudes
| Axis | Typical (n=32)* | Atypical (n=27) | P Value |
|---|---|---|---|
| X (V5) | 0.18 ± 0.09 mV | 0.15 ± 0.08 mV | 0.18 |
| Y (aVF) | 0.29 ± 0.14 mV | 0.24 ± 0.13 mV | 0.18 |
| X (V1) | 0.20 ± 0.08 m V | 0.21 ± 0.12 mV | 0.68 |
7 patients were excluded because the F-waves completely overlay QRS/T-waves
Table 3.
Peak-to-Peak F-wave Amplitudes for Atypical AFL
| Axis | Right-sided (n=15) | Left-sided (n=8) | P Value |
|---|---|---|---|
| X (V5) | 0.17 ± 0.08 mV | 0.11 ± 0.09 mV | 0.11 |
| Y (aVF) | 0.27 ± 0.12 mV | 0.19 ± 0.15 mV | 0.18 |
| X (V1) | 0.24 ± 0.11 m V | 0.17 ± 0.12 mV | 0.18 |
Receiver-Operator Curves (ROC)
We used ROC analysis to separate AFL circuit locations using ECG spatiotemporal coherence. Figure 5 shows ROC analyses for Cartesian plane coherence to separate atypical from typical AFL. Areas under each ROC curve are summarized in Table 4, ranging from 0.66–0.82 with highest ROC areas for the Cartesian YZ and XZ planes, and the right-rotated YZ plane. In the YZ plane, a coherence cutpoint < 0.47 successfully detected atypical AFL with 90% specificity and 56% sensitivity. In the XZ plane, a coherence cutpoint < 0.53 successfully detected atypical AFL with 87% specificity and 63% sensitivity.
Figure 5.
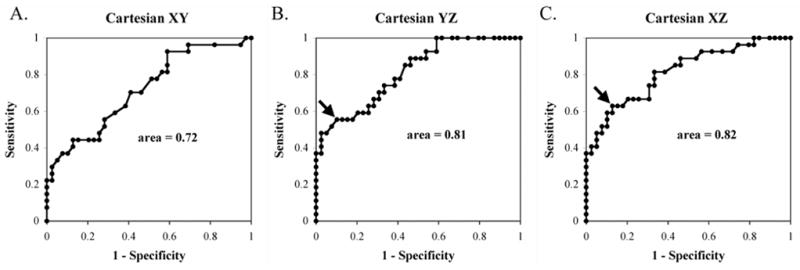
Receiver-operator-curves for diagnosing Atypical from Typical AFL using spatial coherence in the Cartesian XY, YZ and XZ planes. Arrows indicate the locations of cutpoints: for the YZ plane, coherence < 0.47 detected atypical AFL with 90% specificity and 56% sensitivity and for XZ plane, coherence < 0.53 detected atypical AFL with 87% specificity and 63% sensitivity.
Table 4.
Area Under ROC Curves: Spatiotemporal Coherence for Atypical AFL
| Plane | Cartesian | Left-Rotated | Right-Rotated |
|---|---|---|---|
| XY | 0.72 ± 0.07 | 0.66 ± 0.07 | 0.76 ± 0.06 |
| YZ | 0.81 ± 0.06 | 0.72 ± 0.07 | 0.81 ± 0.06 |
| XZ | 0.82 ± 0.06 | 0.68 ± 0.07 | 0.79 ± 0.06 |
Figure 6 shows ROC analyses for the separation of left atrial from right atrial atypical AFL. As shown, left and right atrial atypical AFL were well-separated using the Cartesian XY plane (ROC area = 0.83) and the left-rotated XZ plane (ROC area = 0.77). For the Cartesian XY plane a coherence cutpoint < 0.69 detected LA flutter with 84% specificity and 75% sensitivity.
Figure 6.
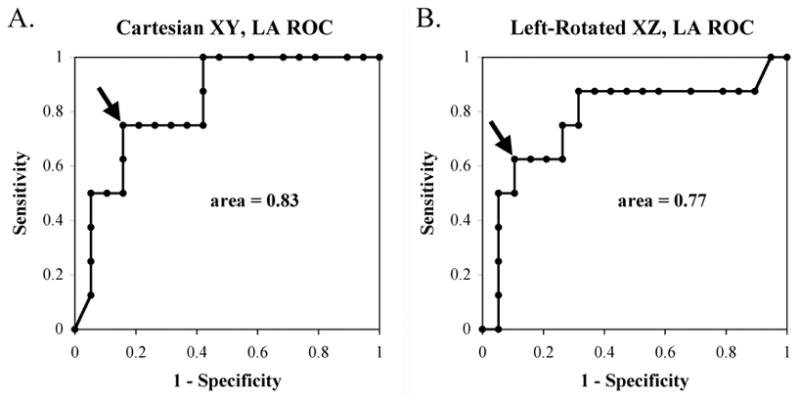
Receiver-Operator-Curves for diagnosing atypical AFL in Left Atrium (versus Right Atrium), show that spatial coherence in the Cartesian XY and Left-Rotated XZ planes provide ROC areas of 0.83 and 0.77 respectively. Arrows indicate the locations of cutpoints: for the Cartesian XY plane, coherence < 0.69 detected LA flutter with 84% specificity and 75% sensitivity and for left-rotated XZ plane, coherence < 0.13 detected LA flutter with 89% specificity and 63% sensitivity.
Discussion
This study shows that atrial macro-reentry may be characterized and localized using spatial planes in which atrial activity is quantifiably most regular. ECG coherence was lower for patients with atypical than typical AFL, particularly in the Cartesian and right-rotated axes that likely best represent the stereotypical RA activation of (reverse) typical AFL. In our small group of patients with atypical left atrial AFL, coherence in the Cartesian frontal and left-rotated axial planes best separated them from atypical right atrial AFL. Further studies should validate these results after linear ablation for atrial fibrillation, to refine localization beyond simple left-right lateralization, and use intra-cardiac mapping to establish sites of likely wavefront variability in macro-reentry.
Pathophysiologic Meaning of Spatiotemporal Coherence in AFL
As used in this work, spatiotemporal coherence measures the extent to which atrial electrical activity remains reproducible and in-phase for both axes of each plane. Reduced ECG coherence therefore reflects temporal variations in one axis relative to its pair. This functional approach differs significantly from vector plots of F-wave voltage, significantly reduces respiratory and ECG noise and can analyze F-waves even if partially superimposed on QRS or T-waves (14). Using precise intra-atrial mapping, we recently confirmed that reduced spatiotemporal coherence in atypical versus typical AFL reflects a subtly greater cycle-to-cycle variability in atrial timing and activation distant from the reentry circuit (9,10). Notably, our observed coherence differences did not merely reflect F-wave amplitude differences between groups.
Preference for Coherence in Frontal (XY) Planes
Planes where atrial activation shows most spatial and temporal regularity (coherence) may indirectly reflect constraints to reentry. The higher frontal plane spatiotemporal coherence for all forms of AFL may reflect the physical boundaries of the non-conducting tricuspid or mitral annuli, or reentry around these structures. The tricuspid annulus is the anterior boundary for reentry in (reverse) typical AFL and, not surprisingly, coherence is highest in the frontal plane in this arrhythmia (Fig. 3). Right rotated axes showed similarly high coherence, consistent with the stereotypical and highly regular RA activation in (reverse) typical AFL (1,8,9). Although atypical AFL does not reenter around the tricuspid annulus, the physical constraint of this structure likely explains the high frontal plane coherence in these patients (Fig. 3).
Accordingly, left and right atypical AFL showed differing planes of greatest regularity (coherence). Most importantly, left-rotated axes best separated left atrial from right atrial atypical AFL. Again, the non-conducting mitral annulus may explain the high front plane coherence in left-rotated axes. In a larger group of atypical left atrial AFL, it may be possible to define additional planes that identify posterior locations (such as near the pulmonary veins) from septal or mitral annular locations (15). For right atrial atypical AFL Cartesian axes remained optimal, that may reflect the poor value of planes based upon lead aVR due to its distance from the heart.
Prior work on AFL Localization
Our work agrees with recent quantitative vectorcardiography in typical AFL (12). Other ECG methods, such as vectorial localization for focal atrial tachycardias (6), are difficult to apply to AFL because continuous activation makes it difficult to identify F-wave onset. Moreover, F-waves reflect complete bi-atrial activation rather than circuit location, and thus may be misleading – witness the positive lead V1 F-waves in atypical left atrial AFL and typical (right) AFL (1,5). Although F-wave amplitude may be smaller in atypical LA than RA AFL (5), this criterion poorly separated these circuits in our study. Further studies should further improve circuit localization, particularly after linear ablation for AF, and recent work using quantitative ECG imaging to infer epicardial activation is particularly promising in this regard (16).
Limitations
This study has several limitations. First, the study size is modest, particularly for patients with LA atypical AFL. Future studies should thus focus on atypical AFL following left-atrial surgery and ablation for atrial fibrillation. Although such macro-reentry is usually left atrial (15), such validation is necessary and may better detect subeustachian-isthmus-dependent AFL with ‘atypical’ F-waves in such patients (3). Second, our patients were all referred for ablation, and therefore had persistent AFL. Progressive atrial remodeling in AFL (17,18), that is likely non-uniform (19), could influence AFL activation and hence affect ECG spatiotemporal regularity. Third, the use of clinical EPS to validate each diagnosis required the withholding of anti-arrhythmic drugs as per the standard of care (to avoid suppressing the arrhythmia and preventing its ablation). However, these results would certainly apply to patients in whom drugs have been discontinued (e.g. after arrhythmia breakthrough). Studies on how anti-arrhythmics may modulate intra-atrial timing variability (20) may help identify sites of activation variability that may underlie transitions to atrial fibrillation.
Conclusion
Atrial macroreentry may be localized to the right or left atrium, and characterized as atypical or typical by quantifying ECG spatiotemporal planes in which atrial activation is most regular (coherent). These bedside approaches may assist the preprocedural planning of ablation, and provide initial data for defining atrial sites of consistent wavelet regularity or variability.
Acknowledgments
We thank Paul Clopton, MS, for statistical assistance and we are grateful to Kathleen Mills, BA for coordinating this study.
Glossary of Abbreviations
- AFL
atrial flutter
- LA
left atrium
- RA
right atrium
- ECG
electrocardiogram
- CTI
cavotricuspid isthmus
Footnotes
Presented and published in part in abstract form (Kahn et al., Heart Rhythm, 2005; 2: S307-8). This study was supported in part by grants to AMK from the Biosite Foundation (San Diego, CA), to DEK from an ACC-Merck fellowship, and to SMN from the National Institutes of Health (HL70529) and Doris Duke Charitable Foundation.
Publisher's Disclaimer: This is a PDF file of an unedited manuscript that has been accepted for publication. As a service to our customers we are providing this early version of the manuscript. The manuscript will undergo copyediting, typesetting, and review of the resulting proof before it is published in its final citable form. Please note that during the production process errors may be discovered which could affect the content, and all legal disclaimers that apply to the journal pertain.
References
- 1.Saoudi N, Cosio F, Waldo A, Chen SA, Iesaka Y, Lesh M, Saksena S, Salerno J, Schoels W. Classification of Atrial Flutter and Regular Atrial Tachycardia According to Electrophysiologic Mechanism and Anatomic Bases: A Statement from a Joint Expert Group From the Working Group of Arrhythmias of the European Society of Cardiology and the North American Society of Pacing and Electrophysiology. J Cardiovasc Electrophysiol. 2001;12:852–866. doi: 10.1046/j.1540-8167.2001.00852.x. [DOI] [PubMed] [Google Scholar]
- 2.Milliez P, Richardson AW, Obioha-Ngwu O, Zimetbaum PJ, Papageorgiou P, Josephson ME. Variable electrocardiographic characteristics of isthmus-dependent atrial flutter. J Am Coll Cardiol. 2002;40:1125–1132. doi: 10.1016/s0735-1097(02)02070-3. [DOI] [PubMed] [Google Scholar]
- 3.Chugh A, Latchamsetty R, Oral H, Elmouchi D, Tschopp D, Reich S, Igic P, Lemerand T, Good E, Bogun F, Pelosi F, Jr, Morady F. Characteristics of Cavotricuspid Isthmus-Dependent Atrial Flutter After Left Atrial Ablation of Atrial Fibrillation. Circulation. 2006;113:609–615. doi: 10.1161/CIRCULATIONAHA.105.580936. [DOI] [PubMed] [Google Scholar]
- 4.Yang Y, Cheng J, Bochoeyer A, Hamdan MH, Kowal RC, Page R, Lee RJ, Steiner PR, Saxon LA, Lesh MD, Modin GW, Scheinman MM. Atypical Right Atrial Flutter Patterns. Circulation. 2001;103:3092–3098. doi: 10.1161/01.cir.103.25.3092. [DOI] [PubMed] [Google Scholar]
- 5.Bochoeyer A, Yang Y, Cheng J, Lee RJ, Keung EC, Marrouche NF, Natale A, Scheinman MM. Surface Electrocardiographic Characteristics of Right and Left Atrial Flutter. Circulation. 2003;108:60–66. doi: 10.1161/01.CIR.0000079140.35025.1E. [DOI] [PubMed] [Google Scholar]
- 6.Tang CW, Scheinman MM, Van Hare GF, Epstein LM, Fitzpatrick AP, Lee RJ, Lesh MD. Use of P Wave Configuration During Atrial Tachycardia to Predict Site of Origin. J Am Coll Cardiol. 1995;26:1315–1324. doi: 10.1016/0735-1097(95)00307-X. [DOI] [PubMed] [Google Scholar]
- 7.Brown JP, Krummen DE, Feld GK, Narayan SM. Using Electrocardiographic Activation Time and Diastolic Intervals to Separate Focal from Macroreentrant Atrial Tachycardias. J Am Coll Cardiol. 2007 doi: 10.1016/j.jacc.2006.10.080. in press. [DOI] [PubMed] [Google Scholar]
- 8.Stambler BS, Ellenbogen KA. Elucidating the Mechanisms of Atrial Flutter Cycle Length Variability Using Power Spectral Analysis Techniques. Circulation. 1996b;94:2515–2525. doi: 10.1161/01.cir.94.10.2515. [DOI] [PubMed] [Google Scholar]
- 9.Narayan SM, Hassankhani A, Feld GK, Bhargava V. Separating Non-Isthmus From Isthmus Dependent Atrial Flutter Using Wavefront Variability. J Am Coll Cardiol. 2005b;45:1269–1279. doi: 10.1016/j.jacc.2004.12.070. [DOI] [PubMed] [Google Scholar]
- 10.Krummen DE, Feld GK, Narayan SM. Diagnostic Accuracy of Irregularly Irregular RR Intervals in Separating Atrial Fibrillation from Atrial Flutter. Am J Cardiol. 2006a;98:209–214. doi: 10.1016/j.amjcard.2006.01.088. [DOI] [PubMed] [Google Scholar]
- 11.Jais P, Shah DC, Haissaguerre M, Hocini M, Peng JT, Takahashi A, Garrigue S, LeMetayer P, Clementy J. Mapping and ablation of left atrial flutters. Circulation. 2000;101:2928–2934. doi: 10.1161/01.cir.101.25.2928. [DOI] [PubMed] [Google Scholar]
- 12.Ng J, Sahakian A, Fisher W, Swiryn S. Atrial flutter vector loops derived from the surface ECG: does the plane of the loop correspond anatomically to the macroreentrant circuit? J. Electrocardiol. 2003;36:181–6. doi: 10.1016/j.jelectrocard.2003.09.055. [DOI] [PubMed] [Google Scholar]
- 13.Xi Q, Sahakian AV, Swiryn S. The Effect of QRS Cancellation on atrial fibrillatory wave signal characteristics in the surface electrocardiogram. J Electrocardiol. 2003:36. doi: 10.1016/s0022-0736(03)00046-3. [DOI] [PubMed] [Google Scholar]
- 14.Hoppe BL, Kahn AM, Feld GK, Hassankhani A, Narayan SM. Separating Atrial Flutter from Atrial Fibrillation with Apparent ECG Organization Using Dominant and Narrow F-wave Spectra. J Am Coll Cardiol. 2005;46:2079–2087. doi: 10.1016/j.jacc.2005.08.048. [DOI] [PubMed] [Google Scholar]
- 15.Shah D, Sunthorn H, Burri H, Gentil-Baron P, Pruvot E, Schlaepfer J, Fromer M. Narrow, slow-conducting isthmus dependent left atrial reentry developing after ablation for atrial fibrillation: ECG characterization and elimination by focal RF ablation. J Cardiovasc Electrophys. 2006;17:508–15. doi: 10.1111/j.1540-8167.2006.00413.x. [DOI] [PubMed] [Google Scholar]
- 16.Ramanathan C, Ghanem RN, Jia P, Ryu K, Rudy Y. Noninvasive electrocardiographic imaging for cardiac electrophysiology and arrhythmia. Nature Medicine. 2004;10:422–428. doi: 10.1038/nm1011. [DOI] [PMC free article] [PubMed] [Google Scholar]
- 17.Franz MR, Karasik PL, Li C, Moubarak J, Chavez M. Electrical Remodeling of the Human Atrium: Similar Effects in Patients with Chronic Atrial Fibrillation and Atrial Flutter. J Am Coll Cardiol. 1997;30:1785–1792. doi: 10.1016/s0735-1097(97)00385-9. [DOI] [PubMed] [Google Scholar]
- 18.Morton JB, Byrne MJ, Power JM, Raman J, Kalman JM. Electrical Remodeling of the Atrium in an Anatomic Model of Atrial Flutter: Relationship Between Substrate and Triggers for Conversion to Atrial Fibrillation. Circulation. 2002b;105:258–264. doi: 10.1161/hc0202.102012. [DOI] [PubMed] [Google Scholar]
- 19.Narayan SM, Bode F, Karasik PL, Franz MR. Alternans Of Atrial Action Potentials As A Precursor Of Atrial Fibrillation. Circulation. 2002b;106:1968–1973. doi: 10.1161/01.cir.0000037062.35762.b4. [DOI] [PubMed] [Google Scholar]
- 20.Boyden P, Graziano J. Activation mapping of reentry around an anatomical barrier in the canine atrium: observations during the action of the class III agent, d-sotalol. J Cardiovasc Electrophysiol. 1993;4:266–79. doi: 10.1111/j.1540-8167.1993.tb01230.x. [DOI] [PubMed] [Google Scholar]