

Abstract
Bovine and human hemoglobin (Hb) form the basis for many different types of Hb-based O2 carriers (HBOCs) ranging from chemically modified Hbs to particle encapsulated Hbs. Hence, the development of a facile purification method for preparing ultrapure Hb is essential for the reliable synthesis and formulation of HBOCs. In this work, we describe a simple process for purifying ultrapure solutions of bovine and human Hb. Bovine and human red blood cells (RBCs) were lyzed, and Hb was purified from the cell lysate by anion exchange chromatography. The initial purity of Hb fractions was analyzed by SDS-PAGE. Pure Hb fractions (corresponding to a single band on the SDS-PAGE gel) were pooled together and the overall purity and identity assessed by LC-MS. LC-MS analysis yielded two peaks corresponding to the calculated theoretical molecular weight of the α and β chains of Hb. The activity of HPLC pure Hb was assessed by measuring its oxygen affinity, cooperativity and methemoglobin level. These measures of activity were comparable to values in the literature. Taken together, our results demonstrate that ultrapure Hb (electrophoresis and HPLC pure) can be easily prepared via anion exchange chromatography. In general, this method can be more broadly applied to purify hemoglobin from any source of RBC. This work is significant, since it outlines a simple method for generating ultrapure Hb for synthesis and/or formulation of HBOCs.
Keywords: Hemoglobin, Oxygen Carrier, Blood Substitute, Purification, Anion Exchange Chromatography, Ultrapure, SDS-PAGE, LC-MS, Red Blood Cell
1. Introduction
Blood transfusion is a routine life-saving procedure in medicine[1]. However, it is not entirely risk-free. Contaminated blood transfused into patients could potentially transmit infectious diseases, and elicit the onset of mild allergic reactions, delayed hemolytic transfusion reactions, acute respiratory distress syndrome and fatal acute hemolytic transfusion reactions [2]. In some instances, the need for blood is acute as in the case of natural disasters, wars and terrorist attacks [3]. For all the above reasons, there is a critical need for the development of a universal RBC substitute that can mimic the oxygen storage and transport functions of RBCs. Hb-based oxygen carriers (HBOCs) comprise one type of RBC substitute that can fulfill the above requirements.
A variety of HBOCs exist and include: recombinant Hbs [4], cross-linked Hbs [5], polymerized Hbs [6-9], PEGylated Hbs [10], liposome encapsulated Hbs [11-13], polymersome encapsulated Hbs [14] and other particle encapsulated Hbs [15-17]. In order to synthesize and/or formulate these HBOCs, a pure source of Hb is needed. Due to their ready availability, bovine and outdated human RBCs are widely used as the starting raw material for the purification of Hb.
Several methods exist for purifying Hb. Chromatography continues to be the most commonly used method for purifying biomacromolecules, primarily because of its high resolution and mild separation conditions [18, 19]. Among all the chromatography techniques, anion-exchange remains the most popular as it offers the advantages of rapid separation, no organic solvent requirement, sanitization with sodium hydroxide, ease of scale-up and a wide selection of resin [20].
Several groups have explored various methods for purifying Hb by anion exchange chromatography [21-24]. In the 1960's, Hb was purified using DEAE cellulose chromatography [21]. However, this technique suffered from very slow flow rates (∼ 80-100 mL per hour in a 0.9 cm diameter column) and the presence of highly toxic KCN in the buffer solutions. Cheung et al. [23] improved on this method and prepared stroma-free hemoglobin by selective DEAE-cellulose absorption. Typical separations were completed in 11 hours, which was faster when compared to the crystallization method (4 days). Lu et al. [22] purified bovine hemoglobin by Q-sepharose big beads with polyethylene glycol (PEG) as an escort in the elution buffer. However, in this method PEG has to be removed from the Hb fractions after purification. Dimino and Palmer [24] compared the absorption capacities of different anion exchange resins for Hb, and found that Q Sepharose XL had the highest Hb absorption capacity. This knowledge was used to purify Hb, which still contained several impurity proteins.
This study describes an optimized procedure for the purification of ultrapure Hb derived from bovine and human RBCs using Q Sepharose XL resin.
2. Materials and Methods
2.1. Materials and Chemicals
Fresh bovine RBCs in a 4% sodium citrate solution at a final concentration of 90:10 v/v (packed RBCs: 4% sodium citrate solution) was purchased from Quad Five (Ryegate, MT), while outdated human RBCs was purchased from the Columbus, Ohio branch of the American Red Cross. Hemoglobin (lyophilized powder) derived from bovine RBCs was purchased from Sigma-Aldrich (Atlanta, GA), and used as an internal standard in SDS-PAGE gels of purified bovine Hb. Empty chromatography columns XK 26/40 (400 mm in length, 26 mm I.D., GE Healthcare, Piscataway, NJ) were packed with the anion exchange resin Q-sepharose XL (GE Healthcare). Tris(hydroxymethyl)aminomethane, NaCl, NaOH, EDTA, Triton X-100, HCl, KCN, KFe(CN)6, dialysis tubing with a molecular weight cutoff of 6-8 kDa and all other chemicals were purchased from Fisher Scientific (Pittsburgh, PA).
2.2. Lysis of RBCs
RBCs (bovine or human) were washed with isotonic saline (0.9% w/v) solution in a centrifuge for 25 minutes at 4000 rpm and 4°C in order to remove acellular hemoglobin and plasma proteins. The supernatant including white blood cells was removed after centrifugation. The RBC pellet was then resuspended in cold (4°C) isotonic saline (0.9% w/v) solution, and centrifuged repeatedly until the resultant supernatant was clear. Hb was subsequently extracted from RBCs with three equivalents of 3.75 mM phosphate buffer (pH =7.2) for one hour in an ice-water bath. The extract was then passed through glass wool (Fisher Scientific) three times, followed by filtration through qualitative filter paper (Fisher Scientific) to remove excess cell debris. The filtrate was placed into dialysis tubing with a molecular weight cutoff of 10 kDa and dialyzed overnight with dialysis buffer (20 mM Tris-Cl, pH = 8.20) at 4°C. This process removed small particles from the filtrate and equilibrated the pH of the Hb lysate to the same pH value as the starting buffer used for anion exchange chromatography.
2.3. Purification of Hb
All chromatography experiments were conducted using an ÄKTA Explorer 100 system including a pump (P-900), UV detector (UV-900) and pH/conductivity detector (pH/C-900) controlled by Unicorn 5.1 software (GE Healthcare). XK 26/40 columns (GE Healthcare) were packed with Q-sepharose XL resin (GE Healthcare) at room temperature using the ethanol-slurry-packing technique [25]. Columns were equilibrated with buffer A (20 mM Tris-HCl, pH=8.2) at a flow rate of 16 mL/min (180 cm/hr), and the final bed height was measured to be 23 cm for a total column volume (CV) of 122 mL. After equilibrating the columns, 2 M NaCl solution was used to remove impurities absorbed inside the columns at a flow rate of 6 mL/min (68 cm/hr). Salt and adsorbed impurities were removed by flushing the columns with buffer A. The dead volume of the columns was measured by injecting 50 μL of 20% acetone solution via the injection loop.
Dialyzed RBC lysate was loaded into a 50 mL Superloop (GE Healthcare) for subsequent injection. Column equilibration was performed with buffer A until a constant UV baseline was obtained. The lysate was loaded onto the column and the column washed with buffer A. A linear gradient elution was generated by changing from 100% buffer A to 75% buffer B (20mM Tris-Cl, plus 0.2 M NaCl pH8.20) in 5 CVs (100 min). This was followed by a step gradient of 100% buffer B. The protein concentration was detected at a wavelength of 280 nm. As the protein eluted, a fraction collector (Frac 900, GE Healthcare) was used to collect protein fractions. All chromatography experiments were performed at room temperature.
After each run, the column was regenerated by flushing it with 1 CV of 2 M NaCl and equilibrating the column with buffer A. For additional cleaning, 1 CV of 1 M NaOH followed by 2 CV of buffer A and then a mixture of 30 mM EDTA and 0.2% Triton X-100 in 1 CV was used to remove impurities and free iron that bound to the column. The column was then washed with a mixture of buffer A and 20% ethanol to remove any residual Triton X-100. Column equilibration was performed with buffer A until a constant UV baseline was obtained.
2.4. SDS-PAGE
The initial purity of Hb was assessed via gel electrophoresis using a Mini-PROTEAN 3 Cell (Bio-Rad; Hercules, CA). The total protein concentration of the samples including RBC lysate and Hb fractions collected after purification were all measured according to the Bradford method [26]. All samples were mixed with an equal volume of sample buffer (Bio-Rad) containing 5% v/v β-mercaptoethanol, and then boiled for 5 min. A 4% stacking gel with a 12% resolving gel was assembled on a minivertical gel apparatus and each lane loaded with 25 μg of protein. The gel was run at 120 V for approximately 1 hour. After electrophoresis, the gel was stained with Coomassie blue R250 (stain buffer, Bio-Rad) for one hour and then the gel was destained using destaining buffer (10% acetic acid and 20% methanol). The gel was scanned on a Gel Doc XR (Bio-Rad) imaging system.
2.5. LC-MS
LC-MS analysis of purified Hb was performed on a Waters Alliance 2690 high-performance liquid chromatography (HPLC) system (Waters, Milford, MA) connected in series to a Waters LCT (time-of-flight mass spectrometer, Waters, Milford, MA) mass detector. Samples were analyzed using a Vydac C18 column (5 μm particle size, 1.0 × 250 mm, Grace Davison Discovery Sciences: Deerfield, IL) at a flow rate of 50 μL/min and injection volume of 10 μL. The total mass of sample injected was approximately 0.01 μg. Separation of alpha and beta chains was achieved by applying a linear gradient of 0-65% acetonitrile in 0.6 % acetic acid for 45 min followed by 15 min of 65-100% acetonitrile in 0.6 % acetic acid.
2.6. Methemoglobin Level
The methemoglobin level of the Hb fractions was measured by the cyanomethemoglobin method [11, 27].
2.7. Oxygen Equilibrium Curves
Oxygen equilibrium curves of RBCs and purified Hb were measured using a Hemox Analyzer (TCS Instruments, Southampton, PA) at 37°C. Samples were prepared by thoroughly mixing 50 μL of RBCs or purified Hb with 5 mL of Hemox buffer (pH 7.4, TCS Instruments), 20 μL of Additive-A, 20 μL Additive-B and 10 μL of anti-foaming agent. The Hb sample was allowed to saturate to a pO2 of 145 ± 2 mmHg using compressed air. After giving the sample enough time to equilibrate, the gas stream was switched to pure N2 to deoxygenate the Hb sample. The absorbance of oxy- and deoxy-Hb in solution was recorded as a function of pO2 via dual wavelength spectroscopy. Oxygen equilibrium curves were fit to a four-parameter (A0, A∞, P50, n) Hill model (Eq. 1). In this model, A0 and A∞ represent the absorbances at 0 mmHg and full saturation, respectively.
| (1) |
3. Results and Discussion
3.1. Purification of Hb
Figure 1 shows the chromatogram of bovine Hb separated on a Q sepharose XL column. After bovine lysate was loaded onto the column, a linear gradient of 0.2 M NaCl solution was used to elute absorbed protein. The appearance of a large peak in the chromatogram shows that the majority of protein is eluting off the column. After the linear gradient was completed, a step gradient of 100% buffer B was applied to remove most of the impurity proteins. Each peak was collected as several fractions for subsequent SDS-PAGE analysis. Figure 2 shows the composition of fractions derived from peaks 1 and 2 in Figure 1. It was reported that lipids and methemoglobin (metHb) elute earlier in the Hb purification process [28]. Therefore, it came as no surprise that fraction 1 was composed of several weak impurity protein bands, which possess almost the same molecular weight banding pattern as impurity proteins found in bHb obtained from Sigma-Aldrich. This impurity is most likely carbonic anhydrase (MW ∼ 32.5 kDa) and/or superoxide dismutase (MW ∼ 30 kDa). The other lanes derived from fractions of peak 1 of Figure 1, except fractions 1 and 17, possess only one protein band (which is close to the Mw of separated alpha and beta chains ∼15 kDa) and no impurity protein bands. The impurity fractions collected from peak 2 of Figure 1 show weak Hb bands, arising from individual alpha and beta subunits (MW ∼ 15 kDa), and strong impurity protein bands (MW ∼ 30 kDa). Other groups have also observed similar impurity bands [22,24].
Figure 1. Chromatogram of purified bHb.
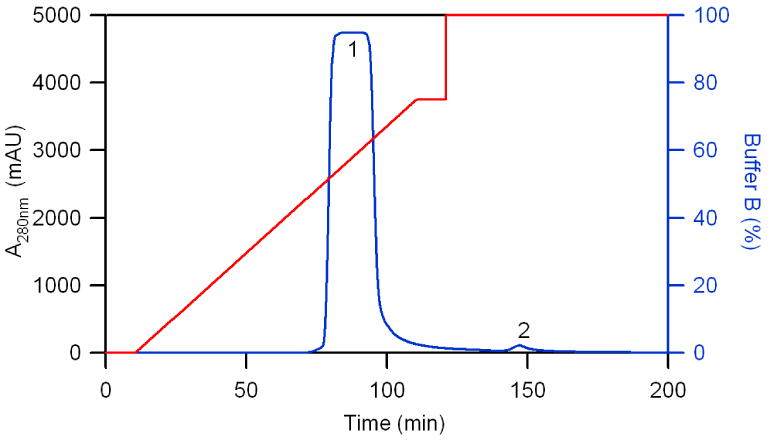
Column: XK 26/40 (400 mm in length, 26 mm I.D.) was packed with 120 mL Q-sepharose XL. Injection: 50 mL of bRBC lysate was introduced into the column via Superloop. Elution: a linear gradient was generated by changing from 100% buffer A to 75% buffer B in 5 CVs (100 min). This was followed by a step gradient of 100% buffer B. The “1” in this Figure represents the bHb peak, while the “2” represents the impurity peak.
Figure 2. SDS-PAGE of various fractions collected during the purification of bHb.

Fractions 1-17 were collected from peak 1 of Figure 1, while impurities 1-2 were collected from peak 2 of Figure 1.
Figures 3 and 4 show the chromatogram and SDS-PAGE of purified hHb, respectively. Figure 3 contains similar peaks as shown in Figure 1 for bHb. Fractions 1-15 derived from peak 1 of Figure 3 only show one band in each lane. This band corresponds to individual alpha and beta subunits (MW ∼ 15 kDa). Fractions 17-21 show a major hHb band and some impurity proteins. From Figures 2 and 4, it is clear that electrophoresis pure Hb was obtained after bRBC and hRBC lysate were separated by anion exchange chromatography using Q-sepharose XL resin. This result is similar to that of Hb purified by Q-sepharose big beads with polyethylene glycol (PEG) as an escort in the elution buffer [22]. However in this study, purified hemoglobin is the only protein being eluted off the column and PEG does not have to be removed from the fractions. In Figures 1 and 3, there is no Hb flow through peak, which indicates that the Q-sepharose XL resin did not reach its maximum absorption capacity for Hb. To qualitatively confirm this, during the separation of Hb, only parts of the XK26/40 column packed with Q-sepharose XL developed a dark red color after it was loaded with 50 mL of lysate, which indicates that the column was not completely saturated with Hb.
Figure 3. Chromatogram of purified hHb.
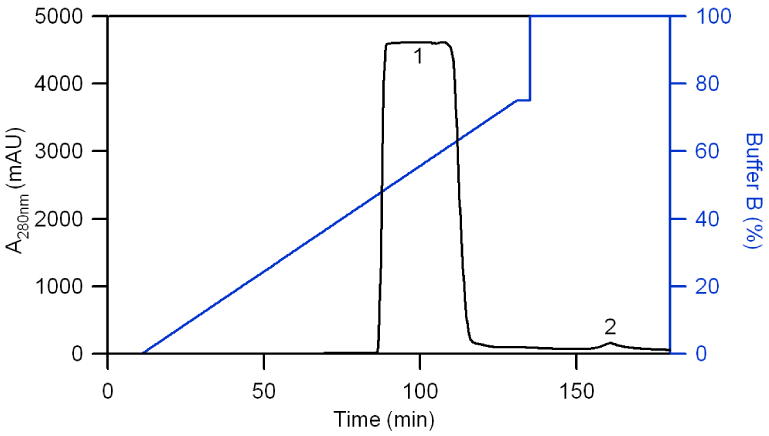
Column: XK 26/40 (400 mm in length, 26 mm I.D.) was packed with 120 mL Q-sepharose XL. Injection: 50 mL of hRBC lysate was introduced into the column via Superloop. Elution: a linear gradient was generated by changing from 100% buffer A to 75% buffer B in 5 CVs (100 min). This was followed by a step gradient of 100% buffer B. The “1” in this Figure represents the hHb peak, while the “2” represents the impurity peak.
Figure 4. SDS-PAGE of various fractions collected during the purification of hHb.

Fractions 1-17 were collected from peak 1 of Figure 3, while impurities 1-2 were collected from peak 2 of Figure 3.
In several publications [22,24], a 20 cm column length was selected for Hb purification. However, in this study, a longer column (40 cm length) was used, therefore better Hb separation resolution was achieved. In this study, 0.2 M NaCl buffer was used to elute Hb off the column. It is interesting to note that in this work a much lower salt gradient was used to elute Hb off the column compared to other published reports [22,24]. This resulted in greater resolution of the Hb peak [22,24]. In all cases, the majority of Hb absorbed on the column was eluted off with the application of the linear gradient.
3.2. LC-MS
Figures 5 and 6 show the results of LC-MS analysis of purified Hb samples. Figures 5A and 6A show the reverse phase high performance liquid chromatography (RP-HPLC) chromatograms of separated α- and β-globin chains. The elution profiles show 2 dominant peaks, corresponding to the alpha and beta chains, respectively. The alpha chain elutes first, followed by the beta chain. The corresponding fragmented electrospray ionization (ESI) mass spectra of the individual peaks corresponding to the alpha and beta chains (Figures 5B (alpha chain of bHb), 5D (beta chain of bHb), 6B (alpha chain of hHb) and 6D (beta chain of hHb)) show a good distribution of multiply-charged ions. The molecular mass of the alpha and beta chains (Figures 5C (alpha chain of bHb), 5E (beta chain of bHb), 6C (alpha chain of hHb) and 6E (beta chain of hHb)), obtained from deconvolution of the ESI mass spectra, was determined to be 15.054 and 15.955 kDa, respectively for the alpha and beta chains of bHb and 15.127 and 15.867 kDa, respectively for the alpha and beta chains of hHb. The calculated theoretical mass of the α- and β-globin chains of bHb is 15.053 and 15.955 kDa, respectively, while for hHb it is 15.126 and 15.867 kDa, respectively. The experimental results agree well with the calculated theoretical mass of α- and β- globin chains. Therefore, it is clear that pooled fractions of bHb and hHb contain only bovine and human hemoglobin, respectively.
Figure 5.

LC-MS analysis of bHb. (A) represents the RP-HPLC chromatogram of bHb. (B) and (D) represent the ESI mass spectra of the alpha and beta chains, respectively. (C) and (E) represent the deconvoluted molecular mass ion of the alpha and beta chains, respectively.
Figure 6.

LC-MS analysis of hHb. (A) represents the RP-HPLC chromatogram of hHb. (B) and (D) represent the ESI mass spectra of the alpha and beta chains, respectively. (C) and (E) represent the deconvoluted molecular mass ion of the alpha and beta chains, respectively.
3.3. Oxygen Affinity and Cooperativity Coefficient
Figure 7 shows the oxygen equilibrium curves of Hb and RBCs. Before purification, the measured P50 and cooperativity coefficient, an index of cooperative oxygen binding, for bovine and human RBCs was (28.27 torr and 2.946) and (15.28 torr and 2.502), respectively. The regressed P50 of bovine Hb is 26.67 torr, and its cooperativity coefficient is 3.11. These parameters are similar to values reported previously in the literature, 26.00 torr and 2.47 [11, 13]. The regressed P50 and cooperativity coefficient of human Hb is 12.83 torr and 2.96, respectively. Compared to values reported in the literature [29], the P50 for purified hHb is similar. Hu et al. [10] reported a P50 of 14 torr and a cooperativity of 2.8 for hHb, whereas [29] reported a P50 of 15.1 torr and a cooperativity of 2.97 for hHb. The difference between these published values and the values in this work are easily explained in terms of the different buffer conditions used for measuring the oxygen binding equilibria. For example, the oxygen binding equilibria of hHb in this study was measured in Hemox buffer, whereas [10] used PBS (pH = 7.4) as the measurement buffer. These changes in the buffer composition explain the observed variation in P50.
Figure 7.

Oxygen equilibrium curves (OECs) of Hb and RBCs. (A) represents bHb and bRBCs; while (B) represents hHb and hRBCs. The black lines represent the experimentally measured OECs, while the blue lines represent curve fits to the Hill model (Eq. 1).
Although the purification was conducted at room temperature, the methemoglobin level of the lysate and Hb fractions were below 2%.
4. Conclusions
Ultrapure hemoglobin was purified from bovine and human RBCs via anion exchange chromatography using Q-sepharose XL resin. Analysis of purified Hb by SDS-PAGE and LC-MS confirmed the high purity and chemical identity of Hb. The activity of Hb was assessed by measuring its oxygen affinity (P50), cooperativity coefficient and metHb level. Even though the separation process was conducted at room temperature, the metHb level of the purified Hb was below 2%. Taken together, the results of this work outline a simple process for the purification of ultrapure Hb.
Acknowledgments
This work was supported by the National Institutes of Health grants R01HL078840 and R01DK070862 to AFP.
Footnotes
Publisher's Disclaimer: This is a PDF file of an unedited manuscript that has been accepted for publication. As a service to our customers we are providing this early version of the manuscript. The manuscript will undergo copyediting, typesetting, and review of the resulting proof before it is published in its final citable form. Please note that during the production process errors may be discovered which could affect the content, and all legal disclaimers that apply to the journal pertain.
References
- 1.Chamberland ME. Clin Infect Dis. 2002;34:797. doi: 10.1086/338787. [DOI] [PubMed] [Google Scholar]
- 2.Perrotta PL, Snyder EL. Blood Rev. 2001;15:69. doi: 10.1054/blre.2001.0151. [DOI] [PubMed] [Google Scholar]
- 3.Alayash AI. Nat Rev Drug Discov. 2004;3:152. doi: 10.1038/nrd1307. [DOI] [PubMed] [Google Scholar]
- 4.Apostol I, Levine J, Lippincott J, Leach J, Hess E, Glascock CB, Weickert MJ, Blackmore R. J Biol Chem. 1997;272:28980. doi: 10.1074/jbc.272.46.28980. [DOI] [PubMed] [Google Scholar]
- 5.Chatterjee R, Welty EmV, Walder RY, Pruitt SL, Rogers P, Arnone A, Walderg JA. J Biol Chem. 1986;261:9929. [PubMed] [Google Scholar]
- 6.Dimino ML, Palmer AF. Biotechnol Bioeng. 2007;97:462. doi: 10.1002/bit.21277. [DOI] [PubMed] [Google Scholar]
- 7.Eike JH, Palmer AF. Biotechnol Prog. 2004;20:1543. doi: 10.1021/bp049872l. [DOI] [PubMed] [Google Scholar]
- 8.Eike JH, Palmer AF. Biotechnol Prog. 2004;20:1225. doi: 10.1021/bp049974b. [DOI] [PubMed] [Google Scholar]
- 9.Eike JH, Palmer AF. Biotechnol Prog. 2004;20:946. doi: 10.1021/bp0343155. [DOI] [PubMed] [Google Scholar]
- 10.Hu T, Prabhakaran M, Acharya SA, Manjula BN. Biochem J. 2005;392:555. doi: 10.1042/BJ20050663. [DOI] [PMC free article] [PubMed] [Google Scholar]
- 11.Arifin DR, Palmer AF. Biotechnol Prog. 2003;19:1798. doi: 10.1021/bp034120x. [DOI] [PubMed] [Google Scholar]
- 12.Arifin DR, Palmer AF. Artif Cells Blood Substit Immobil Biotechnol. 2005;33:137. doi: 10.1081/bio-200055880. [DOI] [PubMed] [Google Scholar]
- 13.Li S, Nickels J, Palmer AF. Biomaterials. 2005;26:3759. doi: 10.1016/j.biomaterials.2004.09.015. [DOI] [PubMed] [Google Scholar]
- 14.Arifin DR, Palmer AF. Biomacromolecules. 2005;6:2172. doi: 10.1021/bm0501454. [DOI] [PubMed] [Google Scholar]
- 15.Patton JN, Palmer AF. Biomacromolecules. 2005;6:2204. doi: 10.1021/bm050144b. [DOI] [PubMed] [Google Scholar]
- 16.Patton JN, Palmer AF. Biomacromolecules. 2005;6:414. doi: 10.1021/bm049432i. [DOI] [PubMed] [Google Scholar]
- 17.Patton JN, Palmer AF. Langmuir. 2006;22:2212. doi: 10.1021/la052883j. [DOI] [PubMed] [Google Scholar]
- 18.Afeyan NB, Fulton SP, Regnier FE. J Chromatogr A. 1991;544:267–279. [Google Scholar]
- 19.Fulton SP, Shahidi AJ, Gordon NF, Afeyan NB. Biotechnology (N Y) 1992;10:635. doi: 10.1038/nbt0692-635. [DOI] [PubMed] [Google Scholar]
- 20.Prazeres DM, Schluep T, Cooney C. J Chromatogr A. 1998;806:31. doi: 10.1016/s0021-9673(97)01254-5. [DOI] [PubMed] [Google Scholar]
- 21.Chernoff AI, Pettit N, Northrop J. Blood. 1965;25:646. [PubMed] [Google Scholar]
- 22.Lu X, Zhao D, Su Z. Artif Cells Blood Substit Immobil Biotechnol. 2004;32:209. doi: 10.1081/bio-120037828. [DOI] [PubMed] [Google Scholar]
- 23.Cheung LC, Storm CB, Gabriel BW, Anderson WA. Anal Biochem. 1984;137:481. doi: 10.1016/0003-2697(84)90116-7. [DOI] [PubMed] [Google Scholar]
- 24.Dimino ML, Palmer AF. J Chromatogr B. 2007;856:353. doi: 10.1016/j.jchromb.2007.05.040. [DOI] [PMC free article] [PubMed] [Google Scholar]
- 25.Sun GY, Shi QH, Sun Y. J Chromatogr A. 2004;1061:159. doi: 10.1016/j.chroma.2004.10.101. [DOI] [PubMed] [Google Scholar]
- 26.Bradford MM. Anal Biochem. 1976;72:248. doi: 10.1016/0003-2697(76)90527-3. [DOI] [PubMed] [Google Scholar]
- 27.Hawk PB. Hawk's Physiological Chemistry. Blakiston Division; New York City: 1965. p. 1090. [Google Scholar]
- 28.Christensen SM, Medina F, Winslow RW, Snell SM, Zegna A, Marini MA. J Biochem Biophys Methods. 1988;17:143. doi: 10.1016/0165-022x(88)90045-0. [DOI] [PubMed] [Google Scholar]
- 29.McCarthy MR, Vandegriff KD, Winslow RM. Biophys Chem. 2001;92:103. doi: 10.1016/s0301-4622(01)00194-6. [DOI] [PubMed] [Google Scholar]