

Abstract
Aims
Despite the known benefits, 60% of individuals with diabetes do not engage in regular physical activity (PA). This pilot study tested the effects of a counseling intervention using continuous glucose monitoring system (CGMS) feedback on PA self-efficacy, PA levels, and physiological variables.
Methods
Adults (N = 52) with type 2 diabetes (non-insulin requiring, inactive) were randomized to intervention (n = 27) or control (n = 25) groups. Both groups received 90 min of diabetes education with a follow-up phone call 4 weeks later. The intervention group also received counseling derived from self-efficacy theory. This intervention included feedback on each participant’s CGMS graph and used role model CGMS graphs to clearly depict glucose reductions in response to PA. Outcomes were assessed at baseline and 8 weeks.
Results
Participants receiving the intervention had higher self-efficacy scores than the control group for sticking to activity/resisting relapse at 8 weeks (p < 0.05), indicating more confidence in maintaining a PA program. Intervention group participants light/sedentary activity minutes decreased significantly (p < 0.05), moderate activity minutes increased significantly (p < 0.05), and, HbA1c and BMI decreased significantly (p < 0.05).
Conclusions
These data suggest that PA counseling interventions using CGMS feedback for individuals with type 2 diabetes may improve PA levels and reduce risk factors for diabetes-related complications.
Keywords: Physical activity, Continuous glucose monitoring, Type 2 diabetes mellitus, Accelerometers, Self-efficacy
1. Introduction
Physical activity is a cornerstone of diabetes treatment, but changing physical activity behavior is difficult for individuals with type 2 diabetes [1,2]. Understanding behavior change has been improved by behavioral theories, such as social cognitive theory (SCT) [3] for which self-efficacy is a major construct. The basic premise of self-efficacy is that changing and maintaining behaviors are functions of expectations about one’s ability to perform a certain behavior and one’s expectations of the resulting outcomes. Perceptions or beliefs about self-efficacy, in part, influence all aspects of behavior, including initiating it, ending it, the effort expended, and how long it will be maintained in the face of obstacles [4].
Efficacy beliefs are dynamic, task specific, and influenced by four primary sources: personal experience, verbal persuasion, vicarious experience/role models, and physiological self-appraisal [4]. First, performance accomplishments are derived from the experience of mastering a behavior. Second, self-efficacy is enhanced by strong verbal encouragement regarding the benefits of a behavior and progress in achieving the behavior. Third, one learns from the vicarious experience of observing another’s success, particularly by a credible role model. Last, self-efficacy beliefs are developed through one’s physiological and affective states. Feedback given to the individual concerning how s/he is responding to the effects of the behavior can strengthen one’s sense of self-efficacy. Self-efficacy has been shown to predict several health-related behavioral changes [4], including physical activity behavior in individuals with diabetes [5]. Despite the contributions of SCT to understanding changes in physical activity behavior, few theory-based interventions targeting physical activity in individuals with diabetes have proven practical, teachable, and effective [6–8].
Most sedentary people with type 2 diabetes can safely benefit from a moderate-intensity physical activity program. Moderate-intensity activities such as brisk walking generate 40–60% of maximum oxygen uptake [9,10] and have been associated with reduced risk of coronary heart disease [11], stroke [12,13], and insulin resistance [14]. These beneficial effects are associated with decreases in body weight, blood pressure (BP), serum cholesterol, and improved glucose tolerance [15]. Modest increments in physical fitness can reduce the risk of overall mortality twofold [16] and while difficult can be incorporated into a daily routine, regardless of income or race [17,18].
An important component of behavioral change programs can be new technologies that provide feedback on the body’s internal responses. One type of technology that may serve in counseling people with diabetes about changing physical activity is the continuous glucose monitoring system (CGMS). The CGMS produces a 72-hour plot of an individual’s glucose levels and allows for input of events such as physical activity, meals and finger stick glucose values. The CGMS graphs can be used to teach people with diabetes about interactions between diet, physical activity, medications and glucose levels. Based on established behavioral change theory [4] and known benefits of physical activity, the purpose of this study was to determine whether using CGMS technology with counseling can facilitate short-term changes in physical activity and self-efficacy behavior.
2. Aims
The aim of this randomized controlled pilot study was to test the effect of a counseling intervention using CGMS technology to change physical activity behavior in individuals with type 2 diabetes. Outcome measures were physical activity self-efficacy, physical activity levels, glycemic control, blood pressure (BP), HbA1c, and body mass index (BMI).
3. Subjects
Participants were recruited from two health systems in western Massachusetts. Individuals included in the trial had to meet the following criteria: (1) known history of type 2 diabetes, (2) >18 years old, (3) not engaged in physical activity more than 2 days/week, (4) HbA1c >7.5%, (5) not receiving insulin, and (6) able to read and speak English. Exclusion criteria were (1) inability to walk 0.25 miles in10 min, (2) taking glucocorticoids, or (3) failing historyand physical activity pre-screening evaluation including a 12-lead ECG with ST changes; history of chest pain or pressure, dyspnea on exertion, or unexplained gastrointestinal complaints; uncontrolled BP (resting systolic >200 mmHg or diastolic >110 mmHg); resting tachycardia (100 beats/min); autonomic neuropathy (orthostatic BP followed by >20 mmHg Hg fall in systolic BP upon standing, resting tachycardia of >100 beats/min and fixed R-R ratio on ECG); and neuropathy (inability to detect sensation with a 5.07 monofilament, loss of vibratory sensation and absent deep tendon reflexes). All medication adjustments were left up to the discretion of subjects’ providers based on clinical indications.
4. Materials and methods
Written informed consent was obtained from each participant in accordance with study protocols and institutional review boards from University of Massachusetts Worcester, Baystate Health System, and Berkshire Health System. Of 231 participants assessed, 52 were enrolled (Fig. 1). Since this was a pilot study of the intervention, a target convenience sample of 52 was used and a post hoc power analysis was performed.
Fig. 1.
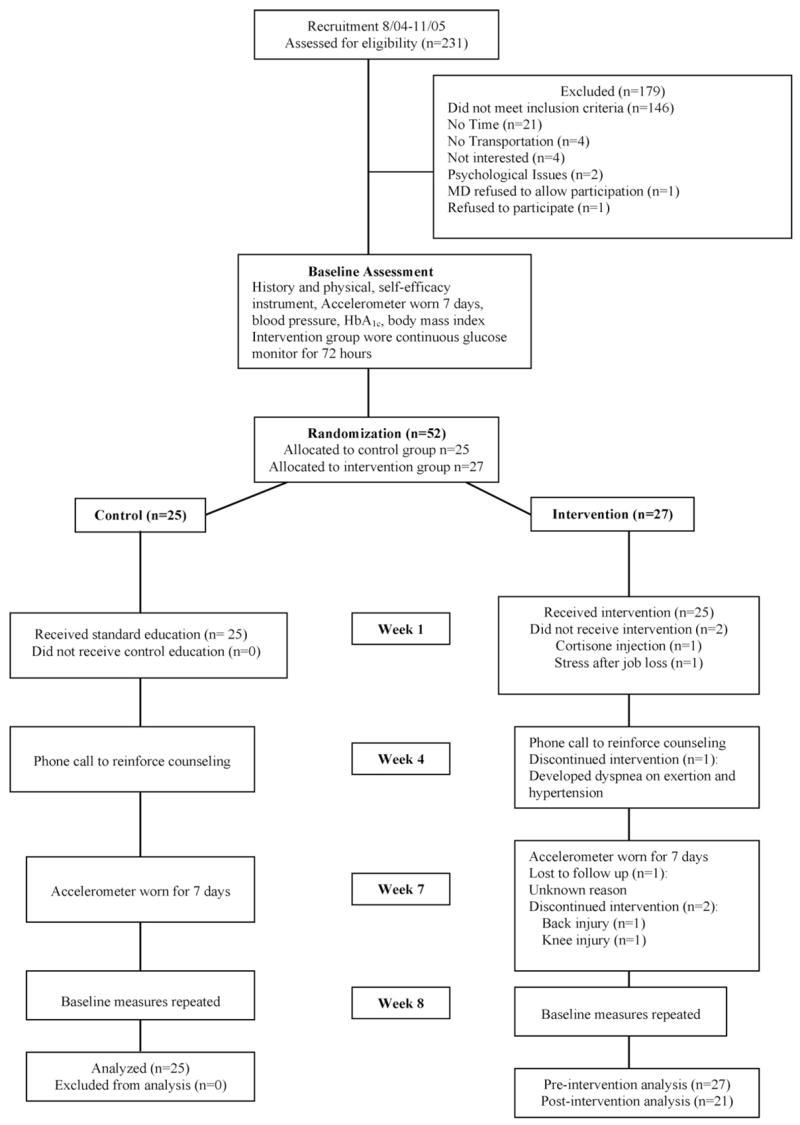
– Flow of participants through the trial.
4.1. Randomization
Participants were assigned (1:1) to experimental or control groups using a computer-generated 4-block randomization schedule (Fig. 1) generated by the study’s statistician. After enrolling participants and obtaining informed consent, one investigator opened sealed, numbered, opaque envelopes containing group assignment. The investigators, participants, and a single interventionist for both groups were not blinded to group assignment.
4.2. Outcome measures
4.2.1. Physical activity self-efficacy
Confidence in one’s ability to change physical activity behaviors was measured by the Self-efficacy for Exercise Behavior (SEBS) [19]. The 12-item SEBS has two subscales: resisting relapse/sticking to it (5 items) and making time for exercise (7 items). Self-reported responses to the SEBS are rated on a Likert-type scale from 1 (“I know I cannot do it”) to 5 (“I know I can do it”), with higher scores indicating greater self-efficacy. Internal consistency reliability was 0.83–0.85 in a college-age population [19], but was higher (0.91) in middle-aged women engaged in moderate or higher intensity physical activity [20]. Factor test–retest reliability was 0.68. Resisting relapse/sticking to it and making time subscales were significantly correlated with reported participation in vigorous activity (r = 0.32, p < 0.001; r = .40, p < 0.001, respectively) [19]. The most recent version of the SEBS was used in this study which can be found at the following web site (http://www.drjamessallis.sdsu.edu).
4.2.2. Physical activity levels
We measured physical activity using accelerometers which detect movement and electronically record activity counts, a product of movement frequency and intensity, within an interval of time (e.g. over 1 min). These devices accurately record physical activity levels [21] and are preferable to activity logs or questionnaires because they minimize recall bias [22], floor effects [23], and different perceptions of light, moderate or vigorous physical activity [24]. Activity monitors are accurate for sedentary and upright locomotion (i.e. walking, jogging, running), but less accurate for activities such as weight-lifting, swimming and cycling [25]. Since walking is the preferred type of physical activity in adults with type 2 diabetes [12] and previous research has supported the use of activity monitors to measure physical activity in individuals with diabetes [7,26–28], we chose to objectively measure physical activity with ActiGraph uniaxial accelerometers (Manufacturing Technologies Incorporated, Fort Walton Beach, FL). The monitor was secured by a strap at the participant’s right waist and programmed to collect activity counts at 1-min intervals over 7 days. Information from the activity monitor was imported into ActiGraph software (DOS RIU256K.EXE, software 2.27) for analysis. Freedson’s [21] cut points were used to quantify the intensity of physical activity: sedentary (<499), light activity (500–1951), moderate activity (1952–5724), and vigorous activity (≥5725 counts).
4.2.3. Blood pressure
BP was measured pre- and post-intervention with an aneroid BP monitor after 5 min rest (minimum) at the same approximate time of day.
4.2.4. BMI and HbA1c
Body mass index (BMI) was calculated as weight (kg)/height (m2). Weight in kilogram to the nearest 0.1 kg was measured using the same designated standing scale in each clinic. Participants were asked to wear light indoor clothing and to remove their shoes prior to weight measurement. Height was measured to the nearest 0.5 cm. HbA1c levels were assayed by high-pressure liquid chromatography (Bio-Rad variant) using HPLC methods according to standard clinical methods.
4.3. Procedures
After participants were randomized to groups, they were assessed for outcome measures at two times: baseline and week 8. Baseline measures were demographic data, physical activity self-efficacy, BP, BMI, and HbA1c. At baseline, all participants were instructed about and fitted with physical activity monitors, which were worn for 7 days. During week 1, both groups received individualized diabetes education (details below). A one on one educational format was chosen for the initial trial of this intervention because it was unknown whether or not participant similarity in terms of cultural background, individualized clinical CGMS profiles, and physical activity counseling might lend itself to group education. [29]. Participants in both groups were encouraged to solve problems and set diabetes-related goals. At week 4, both groups received a phone call to reinforce counseling. At week 7, participants again wore activity monitors for 7 days and baseline measures were repeated at week 8.
4.4. Control group education
The control group received 90 min of individualized diabetes education based on major components from the International Diabetes Center curriculum [30]: diabetes physiology, diet strategies (both groups received the same dietary information), glucose testing, risk reduction, foot care, and a brief review of a physical activity brochure with a walking plan [31].
4.5. CGMS physical activity intervention
The intervention group received not only the activity monitor at week 1, but also the CGMS monitor with instructions. Three days later, the CGMS monitors were removed. The intervention group participants received 90 min of individualized education including educational topics covered in the control group intervention and the CGMS counseling. This counseling protocol was designed to change efficacy beliefs about physical activity in five steps: (1) review CGMS graphs with each participant, (2) outline benefits of physical activity, (3) assess confidence in changing physical activity, (4) prescribe physical activity program, and (5) discuss normal responses to starting a physical activity program. The first step provided not only feedback on the participant’s own expected areas of activity-related glucose reduction (performance accomplishment), but also examples of CGMS graphs and stories from role models to show activity-related glucose reductions (vicarious experience). In the second step, the interventionist offered verbal persuasion of the cardiac-, diabetes-, and health-related benefits of physical activity. In the third step, participants were asked to rate their confidence to increase their physical activity on a 1–10 scale and this information was used to discuss participants concerns about increasing their physical activity. In the fourth step, the interventionist reviewed ADA recommendations for physical activity, discussed physical activity goals, and wrote an individualized prescription for a physical activity program targeting moderate-level physical activity (e.g., walking 30 min most days of the week) that was compatible with physical limitations or co-morbid illnesses (performance accomplishment). In the last step, normal responses to a new activity program were discussed (physiological feedback).
4.6. Statistical analysis
Baseline comparisons between the control and intervention groups were analyzed by parametric (t-test) and non-parametric statistics (Mann–Whitney U). Demographic and outcome variables were described using frequency distributions and appropriate summary statistics for central tendency and variability. Differences between groups were analyzed by parametric (t-test) and non-parametric (Wilcoxon test for within-group changes; Mann–Whitney for between-group changes) statistics. Although some distributions in this data set were slightly skewed, non-parametric equivalent tests yielded the same significance as parametric t-test. Therefore, changes in outcome variables from pre- to post-intervention were analyzed as paired t tests for within-group change and two-sample t-tests for between-group changes. All analyses were performed using SPSS (version 11).
5. Results
5.1. Participants
Of the 52 subjects who enrolled in this study, 46 completed the protocol (Fig. 1). The control and intervention groups did not differ at baseline in either demographic characteristics or outcome variables (Table 1). Most participants were white and obese, with a mean age of 57 years, an 8-year history of diabetes, and suboptimal glycemic control. Two participants were unable to complete the study, one developed hypertension and exertion-induced dyspnea and one incurred a knee injury (Fig. 1).
Table 1.
Participant characteristics (N = 52)
| Characteristic | Control (n = 25) | Intervention (n = 27) | All (N = 52) |
|---|---|---|---|
| Age (years): mean 3 S.D. | 57.0 ± 12.47 | 57.0 ± 14.56 | 57.0 ± 13.5 |
| Diabetes duration (years): Mean 3 S.D. | 8.5 ± 6.23 | 8.3 ± 6.31 | 8.4 ± 6.2 |
| BMI (kg/m2): mean 3 S.D. | 33.8 ± 4.86 | 36.05 ± 6.67 | 35.0 ± 5.9 |
| HbA1c: mean 3 S.D. | 8.4 ± 1.06 | 8.3 ± 1.23 | 8.6 ± 1.2 |
| Gender: n (%) | |||
| Female | 12 (48) | 15 (56) | 27 (52) |
| Male | 13 (52) | 12 (44) | 25 (48) |
| Race: n (%) | |||
| White | 22 (88) | 25 (93) | 47 (90) |
| African American | 3 (12) | 2 (7) | 5 (10) |
| Ethnicity: n (%) | |||
| Not Hispanic or Latino | 23 (92) | 25 (93) | 48 (92) |
| Hispanic or Latino | 2 (8) | 2 (7) | 4 (8) |
| Marital status: n (%) | |||
| Single | 5 (20) | 8 (30) | 13 (25) |
| Married | 15 (60) | 14 (52) | 29 (56) |
| Divorced | 2 (8) | 4 (15) | 6 (12) |
| Widowed | 3 (12) | 1 (4) | 4 (8) |
| Education: n (%) | |||
| Graduate or Professional Training | 4 (16) | 5 (19) | 9 (17) |
| College or University Graduate | 3 (12) | 4 15) | 7 (14) |
| Partial College Education | 7 (26) | 10 (37) | 17 (33) |
| High School Graduate | 10 (40) | 7 (26) | 17 (33) |
| Partial High School Education | 1 (4) | 1 (4) | 2 (4) |
| Smoking history: n (%) | 13 (52) | 16 (60) | 29 (56) |
| Currently smoking: n (%) | 0 | 5 (19)a | 5 (1) |
p < 0.05 applicable.
5.2. Physical activity self-efficacy
Participants in the intervention group significantly improved from pre- to post-intervention in their mean scores for self-efficacy on the SEBS “stick to it” subscale. This improvement in self-efficacy was significant not only within the intervention group (p < 0.05), but also between the two groups (p < 0.05, Table 2).
Table 2.
Pre- and post-intervention changes in outcome variables
| Outcome | Within-group change, mean (S.D.)
|
Between-group change, mean (S.D.)
|
||||
|---|---|---|---|---|---|---|
| Control group (n = 25)
|
Intervention group (n = 21)
|
Control, n = 25 | Intervention, n = 21 | |||
| Pre | Post | Pre | Post | |||
| Self-efficacy, “Sticking to it” | 3.70 (0.85) | 3.59 (0.67) | 3.35 (0.88) | 3.87a (0.82) | −0.11 (0.68) | 0.52a (0.89) |
| Self-efficacy, “Making time” | 3.84 (0.69) | 3.45a (0.82) | 3.78 (0.93) | 3.92 (0.76) | −0.39 (0.68) | 0.14 (1.09) |
| Activity level (counts/day) | 259,716 (124,558) | 250,435 (97,564) | 199,100 (73,187) | 230,244a (80,100) | −9,282 (108,033) | 31,144 (63,627) |
| Sedentary and light activity (min/day) | 1,419 (22.71) | 1,419 (22.16) | 1427 (12.11) | 1422a (10.97) | 0.60 (2.85) | −2.65a (4.83) |
| Moderate activity (min/day) | 21 (22.46) | 20 (21.25) | 13 (11.12) | 18a (10.61) | 30.66 (3.07) | 5.48a (2.98) |
| Systolic BP(mmHg) | 131 (15) | 134 (16) | 133 (19) | 126 (12) | 3 (15) | −7a (16) |
| Diastolic BP(mmHg) | 79 (11) | 77 (11) | 76 (10) | 73 (8) | −2 (9) | −3 (11) |
| HbA1c (%) | 8.4 (1.06) | 8.1 (0.87) | 8.9 (1.15) | 7.7a (1.23) | −0.32 (1.02) | −1.16a (1.04) |
| BMI (kg/m2) | 33.81 (4.86) | 33.93 (5.34) | 37.11 (6.68) | 36.58a (6.61) | −0.12 (2.35) | −0.53a (0.75) |
p < 0.05.
Although the mean self-efficacy score for the “Making time” for exercise subscale showed a non-significant increase for participants in the intervention group, this score decreased significantly (p < 0.05) for the control group (within-group change). The between-group change in mean self-efficacy scores for this subscale was not significantly different.
Reliability of the SEBS, as measured by Cronbach’s α, was calculated for 52 and 45 participants at pre-intervention and post-intervention, respectively. The reliabilities for the “Making time” subscale were low (α = 0.64) at pre-intervention and high (α = 0.85) at post-intervention. In contrast, the reliabilities of the “Stick to it” subscale were high at both pre- and post-intervention (α = 0.87 and α = 0.94, respectively). Similarly, the reliabilities for the total scale at pre- and post-intervention were 0.89 and 0.84, respectively. Only one instrument question, “Attend a party only after exercising,” had a low corrected item-total correlation (0.17) at pre-intervention. Deleting this item would have improved the alpha to 0.76.
5.3. Physical activity levels
Activity counts of the intervention group increased significantly from pre- to post-intervention (p < 0.05, Table 2), but the between-group difference was not significantly different and may be attributed to the large standard deviations observed in this data. The amount of sedentary and light activity decreased significantly within the intervention group (p < 0.05) and between groups from pre- to post-intervention (p < 0.05). Moderate-intensity activity significantly increased from pre- to post-intervention within the intervention group (p < 0.05) and between groups (p < 0.05). While not significantly different at the 0.05 level, the intervention group appears to have lower activity counts and moderate activity at baseline than the control group. Neither group on average reached the recommended 30 min of moderate activity per day. Of the 28 individuals who had an increase in moderate activity minutes, 19 of 21 (90.5%) were in the intervention group while only 9 of 25 (36%) were control group participants (p < 0.05).
5.4. Blood pressure
Systolic BP showed a near-significant decrease (p = 0.05, Table 2) within the intervention group from pre- to post-intervention, and a significant decrease between groups (p < 0.05). In contrast, diastolic BP did not change within either group or between-groups from pre- to post-intervention. More participants in the intervention group had an increase in their BP medication (19%) than in the control group (4%), and this difference was significant (p < 0.05). When participants with a change in BP medications were removed from the analysis, the change (pre- to post-intervention) in systolic BP between groups was no longer significant.
5.5. Glycemic control
HbA1c levels improved in both groups from pre- to post-intervention. However, only intervention participants’ HbA1c decreased significantly (p < 0.05, Table 2) from pre- to post-intervention. Furthermore, the between-group difference was significant (p < 0.05), supporting the counseling intervention impact on glycemic control. More participants in the control group (20%) had a dose increase of diabetes medications than those in the control group (14.3%), but this difference was not significant. The between-group difference remained significant (p < 0.05) after removing participants whose dose of diabetes medications had been increased.
5.6. BMI
Mean BMI decreased from pre- to post-intervention in both groups, but this decrease was significant only in the intervention group (p < 0.05, Table 2). In addition, the between-group decrease in BMI was significant (p < 0.05). While not significantly different at the 0.05 level, the intervention group appears to have a greater BMI at baseline than the control group.
5.7. Effect sizes
Effect sizes were calculated and showed a range of small to large effects using Cohen’s criteria [32]. Small effect sizes were found for activity counts (0.22), sedentary/light activity minutes (0.19), self-efficacy “Making time” subscale (0.07) and diastolic BP (0.06). Medium effect sizes were shown for HbA1c (0.39), self-efficacy “Stick to it” subscale (0.38), BMI (0.36), systolic BP (0.33). Only one variable, moderate activity minutes (0.72), had a large effect size.
6. Discussion
Unlike standard individualized diabetes education, the CGMS physical activity intervention was innovative because it provided each individual feedback on their unique glucose response to physical activity and each participant could see the potential to improve this response by viewing CGMS role model data. As a result, outcomes of this pilot study revealed that the intervention group participants had more confidence than control group participants in their ability to stick to a regular physical activity regimen and they achieved lower HbA1c, lower BMI, and higher physical activity levels, with less time spent in light activity and more time spent in moderate level activity pre- to post-intervention. These findings are similar to those of other studies in which individualized, theoretically derived interventions increased physical activity levels [6,8,27,33], decreased BP [6,27], decreased HbA1c [6,27] and decreased BMI [6] of individuals with type 2 diabetes. Unlike this study, the control groups in those studies were not given standardized diabetes education, but were given routine medical care [6], an exercise leaflet [27], or no information [8,33]. Both groups in this study received components of the International Diabetes Center curriculum, which includes diet, exercise, glucose monitoring, and foot care with behavioral counseling strategies, such as goal setting [30]. A recent meta-analysis reported that studies emphasizing exercise behaviors had greater impacts on HbA1c than those targeting multiple self-management behaviors [34]. Our behavioral intervention utilizing CGMS to focus on physical activity is consistent with these findings and raises the possibility that adding CGMS may have enhanced the behavioral component.
The predictability of self-efficacy has been demonstrated for several diabetes self-care behaviors [35–37], but changes in self-efficacy behavior have not typically been included in physical activity intervention studies on individuals with type 2 diabetes [38]. However, physical activity self-efficacy (both “Making time” and “Resisting relapse”) significantly increased at 8 weeks and 6 months after a behavioral intervention targeting physical activity in individuals with type 2 diabetes (N = 358); these changes were not significantly different at 1 year [39]. The participants of that study had a variety of health conditions, including diabetes. The intervention included two appointments with a general practitioner and two follow-up phone calls by a physical activity counselor over 8 weeks. Despite these differences, our results and those of VanSluijs et al. [39] are consistent in demonstrating that self-efficacy is a modifiable behavioral variable. Furthermore, our findings extend those of the previous study [39] by demonstrating that physical activity levels can be increased to moderate levels by designing an intervention that targets participants’ self-efficacy for physical activity and uses feedback from a continuous physiological measurement.
Physical activity levels in our study improved significantly over time within and between groups, but most participants did not reach the 30 min of moderate-level activity per day recommended by the ADA, American College of Sports Medicine [9,10], and the study curriculum. It is unclear why this recommended target was not attained. One possibility is that the activity monitor did not capture participant activities such as bicycling, weight lifting, and swimming. Several intervention group participants set goals for these activities, although only a few subjects recorded them on the activity monitor log. Another possibility is that insufficient emphasis was placed on attaining the goal of 30 min/day despite both groups receiving sample walking plans to achieve this goal. Nine participants in the control group, in comparison to 19 in the intervention group, increased their activity levels from baseline. This finding contrasts to other studies that have shown a decrease in physical activity over time in control group participants when individuals received an exercise leaflet [7] or no information [8,33], but is similar to findings in another study that provided routine care [6]. Control group participants that improved their physical activity levels in our study might have responded to the 90 min routine counseling and walking brochure because they were at a stage of readiness to make a change in behavior. However, stage of change was not measured in this study.
Our results differ in some aspects from those of a randomized control study on a physical activity intervention in 70 individuals with type 2 diabetes [27]. Like our results, physical activity levels, measured by both activity monitor (counts/week) and 7-day physical activity recall (min/week), increased significantly for intervention group participants. However, 22 of 30 (73%) experimental participants reached the recommended 30 min/day compared to only 4 of 31 (13%) of control group participants. Although different methodologies of measuring activity between our study and Kirk et al. [27] make direct comparisons difficult, both studies show an increase in physical activity in response to the behavioral intervention. Furthermore, we were able to quantify the amount of time spent at different activity levels. In contrast to the current study, Kirk et al. [27] categorized participants by stage of change. While 70 participants in that study were at the contemplation or preparation stage, 17 were already meeting the recommended 30 min of daily exercise at baseline [27]. In our study, stage of change was not measured and our design excluded individuals already physically active more than 2 days/week.
The significant decreases in HbA1c and BMI from pre- to post-intervention in this study are consistent with results of two studies on physical activity behaviors, i.e., intervention group participants had significantly decreased HbA1c [6,27] and BMI [6]. HbA1c decreased 0.31% over 6 months [27] and 0.60% over 2 years [6]. The large decrease in HbA1c (1.16%) found in our intervention group may have resulted not only from physical activity counseling, but also from changes in variables not measured. When glucose levels spiked on individualized CGMS graphs of intervention group participants, they received dietary education. Because of this study’s focus on physical activity, dietary changes were not assessed and might have resulted in a greater change in HbA1c.
BMI decreased 0.53 kg/m2 over the 8 weeks of this study, similar to the 0.40 kg/m2 decrease found over 2 years in a physical activity counseling study [6] of people with type 2 diabetes. However, this effect was seen over a much shorter period in our study. In contrast, no significant decreases were reported in BMI or weight in other studies using individualized, behavioral counseling to influence physical activity in individuals with type 2 diabetes [8,27,33]. Our differences in effect on BMI may be attributed to several causes. Participants in other physical activity studies [6,27], unlike those in our study, were taking insulin which can impair weight loss. The types of physical activity interventions also differed among the studies, which may have influenced BMI changes. Lastly, other variables not measured in the studies may have influenced BMI outcomes. For example, dietary changes such as portion control, choosing fewer high-calorie foods, or decreased appetite and improved mood related to increased physical activity may have contributed to our finding of significantly decreased BMI.
Our study results have some limitations. Only short-term outcomes were analyzed; thus, significant changes in physical activity self-efficacy, physical activity levels, BP, HbA1c and BMI might not be sustained over a longer time. Furthermore, intervention group participants may have had more room to improve than control group participants on measures of BMI and activity levels, since these variables were marginally higher and lower, respectively, at baseline. The small sample prohibits generalizing findings to a larger group of people with diabetes and analyzing outcomes by characteristics such as race and gender. Other possible limitations relate to variables that were not measured including dietary changes, blood glucose monitoring, and other psychological/sociological constructs (e.g. readiness to change and quality of life). Moreover, the recent version of the SEBS scale used in this study has new scoring directions that reduce the item total on the “Making time” self-efficacy subscale and may account for the non-significant “Making-time” findings. Lastly, neither participants nor interventionist were blinded to group placement.
In conclusion, it is feasible and beneficial to use CGMS technology to counsel individuals with type 2 diabetes to change their physical activity behavior. Participants in the intervention group did not reach the recommended 30 min of physical activity most days per week, but our 8-week pilot study demonstrates the potential effectiveness of behavioral strategies to change physical activity behaviors. This intervention incorporated CGMS feedback into a relatively brief (90 min) individualized counseling session on physical activity, was shown to be effective, and may be applicable in ambulatory settings.
Acknowledgments
This study was supported by National Institute of Health Grant F31 NR008818-01A1. Minimed Medtronic provided a small equipment grant and Bio-Rad Laboratories provided all HbA1c assays. We are grateful to our statistician Dr. Penny Pekow and our editor, Claire Baldwin.
Footnotes
Conflict of interest statement
The authors state that they have no conflict of interest.
References
- 1.Nelson KM, Reiber G, Boyko EJ, HANES Diet and exercise among adults with type 2 diabetes: findings from the third national health and nutrition examination survey (NHANES III) Diabetes Care. 2002;25:1722–1728. doi: 10.2337/diacare.25.10.1722. [DOI] [PubMed] [Google Scholar]
- 2.Peyrot M, Rubin RR, Lauritzen T, Snoek FJ, Matthews DR, Skovlund SE. Psychosocial problems and barriers to improved diabetes management: results of the Cross-National Diabetes Attitudes, Wishes and Needs (DAWN) Study. Diabet Med. 2005;22:1379–1385. doi: 10.1111/j.1464-5491.2005.01644.x. [DOI] [PubMed] [Google Scholar]
- 3.Bandura A. Social Foundations of Thought and Action: A Social Cognitive Theory. Prentice-Hall; Englewood Cliffs, NJ: 1986. [Google Scholar]
- 4.Bandura A. Self-efficacy: The Exercise of Control. W.H. Freeman and Company; New York: 1997. [Google Scholar]
- 5.Plotnikoff RC, Brez S, Hotz SB. Exercise behavior in a community sample with diabetes: understanding the determinants of exercise behavioral change. Diabetes Educ. 2000;26:450–459. doi: 10.1177/014572170002600312. [DOI] [PubMed] [Google Scholar]
- 6.Di Loreto C, Fanelli C, Lucidi P, Murdolo G, De Cicco A, Parlantie N, et al. Validation of a counseling strategy to promote the adoption and the maintenance of physical activity by type 2 diabetic subjects. Diabetes Care. 2003;26:404–408. doi: 10.2337/diacare.26.2.404. [DOI] [PubMed] [Google Scholar]
- 7.Kirk AF, Higgins LA, Hughes AR, Fisher BM, Mutrie N, Hillis S, et al. A randomized, controlled trial to study the effect of exercise consultation on the promotion of physical activity in people with Type 2 diabetes: a pilot study. Diabet Med. 2001;18:877–882. doi: 10.1046/j.0742-3071.2001.00570.x. [DOI] [PubMed] [Google Scholar]
- 8.Tudor-Locke CE. Preliminary outcome evaluation of the First Step Program: a daily physical activity intervention for individuals with type 2 diabetes. Patient Educ Couns. 2002;47:23–28. doi: 10.1016/s0738-3991(01)00169-0. [DOI] [PubMed] [Google Scholar]
- 9.Albright A, Franz M, Hornsby G, Kriska A, Marrero D, Ullrich I, et al. American College of Sports Medicine position stand. Exercise and type 2 diabetes. Med Sci Sports Exerc. 2000;32:1345–1360. doi: 10.1097/00005768-200007000-00024. [DOI] [PubMed] [Google Scholar]
- 10.Haskell WL, Lee IM, Pate RR, Powell KE, Blair SN, Franklin BA, et al. Physical activity and public health: updated recommendation for adults from the American College of Sports Medicine and the American Heart Association. Med Sci Sports Exerc. 2007;39:1423–1434. doi: 10.1249/mss.0b013e3180616b27. [DOI] [PubMed] [Google Scholar]
- 11.Hu G, Jousilahti P, Borodulin K, Barengo NC, Lakka TA, Nissinen A, et al. Occupational, commuting and leisure-time physical activity in relation to coronary heart disease among middle-aged Finnish men and women. Atherosclerosis. 2007;194:490–497. doi: 10.1016/j.atherosclerosis.2006.08.051. [DOI] [PubMed] [Google Scholar]
- 12.Bauman AE. Updating the evidence that physical activity is good for health: an epidemiological review 2000–2003. J Sci Med Sport. 2004;7:6–19. doi: 10.1016/s1440-2440(04)80273-1. [DOI] [PubMed] [Google Scholar]
- 13.Hu FB, Stampfer MJ, Colditz GA, Ascherio A, Rexrode KM, Willett WC, et al. Physical activity and risk of stroke in women. JAMA. 2000;283:2961–7. doi: 10.1001/jama.283.22.2961. [DOI] [PubMed] [Google Scholar]
- 14.Hasson RE, Freedson PS, Braun B. Postexercise insulin action in African-American women. J Natl Med Assoc. 2006;98:1832–1839. [PMC free article] [PubMed] [Google Scholar]
- 15.Lakka TA, Laaksonen DE, Lakka TA, Laaksonen DE. Physical activity in prevention and treatment of the metabolic syndrome. Appl Physiol Nutr Metab. 2007;32:76–88. doi: 10.1139/h06-113. [DOI] [PubMed] [Google Scholar]
- 16.Myers J, Prakash M, Froelicher V, Do D, Partington S, Atwood JE. Exercise capacity and mortality among men referred for exercise testing. N Engl J Med. 2002;346:793–801. doi: 10.1056/NEJMoa011858. [DOI] [PubMed] [Google Scholar]
- 17.Schneider SH, Shindler D. Application of the American Diabetes Association’s guidelines for the evaluation of the diabetic patient before recommending and exercise program. In: Ruderman N, Devlin JT, Schneider SH, Kriska A, editors. Handbook of Exercise in Diabetes. American Diabetes Association, Inc; Canada: 2001. [Google Scholar]
- 18.United States Surgeon General, Surgeon General’s report on physical activity and health. J Am Med Assoc. 1996:522. [Google Scholar]
- 19.Sallis JF, Pinski RB, Grossman RM, Patterson TL. The development of self-efficacy scales for health-related diet and exercise behaviors. Health Educ Res. 1988;3:283–292. [Google Scholar]
- 20.Speck BJ, Looney SW. Effects of a minimal intervention to increase physical activity in women: daily activity records. Nurs Res. 2001;50:374–378. doi: 10.1097/00006199-200111000-00008. [DOI] [PubMed] [Google Scholar]
- 21.Freedson PS, Melanson E, Sirard J. Calibration of the Computer Science and Applications, Inc. accelerometer. Med Sci Sports Exerc. 1998;30:777–781. doi: 10.1097/00005768-199805000-00021. [DOI] [PubMed] [Google Scholar]
- 22.Sallis JF, Saelens BE. Assessment of physical activity by self-report: status, limitations, and future directions. Res Q Exerc Sport. 2000;71:S1–S14. [PubMed] [Google Scholar]
- 23.Tudor-Locke CE, Myers AM. Challenges and opportunities for measuring physical activity in sedentary adults. Sports Med. 2001;31:91–100. doi: 10.2165/00007256-200131020-00002. [DOI] [PubMed] [Google Scholar]
- 24.Shephard RJ. Limits to the measurement of habitual physical activity by questionnaires. Br J Sports Med. 2003;37:197–206. doi: 10.1136/bjsm.37.3.197. [DOI] [PMC free article] [PubMed] [Google Scholar]
- 25.Matthew CE, Matthew CE. Calibration of accelerometer output for adults. Med Sci Sports Exerc. 2005;37:S512–S522. doi: 10.1249/01.mss.0000185659.11982.3d. [DOI] [PubMed] [Google Scholar]
- 26.Keyserling TC, Samuel-Hodge CD, Ammerman AS, Ainsworth BE, Henriquez-Roldan CF, Elasy TA, et al. A randomized trial of an intervention to improve self-care behaviors of African-American women with type 2 diabetes: impact on physical activity. Diabetes Care. 2002;25:1576–1583. doi: 10.2337/diacare.25.9.1576. [DOI] [PubMed] [Google Scholar]
- 27.Kirk AF, Mutrie N, MacIntyre P, Fisher M. Increasing physical activity in people with type 2 diabetes. Diabetes Care. 2003;26:1186–1192. doi: 10.2337/diacare.26.4.1186. [DOI] [PubMed] [Google Scholar]
- 28.Paschali AA, Goodrick GK, Kalantzi-Azizi A, Papadatou D, Balasubramanyam A, Paschali AA, et al. Accelerometer feedback to promote physical activity in adults with type 2 diabetes: a pilot study. Percept Mot Skills. 2005;100:61–68. doi: 10.2466/pms.100.1.61-68. [DOI] [PubMed] [Google Scholar]
- 29.Piette JD. Interactive behavior change technology to support diabetes self-management: where do we stand? Diabetes Care. 2007;30:2425–2432. doi: 10.2337/dc07-1046. [DOI] [PubMed] [Google Scholar]
- 30.Rickheimn P, Flader J, Carstensen K. Type 2 Diabetes Basics. 2. International Diabetes Center; Minneapolis: 2004. [Google Scholar]
- 31.Weight-control Information Network. Walking a Step in the Right Direction. [accessed on January 1, 2004]; http://www.win.niddk.nih.gov/publications/walking.htm.
- 32.Cohen J. Statistical Power and Analysis for the Behavioral Sciences. 2. Academic Press; New York: 1988. [Google Scholar]
- 33.Tudor-Locke C, Bell RC, Myers AM, Harris SB, Ecclestone NA, Lauzon N, et al. Controlled outcome evaluation of the First Step Program: a daily physical activity intervention for individuals with type II diabetes. Int J Obes Relat Metab Disord. 2004;28:113–119. doi: 10.1038/sj.ijo.0802485. [DOI] [PubMed] [Google Scholar]
- 34.Conn VS, Hafdahl AR, Mehr DR, LeMaster JW, Brown SA, Nielsen PJ, et al. Metabolic effects of interventions to increase exercise in adults with type 2 diabetes. Diabetologia. 2007;50:913–921. doi: 10.1007/s00125-007-0625-0. [DOI] [PubMed] [Google Scholar]
- 35.Nelson KM, McFarland L, Reiber G, Nelson DM, McFarland L, Reiber G, et al. Factors influencing disease self-management among veterans with diabetes and poor glycemic control. J Gen Intern Med. 2007;22:442–447. doi: 10.1007/s11606-006-0053-8. [DOI] [PMC free article] [PubMed] [Google Scholar]
- 36.Sarkar U, Fisher L, Schillinger D, Sarkar U, Fisher L, Schillinger D, et al. Is self-efficacy associated with diabetes self-management across race/ethnicity and health literacy? Diabetes Care. 2006;29:823–829. doi: 10.2337/diacare.29.04.06.dc05-1615. [DOI] [PubMed] [Google Scholar]
- 37.Weijman I, Ros WJ, Rutten GE, Schaufeli WB, Schabracq MJ, Winnubst JA, et al. The role of work-related and personal factors in diabetes self-management. Patient Educ Couns. 2005;59:87–96. doi: 10.1016/j.pec.2004.10.004. [DOI] [PubMed] [Google Scholar]
- 38.Allen NA. Social cognitive theory in diabetes exercise research: an integrative literature review. Diabetes Educ. 2004;30:805–819. doi: 10.1177/014572170403000516. [DOI] [PubMed] [Google Scholar]
- 39.Van Sluijs EM, Van Poppel MN, Twisk JW, Brug J, Van Mechelen W. The positive effect on determinants of physical activity of a tailored, general practice-based physical activity intervention. Health Educ Res. 2005;20:345–356. doi: 10.1093/her/cyg129. [DOI] [PubMed] [Google Scholar]