Abstract
The evolution of two species with different fitness is investigated on degree-heterogeneous graphs. The population evolves either by one individual dying and being replaced by the offspring of a random neighbor (voter model (VM) dynamics) or by an individual giving birth to an offspring that takes over a random neighbor node (invasion process (IP) dynamics). The fixation probability for one species to take over a population of N individuals depends crucially on the dynamics and on the local environment. Starting with a single fitter mutant at a node of degree k, the fixation probability is proportional to k for VM dynamics and to 1/k for IP dynamics.
In this letter, we investigate the likelihood for fitter mutants to overspread an otherwise uniform population on heterogeneous graphs by evolutionary dynamics. Such a process underlies epidemic propagation [1], emergence of fads [2], social cooperation [3], or invasion of an ecological niche by a new species [4–6]. At each update event, two individuals from a total population N are chosen at random. One individual replicates while the other dies and is replaced by the newly-born offspring, so that N remains constant. A selective advantage, or fitness, also exists in which each each individual may be a unit-fitness genotype 1 or genotype 0 with lower fitness 1 − s, with 0 < s < 1. These fitnesses determine the replication or death rates of each individual. This selective advantage leads to a dynamical competition in which selection dominates for large populations, while random genetic drift [7, 8] occurs for small populations or weak selection.
We consider three evolutionary models, distinguished by the order in which a pair individuals replicate and die:
Biased Link Dynamics (LD)
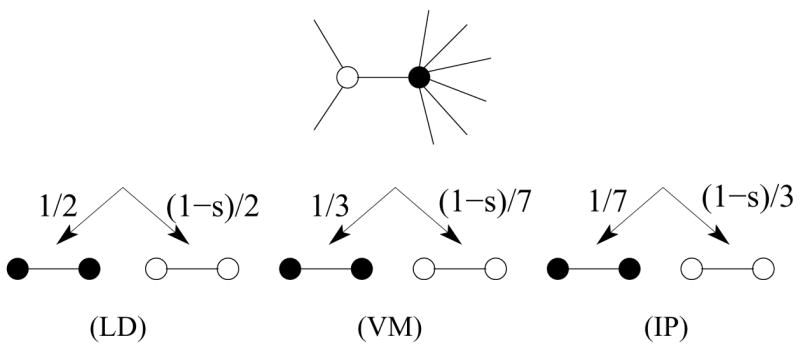
A link is selected at random. If the individuals at the link ends are different, one of them is designated as the “donor” with probability proportional to its fitness. The replicate of the donor then replaces the other individual: 10 → 11 with probability 1/2 while 10 → 00 with probability (1−s)/2 (Fig. 1).
FIG. 1.

Update illustration for two specific nodes. Genotypes 0 and 1 are denoted by ○ and ● respectively. Shown are the possible transitions and their respective relative rates due to the interaction of two nodes across a link for LD, VM, and IP dynamics.
Biased Voter Model (VM)
An individual dies with probability inversely proportional to its fitness, and is then replaced by the offspring of a randomly-chosen neighbor. Equivalently, death occurs randomly and replacement is proportional to the fitness of the donor. We implement the VM by updating a randomly-chosen genotype 0 with probability 1, while the fitter genotype 1 is updated with a probability 1 − s. Each individual in this death-first/birth-second process can equivalently be viewed as a voter that adopts the opinion of a randomly-selected neighbor [9–11].
Biased Invasion Process (IP)
In this birth-first/death-second process, a randomly-chosen individual replicates with probability proportional to its fitness, and its offspring then replaces an individual at a randomly-chosen neighboring node [4, 5, 8].
One genotype ultimately replacing all other genotypes in the population is termed fixation. An important, and easily checked fact is that these evolutionary models are equivalent on degree-regular graphs; moreover, as we will show, the fixation probability in LD can be obtained exactly, independent of the underlying graph. However, essential differences arise on degree-heterogeneous networks [11–13] that may lead to an enhancement of the fixation probability, as discovered previously for the IP [6]. Here we cast LD, VM, and IP on degree-heterogeneous graphs within the same unifying framework to understand the interplay between selection and random drift on the fixation probability. By this approach, we show that on degree-heterogeneous graphs the best strategy to reach fixation with VM dynamics is for the fitter genotype to be on high-degree nodes. Conversely, for IP dynamics, it is best for the fitter genotype to be on low-degree nodes.
We first study the evolution in VM dynamics. We symbolically represent the state of the system by η. In an elemental time interval δt we choose a random node x. If the genotype at this node at time t, denoted as ηt(x), equals 0, then node x is updated by choosing a random neighbor y and setting η (t+δt)(x) = ηt(y) (Fig. 1). However if ηt(x) = 1, the VM update is implemented with probability 1− s. This update rule can be written as
| (1) |
where ηx denotes the state obtained from η by changing only the genotype at node x. The first term describes the update step for the case where (η(x), η(y)) = (0, 1) and x, y are connected. Each of the nearest neighbors y of x may be selected with probability Axy/kx. Here Axy is the adjacency matrix whose elements equal 1 if xy are connected and zero otherwise. The second term in Eq. (1) is explained analogously.
For degree-heterogeneous graphs, the density ρk of genotype 1 at nodes of degree k increases by 1/Nk with probability Fk(η) and decreases by 1/Nk with probability Bk(η) in an elemental update, where
| (2) |
are the forward (0 → 1) and backward (1 → 0) evolution rates. The primes on the sums denote the restriction that the degree of nodes x equals k. The sum over all k then gives the total transition rate of Eq. (1). We seek the fixation probability Φ to the state consisting entirely of genotype 1 as a function of the initial densities of 1. This probability obeys the backward Kolmogorov equation GΦ = 0 [14], subject to the boundary conditions Φ(0) = 0 and Φ(1) = 1. In the diffusion approximation, the generator G of this equation may be expressed as a sum of the changes in ρk over all k,
| (3) |
with δρk = 1/Nk = 1/(N nk) the change in ρk in a single update of a node of degree k, and .
For the special case of degree-regular graphs, where kx = k for all nodes, both sums in Eq. (2) count the total number α of active links between different genotypes
| (4) |
where the moments of the degree distribution are defined by . The generator thus reduces to
| (5) |
where we use δρ = δt = 1/N. In this form, the convection and diffusion terms differ by a factor . Thus selection dominates when the population N is larger than , while random genetic drift is important otherwise.
Notice that the probability of increasing the density of genotype 1 at each update is a factor 1/(1 − s) larger than the probability of decreasing the density. By its construction, this same bias arises for LD on general networks. As a consequence of this bias, the evolutionary process underlying fixation is the same as the absorption of a uniformly biased random walk in a finite interval [14], from which the fixation probability is
| (6) |
The former is the exact discrete solution of GΦ = 0 on a finite network, while the latter continuum limit represents the solution to GΦ = 0 in the diffusion approximation. These results apply for all three models on degree-regular graphs and for LD on general graphs.
For degree-heterogeneous graphs, the conserved quantity for neutral dynamics (s = 0) is the average degree-weighted density ω1 [11, 12], where the degree-weighted moments are
| (7) |
while the overall density ρ of genotype 1 is no longer conserved. The existence of this new conservation law suggests that we study the time evolution of the expectation value of ω1 which we henceforth denote as ω for notational simplicity. Since ω(ηx) = ω(η) + kx(1 − 2η(x))/μ1N,
| (8) |
Notice that ω is conserved in the absence of selection (s = 0) a feature that ultimately stems from the update rate being inversely proportional to node degree [Eq. (1)]. To evaluate the expression in Eq. (8) we make the mean-field assumption that the degrees of connected nodes in the graph are uncorrelated. Thus we replace the elements of the adjacency matrix by their expected values, Axy = kxky/μ1N. This assumption simplifies Eq. (8) to ∂tω = sω(1 − ω), with solution ω(t)−1 = 1 − [1 − ω(0)−1]e−st.
For uncorrelated graphs, Eqs. (2) simplify to
| (9) |
Thus the time evolution of the expectation value of ρk is
| (10) |
To solve this equation we combine it with ∂tω = sω(1 − ω) to give ∂t(ω− ρk) = − (ω − ρk)(1 − s(1 − ω)), with solution
| (11) |
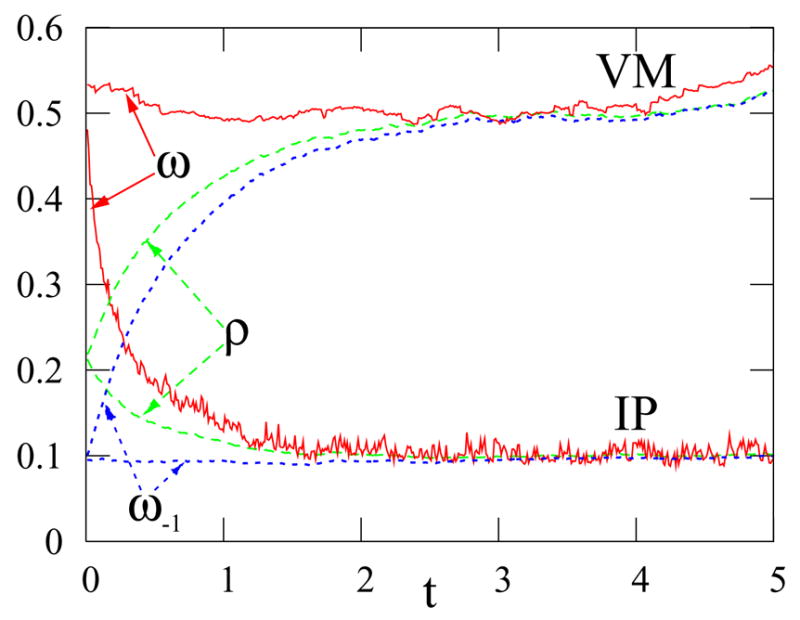
For small selective advantage (s ≪ 1), this equation involves two distinct time scales. On a time scale of order one, all the ρk become equal to ω, whereas the evolution of ω occurs on a longer time scale of order s−1 ≫1 (Fig. 2).
FIG. 2.

Moments of the 1 density in the biased VM and biased IP on a network of 104 nodes with a power-law degree distribution nk ~k−ν (ν = 2.5), and no correlations between node degrees. Nodes with degree larger than the mean degree are initialized to 1 while all other nodes are 0. For the VM, s = 8.5 × 10⁻⁴, while for the IP, s = 10−4.
We now determine the fixation probability simply by replacing the ρk by ω in the forward and backward rates F and B in Eqs. (9). In a similar vein, we replace the derivative ∂k by (knk/μ1)∂ω [11]. Then the generator in Eq. (3) becomes
| (12) |
Apart from an overall constant for the time scale, this generator is identical to that of degree-regular graphs (5) if we replace N by an effective population size . For a network of N nodes with a power-law degree distribution, nk ∞k−ν, Neff scales as [11]
| (13) |
with logarithmic corrections for ν = 2 and ν = 3. Thus Neff becomes much less than N when μ2 diverges; this occurs when ν < 3. A similar change in the effective size of the population is observed for biological species evolving in a spatially heterogeneous environment [4, 15].
The solution to GΦ = 0, with G given by Eq. (12) is
| (14) |
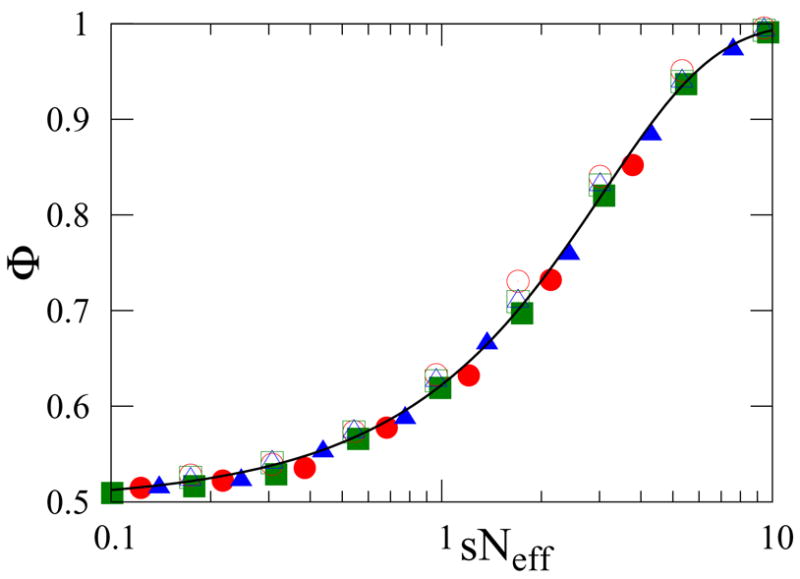
Our numerical data for the fixation probability shows both excellent scaling and agreement with this functional form for Φ (Fig. 3). Eq. (14) also provides the fixation probability when the system starts with a single mutant at a node of degree k:
| (15) |
FIG. 3.

Scaling plot of fixation probabilities for VM (filled) and IP dynamics (open symbols). Data are for degree-uncorrelated graphs with N = 103, μ1 = 8, and degree distribution exponent ν = 2.1 (○), 2.5 (△), or 3.0 (□). Initially each node is a mutant with probability 1/2, (ω1 = ω−1 = 1/2). The curve corresponds to Eqs. (14) or (19).
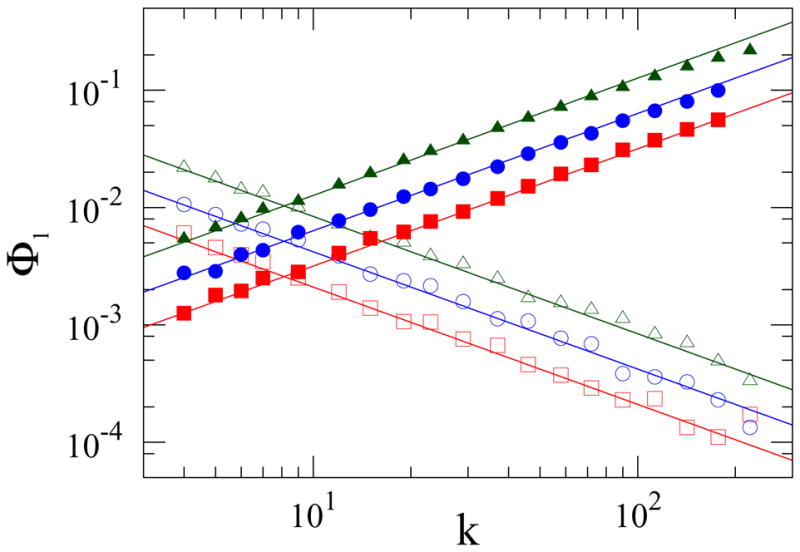
The crucial feature is that the fixation probability of a single fitter mutant is proportional to the degree of the node that it initially occupies (Fig. 4). Notice also that because the relative effect of selection versus random genetic drift is determined by the variable combination sNeff, random genetic drift can be important for much larger populations compared to the case of degree-regular graphs. In fact, for a power-law graph with ν < 2, random genetic drift prevails for all population sizes.
FIG. 4.

Fixation probability of a single mutant initially at a node of degree k on an uncorrelated power-law degree distributed (nk ~k−ν, ν = 2.5) graph with N = 103 and μ1 = 8. The empty symbols correspond to IP dynamics with s = 0.004 (□), s = 0.008 (○) and s = 0.016 (△); the filled symbols correspond to VM dynamics with s = 0.01, (■), s = 0.02 (●) and s = 0.08 (▲). The solid lines, with slopes +1 and − 1, correspond to the second of Eqs. (15) and (20).
We now study fixation in the complementary biased invasion process. Here a randomly-selected individual reproduces with probability proportional to its fitness; hence the transition probability is
| (16) |
Notice an essential difference between VM and IP dynamics. In the VM the transition rate is proportional to the inverse degree kx of the node of the disappearing genotype [Eq. (1)], while in the IP the transition rate is proportional to the inverse degree ky of the node of the reproducing genotype [Eq. (16)].
For degree-uncorrelated graphs, the transition probabilities are
| (17) |
Consequently the time evolution of ρk is given by, in analogy with Eq. (10), , from which low-order moments obey the equations of motion:
In contrast to the VM, the conserved quantity in the unbiased IP is ω−1, the inverse degree-weighted frequency. For the biased IP, ω−1 becomes the most slowly changing quantity (see Fig. 2). Hence we transform all derivatives with respect to ρk in the generator to derivatives with respect to ω−1 to yield
| (18) |
from which, in close analogy with our previous analysis of the VM, the fixation probability is
| (19) |
From Eq. (19), the effective population size Neff equals N, contrary to VM dynamics (Eq. (14)). More strikingly, the fixation probability of a single mutant acquires the non-trivial dependence of the degree k of the occupied node (Fig. 4)
| (20) |
To conclude, mutants are more likely to fixate in the voter model (VM) when they are initially on high-degree nodes [Eq. (15)], while in the invasion process (IP) fixation is more probable when mutants start on low-degree nodes [Eq. (20)]. This behavior is understandable simply. In the VM, a well-connected individual is more likely to be asked his opinion before he asks one of his neighbors. In the IP, a mutant on a high-degree node is more likely to be invaded by a neighbor before the mutant itself can invade. Thus network heterogeneity leads to effective evolutionary heterogeneity.
We can also understand the evolution when a mutant appears at a random node on a graph. In the selection-dominated regime (sNeff ≫1) of the VM, we average Eq. (15) over all nodes and find that the fixation probability on degree-uncorrelated graphs is smaller by a factor than that on regular graphs. Thus a heterogeneous graph is an inhospitable environment for a mutant that evolves by VM dynamics. Conversely, performing the same average of Eq. (20) over all nodes, the fixation probability for the IP is the same on all degree-uncorrelated graphs. Finally, in the small-selection limit (sNe ≪1), the node average fixation probability is the same for both the VM and IP on degree-uncorrelated graphs.
Acknowledgments
We gratefully acknowledge financial support from the Swiss National Science Foundation under Grant No. 8220-067591NSF (TA) as well as US National Science Foundation Grant No. DMR0535503 (SR and VS).
References
- 1.Anderson RM, May RM. Infectious Diseases in Humans. Oxford University Press; Oxford: 1992. [Google Scholar]; Pastor-Satorras R, Vespignani A. Phys Rev Lett. 2001;86:3200. doi: 10.1103/PhysRevLett.86.3200. [DOI] [PubMed] [Google Scholar]; Barthélemy M, Barrat A, Pastor-Satorras R, Vespignani A. Phys Rev Lett. 2004;92:178701. doi: 10.1103/PhysRevLett.92.178701. [DOI] [PubMed] [Google Scholar]
- 2.Watts DJ. Proc Natl Acad Sci USA. 2002;99:5766. doi: 10.1073/pnas.082090499. [DOI] [PMC free article] [PubMed] [Google Scholar]; Grönlund A, Holme P. Adv in Complex Syst. 2005;8:261. J. Bendor, B. A. Huberman, and F. Wu, arXiv.org:physics/0509217. [Google Scholar]
- 3.Santos FC, Pacheco JM. PRL. 2005;95:098104. doi: 10.1103/PhysRevLett.95.098104. [DOI] [PubMed] [Google Scholar]
- 4.Moran PAP. Proc Camb Phil Soc. 1958;54:60. [Google Scholar]
- 5.Taylor C, Fudenberg D, Sasaki A, Nowak MA. Bull Math Biol. 2004;66:1621. doi: 10.1016/j.bulm.2004.03.004. [DOI] [PubMed] [Google Scholar]; Traulsen A, Claussen JC, Hauert C. Phys Rev Lett. 2005;95:238701. doi: 10.1103/PhysRevLett.95.238701. T. Antal and I. Scheuring, arXiv:q-bio.PE/0509008. [DOI] [PubMed] [Google Scholar]
- 6.Lieberman E, Hauert C, Nowak MA. Nature. 2005;433:312. doi: 10.1038/nature03204. [DOI] [PubMed] [Google Scholar]
- 7.Kimura M. The Neutral Theory of Molecular Evolution. Cambridge University Press; Cambridge UK: 1983. [Google Scholar]
- 8.Ewens WJ. Mathematical Population Genetics. Springer; New York: 2004. [Google Scholar]
- 9.Liggett TM. Interacting Particle Systems. Springer-Verlag; New York: 2004. [Google Scholar]; Stochastic Interacting Systems: Contact, Voter, and Exclusion Processes. Springer-Verlag; New York: 1999. [Google Scholar]
- 10.Krapivsky PL. Phys Rev A. 1992;45:1067. doi: 10.1103/physreva.45.1067. [DOI] [PubMed] [Google Scholar]; Frachebourg L, Krapivsky PL. Phys Rev E. 1996;53:R3009. doi: 10.1103/physreve.53.r3009. [DOI] [PubMed] [Google Scholar]
- 11.Sood V, Redner S. Phys Rev Lett. 2005;94:178701. doi: 10.1103/PhysRevLett.94.178701. [DOI] [PubMed] [Google Scholar]
- 12.Suchecki K, Eguiluz VM, San Miguel M. Europhys Lett. 2005;69:228. [Google Scholar]
- 13.Castellano C. AIP Conf Proc. 2005;779:114. [Google Scholar]
- 14.van Kampen NG. Stochastic Processes in Physics and Chemistry. 2. North-Holland, Amsterdam: 1997. [Google Scholar]; Redner S. A Guide to First-Passage Processes. Cambridge University Press; New York: 2001. [Google Scholar]
- 15.Whitlock MC, Barton NH. Genetics. 1997;146:427. doi: 10.1093/genetics/146.1.427. [DOI] [PMC free article] [PubMed] [Google Scholar]


