Summary
Sickle hemoglobin (HbS) polymerization occurs when deoxy HbS concentration exceeds a well-defined solubility. In experiments using sickle hemoglobin droplets suspended in oil, it has been shown that when polymerization ceases the monomer concentration is above equilibrium solubility. We find that the final concentration in uniform bulk solutions (i.e. with negligible boundaries) agrees with the droplet measurements, and both exceed the expected solubility. To measure hemoglobin in uniform solutions we used modulated excitation of trace amounts of CO in gels of HbS. In this method, a small amount of CO is introduced to a spatially uniform deoxyHb sample, so that less than 2% of the sample is liganded. The liganded fraction is repeatedly photolyzed and the rate of recombination allows the concentration of deoxyHbS in the solution phase to be determined, even if polymers have formed. Both uniform and droplet samples exhibit the same quantitative behavior, exceeding solubility by an amount that depends on the initial concentration of the sample, as well as conditions under which the gel was formed. We hypothesize that the early termination of polymerization is due to the obstruction in polymer growth, which is consistent with the observation that pressing on slides lowers the final monomer concentration, making it closer to solubility. The thermodynamic solubility in free solution is thus only achieved in conditions with low polymer density or under external forces (such as found in sedimentation) that disrupt polymers. Since we find that only about 67% of the expected polymer mass forms, this result will impact any analysis predicated on predicting the polymer fraction in a given experiment.
Keywords: metastability, crowding, polymers, sickle-cell disease
Introduction
Sickle hemoglobin (HbS) is a natural mutation of normal hemoglobin (HbA). The negatively charged glutamic acid at β6 is replaced by the hydrophobic valine (Glu → Val). When deoxygenated, HbS can aggregate into long multistranded polymers if the deoxy-HbS concentration is above its solubility. These polymers aggregate in bundles and domains, rigid enough to distort the originally flexible red cells into a variety of bizarre shapes. Red cells containing polymers may in turn occlude the microcirculation, resulting in local oxygen deprivation and long-term organ damage. Sickle cell disease is one of the first diseases for which an underlying molecular origin has been identified.
Thermodynamically speaking, the reversible transition between isolated molecules and the polymer phase has been modeled as a crystallization process 1, in which the concentration of monomers in the solution at equilibrium is defined as solubility (cs). A well known way to study such behavior is by sedimentation equilibrium 2; 3; 4, in which the supernatant concentration reaches a saturating value of the solubility. Careful experiments showed that this concentration is independent of initial concentration, centrifugal force and duration (above a minimum concentration, force and time) 5. This argued strongly in favor of this final concentration being a thermodynamic parameter, since it depended only on the conditions of the final state, not the path by which the final state was achieved. Osmotic pressure measurements by Prouty et al.6 developed the thermodynamic description further. There it was shown that, although the system polymerized at a well-defined concentration, it was eventually compressible (a feature excluded in a simple two-phase model.) It has thus been assumed that the final concentration of monomers reached at the conclusion of any kinetic experiment will be the solubility. Nevertheless, this assumption remains untested mostly due to the lack of non-invasive methods to measure the solution phase concentration.
In experiments where sickle hemoglobin droplets are suspended in oil, it has recently been shown that the polymerization ceases prematurely without monomer concentration decreasing all the way to the solubility limit 7. As a result, instead of thermodynamic equilibrium, the whole system is trapped in a metastable state of supersaturation. In this method, all but a small region of a droplet of COHbS is photolyzed to deoxyHb. Photolysis has been shown to create deoxyHb reversibly, which can be maintained so long as illumination continues 8. The area masked from laser photolysis would serve as a finite reservoir for the rest of the hemoglobin droplet. The approach, which we shall call the reservoir method, uses the free diffusion between photolyzed area and masked area, so that the concentration of monomers in the masked area reflects the concentration of free hemoglobin in the gel.
A metastable state is a state of stored energy, and thus the properties of a cell or solution in such a state can be quite different from that of the system in equilibrium. In the case of hemoglobin polymers in a red cell, the polymers can act as a Brownian ratchet9; 10, and exert pressure outward. This could have important implications for pathophysiology.
Despite this surprising and important result, there are questions remaining about the possible effects of a physical boundary on polymerization. In the reservoir method, as in a red cell, a significant fraction of polymer ends could run into the edge of the droplet where they cease to propagate, leaving the solution concentration supersaturated. But it remains to be tested whether this phenomenon is uniquely associated with droplets or indeed could happen in bulk solution as well, where obstructions occur when the end of one fiber encounters the side of another. In order to observe premature termination in bulk solutions, the reservoir method cannot be used, and a different approach is needed to measure the solution concentration within the gel.
Here we use a kinetic method, modulated excitation of trace amounts of CO. In this approach, a trace amount of CO (less than 2% of the Hb sites) is introduced, and then photolyzed. The recombination rate is proportional to the concentration of unliganded hemoglobin in solution. This is ture even in the presence of gel, and thus this method can obtain the solution concentration inside the gel. 11; 12 In order to aid detection of small signal, extensive averaging is required which is accomplished by modulating the laser illumination and measuring the phase shift in the frequency domain. This method can be used in uniform bulk solutions, or in droplets.
We find that the results in uniform bulk samples support the findings in droplet measurement, that most HbS samples will cease polymerization before reaching equilibrium. Moreover, we find that cessation occurs at the same terminal concentration measured by our droplet/reservoir method or modulated excitation in uniform samples. Only in samples with very small polymer mass or samples in which mechanical disruption is introduced, such as by centrifugation, can the terminal concentration approach solubility. This metastability is most likely the result of the high concentration of polymers and their stiffness, and we show that the results are consistent with known polymer rigidity. This finding resolves a long-standing discrepancy between van't Hoff enthalpy and directly measured enthalpy13 and requires reconsideration of several important experiments including results on partially saturated samples14; 15 where the equilibrium assumption is pivotal to the analysis.
Results
The central issue of this work is to determine whether the phenomenon of metastable polymerization observed in droplets also occurs in uniform bulk solutions. Since the droplet measurements were obtained by a reservoir method, while the uniform solutions are measured by modulated excitation, it is important first of all to verify that that the two measurement techniques are equivalent. Table 1 compares the final concentration in the same droplet in an oil emulsion as measured by both modulated excitation and the reservoir method. Both approaches show higher terminal concentration than sedimentation solubility. Both methods also agree very well, differing by 0.2 ± 0.7 g/dl which is less than 1% difference in terminal concentration. Thus we conclude that the modulated excitation and reservoir methods are equivalent in measuring the final concentration of the hemoglobin in the sample.
Table 1.
Final concentrations in droplets using different methods under identical conditions.
| Initial Concentration
(g/dl) |
Temperature
(°C) |
Modulation Method
(g/dl) |
Reservoir Method
(g/dl) |
cs (g/dl)** |
|---|---|---|---|---|
| 29.1 | 25.4 | 23.9 ± 0.7 | 24.1 ± 0.2 | 17.5 |
| 23.1 | 24.8 | 20.3* ± 0.8 | 20.1 ± 1.0 | 17.7 |
| 28.2 | 24.6 | 24.2 ± 0.8 | 24.2 ± 0.4 | 17.7 |
Uniform sample (all others are droplets)
Taken from Ross, et al. 1
This equivalence allows us to investigate whether the boundaries of the droplets make any difference in the final concentrations achieved. Table 2 shows the results of experiments in which both measurements are made by modulated excitation, but now uniform samples with negligible boundaries are compared to droplets. Again, results in both samples exceed the expected solubility. The terminal concentrations differ by 0.4 ± 0.8 g/dl, but as will be shown below, the agreement is even closer, since the final results appear to depend on initial concentration. When this correction for initial concentration is taken into account, the terminal concentrations of the uniform samples and droplets only differ by 1%. Thus we conclude that the phenomena observed in the termination of polymerization before solubility is reached are not dominated by the boundary effects.
Table 2.
Final concentrations using different geometries with modulated excitation.
The terminal concentration depends on the initial concentration of the sample. Figure 1 shows the terminal concentration as a function of the initial concentration of hemoglobin for samples which are polymerized and measured without change of temperature. At a given temperature, the final concentration would be expected to be independent of initial concentration if solubility were reached; here it increases linearly with initial concentration. Measurements were made at 35°C (filled symbols) and 25°C (open squares). Both modulation (circles) and reservoir methods (triangles and squares) are shown. The dashed lines show the sedimentation-determined solubility at 35.2 °C and 25°C. From this figure, it is evident that the final solution concentration increases with increasing initial concentration regardless of which method is adopted. Remarkably, the final concentration does not appear to be sensitive to the temperature. All terminal concentrations are below the heterogeneous nucleation threshold (the dashed line, about 24 g/dl, above which heterogeneous nucleation would add new polymers in times less than the duration of the experiment). If this were not the case, heterogeneous nucleation would create new polymers which could grow and consume monomers. When initial concentration decreases, final solution concentration approaches sedimentation solubility. In Figure 2, the amount of polymer, calculated as the initial concentration minus final, is plotted as a function of the expected polymer concentration, (co − cs). The relationship is quite linear with a slope of 0.67, i.e. only 67% of the expected polymer mass forms.
FIGURE 1.
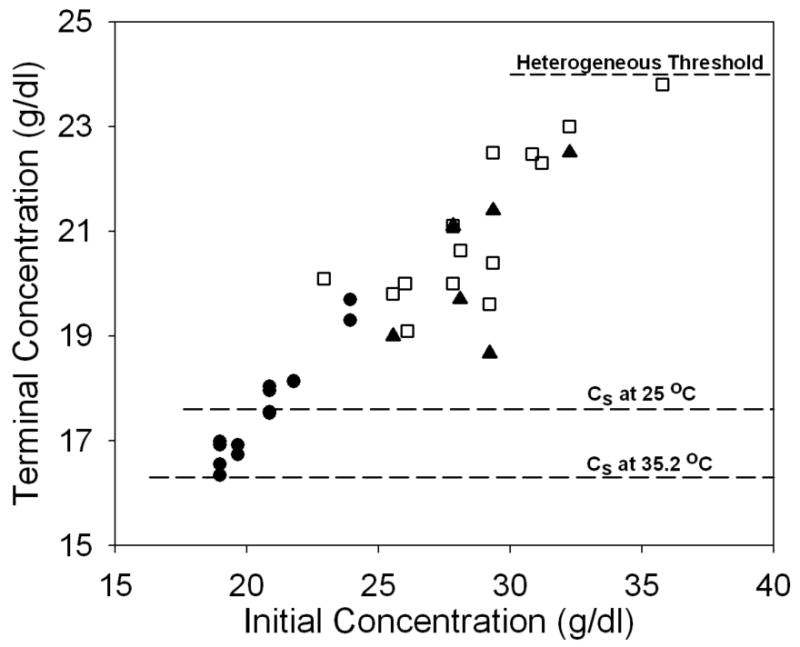
The dependence of terminal concentration on initial sample concentration. Filled circles are results from modulated excitation measurements at 35.2° C; filled triangles (35°C) and open squares (25°C) are based on the reservoir method. The dashed lines refer to the sedimentation solubility at 35.2°C and 25°C respectively1. The final solution concentration increases with increasing initial concentration regardless of which methods adopted. However, all terminal concentrations are below the heterogeneous threshold, below which heterogeneous nucleation practically shuts off (shown as the dashed line, ∼24 g/dl). Also noticeable is when initial concentration decreases, the final solution concentration approaches sedimentation solubility.
FIGURE 2.
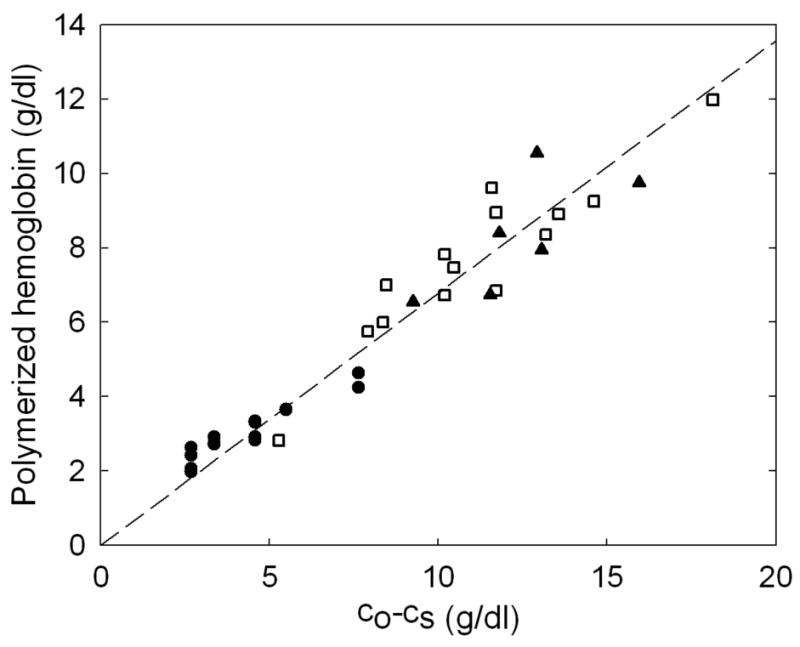
Dependence of the amount of polymer formed on expected amount of polymer. The amount of polymer is computed by subtracting the terminal concentration from the initial concentration. The amount of polymer expected is the initial concentration minus the solubility. As in Fig. 1, measurements were made at 35°C (filled symbols) and 25°C (open squares). Modulation is denoted by circles and the reservoir method by triangles and squares. The line was constrained to go through the origin, and has a best-fit slope of 0.67.
The terminal concentration depends on the path by which it is achieved, indicating it is not thermodynamically controlled. Thus, for example, a sample gelled at 25°C does not have the same final concentration of monomers as one which was gelled at 35°C and then lowered to 25°C. This behavior was observed in droplets, and is now seen in the uniform samples as well. Figure 3a shows the terminal concentration measured by the reservoir method in droplets gelled at a high temperature and then observed at a lowered temperature. Open symbols show terminal concentration after moving temperature, which in all cases is below the concentration achieved by direct polymerization at the specific temperature (filled symbols.) Figure 3b uses the same convention to show the effects measured by modulated excitation on uniform bulk solutions. The similarity to Fig 3a is evident. Although the simplicity of the reservoir approach gives greater precision on individual measurements (and hence smaller error bars), thickness of the samples undergoes a small but observable change when temperature is changed, complicating temperature-shift experiments. To account for this, once the temperature had been changed and the new concentration measured, samples were allowed to depolymerize, and the measurement of the final absorbance then established the sample thickness (assuming the concentration was the same as the initial concentration). For this reason all droplet measurements involve a single change of temperature. The modulated excitation method measures a ratio of intensities, and therefore is immune to changes in sample thickness, and thus temperature cycles could be measured as in Fig 3b.
FIGURE 3.
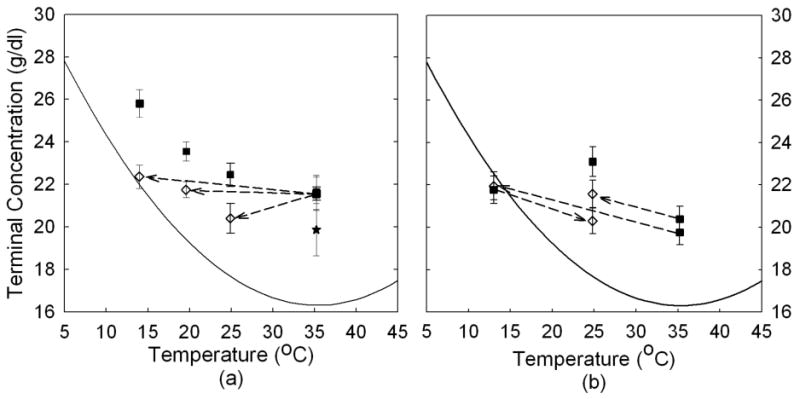
Terminal concentration as a function of temperature. The continuous line is the sedimentation solubility of HbS1. (a) Measurements made by the droplet/reservoir method. Symbols connected by broken lines were samples gelled at higher temperature: 35°C and then changed to a corresponding low temperature. They are being compared with solo points of filled symbols that were polymerized directly at the final temperature. In temperature shift experiments, all polymers were melted at the final temperature to recalibrate the change in path length. (b) Measurements made by modulated excitation on uniform samples. Symobls as in (a).
Discussion
The equivalence of the monomer concentration measured on uniform samples as well as droplets makes it clear that the results obtained on droplets are not dominated by the existence of the droplet edge, but rather must be a universal property of dense, polymerized HbS solutions. Thus it is our working hypothesis that the metastable nature of the polymerization process arises from the dense crowding of the polymers, causing polymer ends to abut the sides of other polymers, and thus effectively precluding further growth by denying monomers access to polymers ends capable of growth, or requiring polymers to bend excessively to allow further growth. It is also possible that polymer ends could attach to the sides of polymers, since the same contact sites that allow polymers to grow also appear in some surface molecules.16 Some quantification of the features of polymerization is illuminating. In the double nucleation process, the average polymer length is constant during exponential growth. In a 28 g/dl sample, the average polymer length during the tenth time (the time for polymerization to reach 1/10 of its final value) is about 0.4 μm (cf. eqn. 32 of ref 17 ) while the average domain diameter, deduced from the overall concentration of homogeneous nuclei, is about 0.6 μm. As the concentration of monomers begins to fall the heterogeneous nucleation rate drastically drops. At the point where about 10% of the reaction has occurred, the production of new polymers has effectively ceased. With no new polymers forming, but only 10% of the maximal monomer consumption reached, the average polymer length must increase substantially. If polymer growth ceases at 67% of maximum, it means that average polymer length will grow to 6.7 times the 0.4 μm value, or 2.7 μm. Thus average polymers will traverse at least 4 polymer domains, providing numerous and significant opportunities to become embedded in a cul-de-sac or attached to another polymer and therefore cease further growth.
This concept is supported by the path-dependence of the final results, as seen in Figure 3. The geometry of the polymer array or domain is set by the conditions of its creation, thus the lowering of temperature only suffices to lower the residual supersaturation, rather than to reduce the concentration of polymers. With one exception, the data is all consistent with constant final concentration, all set by the temperature at which polymerization occurred. In the cases where the lowering of temperature at constant concentration would yield a result across the solubility line, then, polymer depolymerization does occur, tracking the solubility line, and the final value rises.
The experiments by Prouty et al.6 may also be interpreted as showing elevated solubility, and so it is worth asking whether our observations may have been anticipated by those osmotic pressure measurements. (Those experiments have been analyzed, albeit with a simple lattice model, first by Hentschke and Herzfeld18 using a hard-core repulsion model, and subsequently by Han and Herzfeld19 using soft repulsions.) To understand why solubility might rise, it is useful to consider the equilibrium between monomers in solution and monomers incorporated into polymers which have the same chemical potential. In a simple solubility/crystallization model this can be written as
where μ0 is the solution chemical potential due to rotational and translational entropy, μpoly accounts for the internal stability of a polymer, cs is the solubility, and γs is the concentration-dependent activity coefficient, measured at solubility. A simple solubility/crystallization model has no interactions between polymers in the condensed phase, and thus osmotic pressure increases without increase in concentration once polymerization begins. The presence of an interaction due to polymers can be formally included by the addition of a term, Δμinter to this equation, which is dependent both on the concentration of polymerized material (co−cs) and its state of alignment (denoted α). Thus the equation becomes
When Δμinter is positive, and increasing with polymer mass, the solubility will necessarily be above that measured with just a few polymers. The presence of the interaction is also what increases osmotic pressure past the plateau region. In their analysis Han and Herzfeld find Δμinter to be positive, due to soft repulsion of polymers for other polymers and monomers, while, when they turn off the repulsion, the two-phase model appears and the osmotic plateau continues indefinitely. In this range of concentrations (19-32 g/dl at 37°C) where osmotic pressure stays constant, and the two-phase crystallization model thus works well (so Δμinter is insignificant), we nonetheless find a rising discrepancy of terminal concentration and equilibrium solubility (cf. Fig. 1). This confirms that the observations reported here are a separate phenomenon from that seen in the osmotic pressure results. Such a difference is not unexpected, since Prouty's work did appear to be an equilibrium measurement (as characterized by its path-independence), while the results here are clearly dependent on path, and so cannot represent equilibrium states of the system.
What are the implications of the findings we have presented? Perhaps the most significant, as suggested previously 7, is that polymers formed in red cells will exert an outward pressure, due to a Brownian ratchet mechanism 9. This pressure could wedge cells in capillaries, or have a variety of consequences in the cell membrane. Such pressure must be generally directed outward.
A second implication is that previous work may overestimate the fractional extent of polymerization in unperturbed samples (i.e. samples which have not been centrifuged.) A striking example appears in a major unresolved experimental discrepancy in basic studies on the polymerization of HbS. The heat transferred in the course of polymerization was expected to agree with van't Hoff analysis of solubility. The results, however were significantly different (cf. inset to Figure 4), and although some suggestions had been advanced, no conclusive resolution has been presented 1; 13. Because the heat transfer experiments occur in unperturbed samples, we would conclude that they cease polymerization prematurely, as seen here. Therefore, using the data of Ross et al, 1 we calculated the molar enthalpy for a smaller amount of polymer. Moreover, since we see that the structure is frozen by the initial temperature of polymerization, we used the value of the initial temperature to set the final fraction, while we used the value of the final temperature as the designator of the temperature to be used in the abscissa because heat transfer is not complete till then. This protocol produces good agreement between the enthalpy measured by calorimetry (the points) and the vant'Hoff analysis (the solid line) as seen in Figure 4. Not only does this resolve a long standing discrepancy, but it also shows that this phenomenon extends beyond thin-slide samples.
Figure 4.
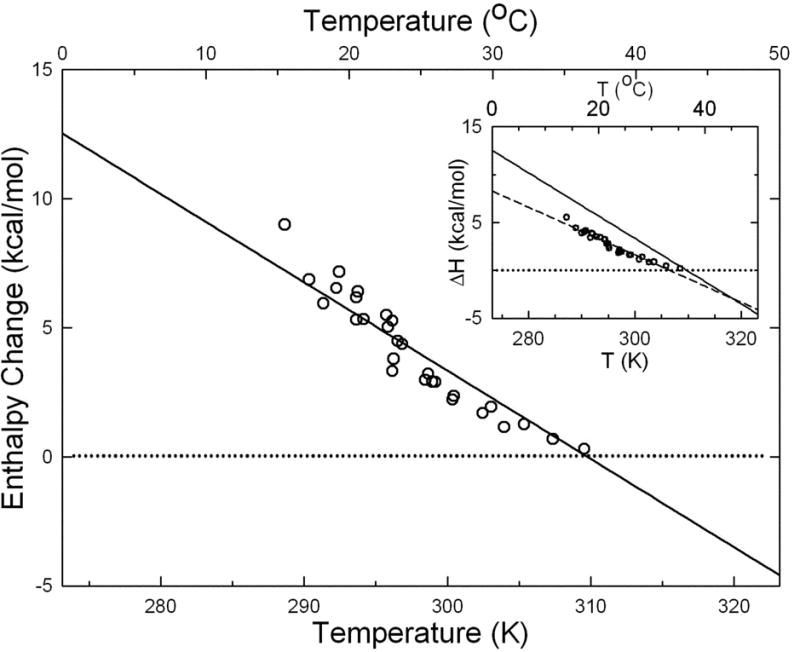
Enthalpy vs. Temperature for gels of HbS. The data is that of Ross et al.1; the inset shows the analysis of Eaton and Hofrichter13. The solid line is derived from the van't Hoff enthalpy based on the temperature dependence of the solubility. The points are from calorimetry, analyzed as in the text in accord with the observations of metastable polymerization. As seen in the major figure, the calorimetry and van't Hoff analysis agree, whereas when complete polymerization was assumed, as in the inset, the disagreement was significiant. The dashed line in the inset is simply a best fit to those points.
On the other hand, the findings presented here also require reconsideration of a number of other experiments in which it was assumed that equilbrium solubility had been achieved. One such case is the previous measurements of the polymer oxygen binding curve 15. Linear dichroism was used to determine the fractional saturation of the polymer phase in thin slides; absorbance gave the total solution fractional saturation. The fractional extent of polymerization was calculated from solubilities determined by centrifugation. As shown here, this may not accurately describe the amount of polymer in slides; however the errors also depend on total amount of polymer and whether the point of termination applies to partially liganded samples. Hence further work is required to resolve this issue. However this may also be one cause for differences observed between binding of oxygen 15 and CO 14 to polymers. In a number of other studies, calculations based on solubility have been used to deduce the amount of polymer present in a given experiment, for example, to set clinical or therapeutic targets.13; 20; 21; 22 While the results presented here do not re-order the amounts of polymer, so that correlations will remain correct, they do present a quantitative challenge. When a threshold is sought for therapy for example, the absolute amounts of polymer deduced will decidedly need further correction.
Materials and Methods
Sickle hemoglobin was purified using standard methods23 It was exchanged into 0.15 M phosphate buffer (pH 7.35) and concentrated with Centricon concentrator in the centrifuge. The concentrated HbS solution was stored in liquid nitrogen until use.
When making the sample, sodium dithionite (Na2S2O4) was mixed with the hemoglobin solution to reduce any possible methemoglobin and remove oxygen. The final concentration of sodium dithionite was adjusted to be 50-55 mM.
There are three types of samples for the purpose of this paired experiment. In the modulated excitation experiment, trace amounts of carbon-monoxide was introduced to the deoxygenated hemoglobin by blowing a stream of the certified mixture of 1010 ppm CO in N2 gas over the solution for a brief amount of time. Then after proper mixing, 2-3μl aliquot of solution were placed onto a 24 × 40 mm coverslip; quickly covered by another 18 × 18 mm coverslip to make a homogeneous sample and sealed by the Kerr sticky wax. Because sickle hemoglobin has much higher solubility at low temperatures, in order to make the gelled sample, the concentrated solution was kept in ice to melt any polymers and prevent gelation when placing it on the slide. The CO saturation for the modulated excitation experiment was kept below a few percent, as verified by the absorption spectrum.
For the reservoir method, the hemoglobin solution was saturated with CO and mixed with CO flushed castor oil. Sickle hemoglobin droplets surrounded by oil would naturally form when this emulsion was stirred and put between coverslips. A hemoglobin droplet of the size 200-300 μm was photolyzed by intense laser light except for a small masked area, where the absorption spectrum was measured by a spectrophotometer (Ocean Optics USB 2000) via fiber optics. In the photolyzed area, full photolysis was confirmed by measuring the change in absorption spectrum. Polymerization inside the photolyzed portion of the droplet would initiate the consumption of monomers, which had to be replenished from the monomers in the masked area in response to the concentration gradient otherwise. The final concentration of monomers in the unphotolyzed portion can be obtained by measuring the absorption spectrum with the knowledge of fixed path length and initial sample concentration. Figure 5 shows one droplet with a central mask.
Figure 5.
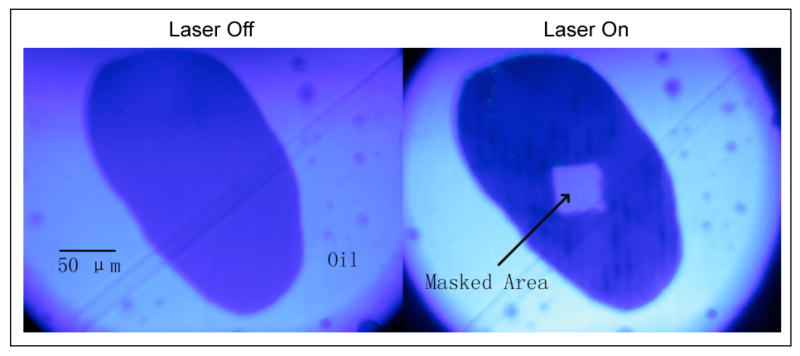
A sickle hemoglobin droplet suspended in castor oil, before and after photolysis. The size of a typical droplet is between 200 – 300 μm. A diode pumped laser (532 nm) is used as photolysis beam. A physical mask is placed along the path of laser on the conjugate image plane so that it creates a unphotolyzed mask area on the sample, which does not interfere with the probe beam for absorption measurements. The above images were taken at 432 nm, where deoxyHb absorbs much more than HbCO, as manifested by the contrast in color when laser is turned on. The darker color inside the photolyzed area on the second image indicates the presence of polymers. As the polymerization progresses, monomers diffuse from the mask segment to the photolyzed region until a final concentration is reached.
In order to eliminate sample variation, we developed a partial saturation method, where both the modulated excitation and reservoir method can be applied using the same sample. In such an approach, the hemoglobin droplet was only partially saturated with CO, whereas the surrounding oil was not. The reservoir method was conducted in a similar way. However for modulated excitation, a steady laser photolysis was maintained until the CO saturation of the slide was reduced to 1-2%, as required by the method. Using partial saturation, we were able to compare the results between two independent methods but under the same geometry.
The theory of modulated excitation has been previously described 11; 12 and will only be summarized here. A small amount of CO is introduced to a spatially uniform deoxyHb sample, so that approximately 1% of the sample is liganded and there are only two species: unliganded and singly liganded hemoglobin. The essential idea is that the rate of CO recombination is proportional to the concentration of unliganded hemoglobin in the solution. Molecules in the gel contribute negligibly to the recombination rate; therefore the concentration of reactive hemes in solution can be determined by calibrating the rate constant under equivalent conditions. To optimize signal to noise, the photolysis laser beam was modulated at angular frequency ω. The population of deoxyHb will thus oscillate with the same frequency, but with a phase lag φ that depends on the rates of the reaction. The binding rate constant kT and solution monomer concentration c0 are related to the cotangent of phase angle
| (1) |
The steady-state average laser intensity is I, and the constant a contains details of the absorbance of the exciting light, e.g. extinction coefficient, and quantum efficiency. A two-phase lock-in amplifier detects the oscillating absorbance in-phase with the laser excitation and that which is 90° out of phase, the ratio of which gives cot φ.
The rate constant kT in eq 1 was determined in a separate calibration experiment. A series of samples was employed with different initial concentrations with the same temperature and laser intensity. The rate constant for binding, kT, and the DC laser contribution aI are obtained from fitting calibration data such as shown in Figure 6. At 25°C with the specific power density we find kT = 162 mM-1s-1, and aI = 209 s-1. It is clear that the DC component aI cannot be neglected. Therefore it is not only crucial to calibrate the DC contribution but also to be sure the measurements are under equivalent conditions, viz. same laser power density and temperature. Points could be taken above solubility because of the characteristic delay time. Linearity is excellent, justifying the assumption of a single relaxation process 11; 23.
FIGURE 6.
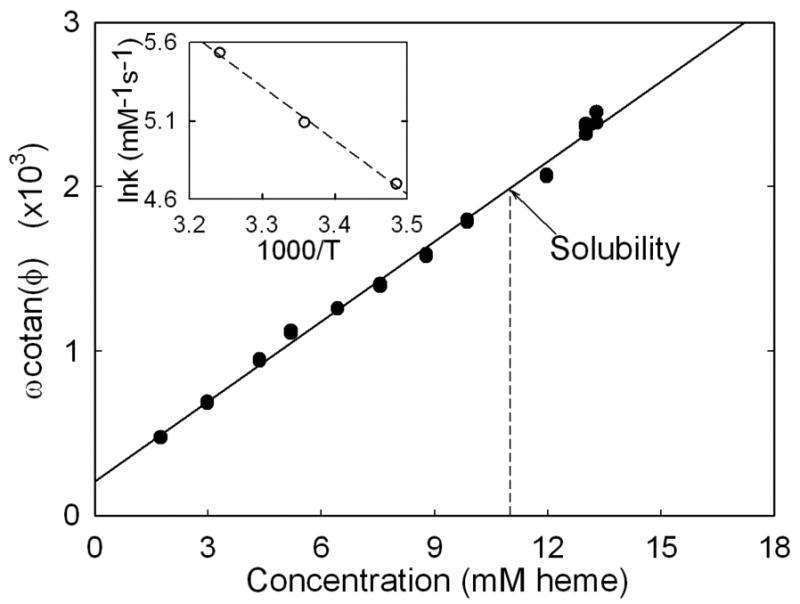
Phase angle shift: ω cotan φ is plotted as a function of sample concentration for unpolymerized HbS. ω is the angular frequency, related to f by ω = 2πf. For each experiment, ω and φ were varied with the goal of keeping φ near π/4. The data is expected to be linear from Eq. 1. The T state binding rate kT is the slope of the line, and aI is its intercept. We find kT = 162 mM-1s-1, and aI = 209 s-1. A series of samples were required for this calibration experiment whose concentrations were determined by dilution and measuring their Soret band absorption spectra. It is possible to measure these samples above the solubility because of the long delay time for those concentrations. The inset shows the natural log of the rate constant, determined as the slope, as a function of reciprocal temperature. The activation energy is determined from the slope of the inset, and is 9.6 kcal/mol.
Previously the method of modulated excitation appeared to support conventional measurements of solubility12. The present results disagree with the previous findings, which we have not been able to replicate in a substantial number of attempts. We therefore believe the prior results to be in error. This could have at least three causes. (1) If samples gelled rapidly on being placed on the microscope slide, subsequent pressure on a top slide could cause the samples to fracture, which leads to terminal concentratons that approach solubility. (2) Previous procedures did not use full spectra for measuring sample concentration in calibration experiments, but only peak values were employed of oxyHb. It is possible that a small amount of metHbS was undetected, which led the oxyHb peak to be too low, and of course the concentration would be similarly low. (3) The most likely cause is that the term aI was thought to be small enough to be neglected. Evidence of this can be inferred from Figure 1 of Liao et al.12 The rate constant cited there is approximately 315 mM-1s-1 for 25°C. If we assume that it should have been 162 mM-1s-1 as we measure here, that implies an aI term of 420 s-1, which, while somewhat high, is still plausible given the dependence of the term on the focusing of the beam as well as power used. If focus was changed between calibration and measurement, the aI term would also change. Unfortunately, in those experiments we did not record the intensity and beam size at the sample, and so we cannot establish directly the values of aI. Irrespective of the reason, a preponderance of evidence suggests that the newly reported values are actually representative, as well as the agreement of the new modulation methods with the droplet/reservoir methods.
Footnotes
Publisher's Disclaimer: This is a PDF file of an unedited manuscript that has been accepted for publication. As a service to our customers we are providing this early version of the manuscript. The manuscript will undergo copyediting, typesetting, and review of the resulting proof before it is published in its final citable form. Please note that during the production process errors may be discovered which could affect the content, and all legal disclaimers that apply to the journal pertain.
References
- 1.Ross PD, Hofrichter J, Eaton WA. Thermodynamics of gelation of sickle cell deoxyhemoglobin. J Mol Biol. 1977;115:111–134. doi: 10.1016/0022-2836(77)90093-6. [DOI] [PubMed] [Google Scholar]
- 2.Williams RC., Jr Concerted formation of the gel of hemoglobin S. Proc Natl Acad Sci U S A. 1973;70:1506–8. doi: 10.1073/pnas.70.5.1506. [DOI] [PMC free article] [PubMed] [Google Scholar]
- 3.Briehl RW, Ewert S. Effects of pH, 2,3-diphosphoglycerate, and Salts on Gelation of Sickle Cell Deoxyhemoglobin. J Mol Biol. 1973;80:445–458. doi: 10.1016/0022-2836(73)90415-4. [DOI] [PubMed] [Google Scholar]
- 4.Hofrichter J, Ross PD, Eaton WA. Kinetics and mechanism of deoxyhemoglobin S gelation: a new approach to understanding sickle cell disease. Proc Nat Acad Sci (USA) 1974;71:4864–4868. doi: 10.1073/pnas.71.12.4864. [DOI] [PMC free article] [PubMed] [Google Scholar]
- 5.Hofrichter J, Ross PD, Eaton WA. Supersaturation in sickle cell hemoglobin solutions. Proc Nat Acad Sci USA. 1976;73:3035–3039. doi: 10.1073/pnas.73.9.3035. [DOI] [PMC free article] [PubMed] [Google Scholar]
- 6.Prouty MS, Schechter AN, Parsegian VA. Chemical potential measurements of deoxyhemoglobin S polymerization. J Mol Biol. 1985;184:517–528. doi: 10.1016/0022-2836(85)90298-0. [DOI] [PubMed] [Google Scholar]
- 7.Aprelev A, Weng W, Zakharov M, Rotter M, Yosmanovich D, Kwong S, Briehl RW, Ferrone FA. Metastable polymerization of sickle hemoglobin in droplets. J Mol Biol. 2007;369:1170–4. doi: 10.1016/j.jmb.2007.04.030. [DOI] [PMC free article] [PubMed] [Google Scholar]
- 8.Ferrone FA, Hofrichter J, Eaton WA. Kinetics of sickle hemoglobin polymerization I: studies using temperature-jump and laser photolysis techniques. J Mol Biol. 1985;183:591–610. doi: 10.1016/0022-2836(85)90174-3. [DOI] [PubMed] [Google Scholar]
- 9.Daniels DR, Turner MS. The force generated by biological membranes on a polymer rod and its response: statics and dynamics. J Chem Phys. 2004;121:7401–7. doi: 10.1063/1.1794551. [DOI] [PubMed] [Google Scholar]
- 10.Daniels DR, Wang JC, Briehl RW, Turner MS. Deforming biological membranes: how the cytoskeleton affects a polymerizing fiber. J Chem Phys. 2006;124:024903. doi: 10.1063/1.2148960. [DOI] [PubMed] [Google Scholar]
- 11.Liao D, Jiang J, Zhao M, Ferrone FA. Modulated Excitation of Singly Ligated Carboxyhemoglobin. Biophys J. 1993;65:2059–2067. doi: 10.1016/S0006-3495(93)81268-2. [DOI] [PMC free article] [PubMed] [Google Scholar]
- 12.Liao D, Martin de Llano JJ, Himanen JP, Manning JM, Ferrone FA. Solubility of Sickle Hemoglobin Measured by a Kinetic Micromethod. Biophys J. 1996;70:2442–2447. doi: 10.1016/S0006-3495(96)79815-6. [DOI] [PMC free article] [PubMed] [Google Scholar]
- 13.Eaton WA, Hofrichter J. Sickle Cell Hemoglobin Polymerization. Adv Protein Chem. 1990;40:63–280. doi: 10.1016/s0065-3233(08)60287-9. [DOI] [PubMed] [Google Scholar]
- 14.Hofrichter J. Ligand binding and the gelation of sickle cell hemoglobin. J Mol Biol. 1979;128:335–369. doi: 10.1016/0022-2836(79)90092-5. [DOI] [PubMed] [Google Scholar]
- 15.Sunshine HR, Hofrichter J, Ferrone FA, Eaton WA. Oxygen binding by sickle cell hemoglobin polymers. J Mol Biol. 1982;158:251–273. doi: 10.1016/0022-2836(82)90432-6. [DOI] [PubMed] [Google Scholar]
- 16.Mirchev R, Ferrone FA. The structural origin of heterogeneous nucleation and polymer cross linking in sickle hemoglobin. J Mol Biol. 1997;265:475–479. doi: 10.1006/jmbi.1996.0759. [DOI] [PubMed] [Google Scholar]
- 17.Bishop MF, Ferrone FA. Kinetics of nucleation controlled polymerization: a perturbation treatment for use with a secondary pathway. Biophys J. 1984;46:631–644. doi: 10.1016/S0006-3495(84)84062-X. [DOI] [PMC free article] [PubMed] [Google Scholar]
- 18.Hentschke R, Herzfeld J. Theory of nematic order with aggregate dehydration for reversibly assembling proteins in concentrated solutions: application to sickle-cell hemoglobin polymers. Phys Rev A. 1991;43:7019–7030. doi: 10.1103/physreva.43.7019. [DOI] [PubMed] [Google Scholar]
- 19.Han J, Herzfeld J. Interpretation of the osmotic behavior of sickle cell hemoglobin solutions: different interactions among monomers and polymers. Biopolymers. 1998;45:299–306. doi: 10.1002/(SICI)1097-0282(19980405)45:4<299::AID-BIP4>3.0.CO;2-G. [DOI] [PubMed] [Google Scholar]
- 20.Noguchi CT, Rodgers GP, Schechter AN. Intracellular polymerization. Disease severity and therapeutic predictions. Ann N Y Acad Sci. 1989;565:75–82. doi: 10.1111/j.1749-6632.1989.tb24152.x. [DOI] [PubMed] [Google Scholar]
- 21.Brittenham GM, Schechter AN, Noguchi CT. Hemoglobin S polymerization: primary determinant of the hemolytic and clinical severity of the sickling syndromes. Blood. 1985;65:183–9. [PubMed] [Google Scholar]
- 22.Hiruma H, Noguchi CT, Uyesaka N, Hasegawa S, Blanchette-Mackie EJ, Schechter AN, Rodgers GP. Sickle cell rheology is determined by polymer fraction--not cell morphology. Am J Hematol. 1995;48:19–28. doi: 10.1002/ajh.2830480105. [DOI] [PubMed] [Google Scholar]
- 23.Cho MR, Ferrone FA. Monomer diffusion and polymer alignment in domains of sickle hemoglobin. Biophys J. 1991;63:205–214. doi: 10.1016/S0006-3495(92)81595-3. [DOI] [PMC free article] [PubMed] [Google Scholar]


