

Abstract
A fundamental aspect of all biological systems is cooperation. Cooperative interactions are required for many levels of biological organization ranging from single cells to groups of animals1–4. Human society is based to a large extent on mechanisms that promote cooperation5–7. It is well known that in unstructured populations, natural selection favors defectors over cooperators. There is much current interest, however, for studying evolutionary games in structured populations and on graphs8–17. These efforts recognize the fact that who-meets-whom is not random, but determined by spatial relationships or social networks18–24. Here we describe a surprisingly simple rule, which is a good approximation for all graphs that we have analyzed, including cycles, spatial lattices, random regular graphs, random graphs and scale-free networks25,26: natural selection favors cooperation, if the benefit of the altruistic act, b, divided by the cost, c, exceeds the average number of neighbors, k. Therefore, cooperation can evolve as a consequence of ‘social viscosity’ even in the absence of reputation effects or strategic complexity.
A cooperator is someone who pays a cost, c, for another individual to receive a benefit, b. A defector pays no cost and does not distribute any benefits. In evolutionary biology, cost and benefit are measured in terms of fitness. Reproduction can be genetic or cultural. In the latter case, the strategy of someone who does well is imitated by others. In an unstructured population, where all individuals interact equally likely with each other, defectors have a higher average payoff than unconditional cooperators. Therefore, natural selection increases the relative abundance of defectors and drives cooperators to extinction. These evolutionary dynamics hold for the deterministic setting of the replicator equation27,28 and for stochastic game dynamics of finite populations29.
In our model, the players of an evolutionary game occupy the vertices of a graph. The edges denote links between individuals in terms of game dynamical interaction and biological reproduction. We assume that the graph is fixed for the duration of the evolutionary dynamics. Consider a population of N individuals consisting of cooperators and defectors. A cooperator helps all individuals to whom it is connected. If a cooperator is connected to k other individuals and i of those are cooperators, then its payoff is bi – ck. A defector does not provide any help, and therefore has no costs, but it can receive the benefit from neighboring cooperators. If a defector is connected to j cooperators, then its payoff is bj.
The fitness of an individual is given by a constant term, denoting the baseline fitness, plus the payoff that arises from the game. Strong selection means that the payoff is large compared to the baseline fitness; weak selection means the payoff is small compared to the baseline fitness. The idea behind weak selection is that many different factors contribute to the overall fitness of an individual, and the game under consideration is just one of those factors.
At first, we will study the following update rule for evolutionary dynamics (Fig 1): in each time step, a random individual is chosen to die, and the neighbors compete for the empty site proportional to their fitness. We call this mechanism ‘death-birth’ updating, because first there is a death event followed by a birth. Later we will investigate other update mechanisms.
Fig. 1.

The rules of the game. Each individual occupies the vertex of a graph and derives a payoff, P, from interactions with adjacent individuals. A cooperator (blue) pays a cost, c, for each neighbor to receive a benefit, b. A defector (red) pays no cost and provides no benefit. The fitness of a player is given by 1 − w + wP, where w measures the intensity of selection. Strong selection means w = 1. Weak selection means w ≪ 1. For ‘death-birth’ updating, at each time step, a random individual is chosen to die; subsequently the neighbors compete for the empty site proportional to their fitness. In this example, the central vertex will change from a defector to a cooperator with a probability FC/(FC +FD), where the total fitness of all adjacent cooperators and defectors is FC = 4(1 − w) + (10b − 16c)w and FD = 4(1 − w) + 3bw, respectively.
Let us explore if natural selection can favor cooperation on certain graphs. In order to do this, we need to calculate the probability that a single cooperator starting in a random position turns the whole population from defection to cooperation. If selection neither favors nor opposes cooperation, then this probability is 1/N, which is the fixation probability of a neutral mutant. If the fixation probability of a single cooperator is greater than 1/N, then selection favors the emergence of cooperation. We also calculate the fixation probability of a single defector in a population of cooperators, and compare the two fixation probabilities.
The traditional well-mixed population of evolutionary game theory is represented by the complete graph, where all vertices are connected. In this special situation, cooperators are always opposed by selection. This is the fundamental intuition of classical evolutionary game theory. But what happens on other graphs?
Let us first consider a cycle. Each individual is linked to two neighbors. A single cooperator could be wiped out immediately or take over one of its two neighbors. A cluster of two cooperators could expand to three cooperators or revert to a single cooperator. In any case, the lineage starting from one cooperator always forms a single cluster of cooperators, which cannot fragment into pieces. This fact allows a straightforward calculation. We find that selection favors cooperation if b/c > 2. This result holds for weak selection and large population size.
Next, we study regular graphs, where each individual has exactly k neighbors. Such graphs include cycles, spatial lattices and random regular graphs. For all those graphs, a direct calculation of the fixation probability is impossible, because a single invader can lead to very complicated patterns: the emerging cluster usually break into many pieces allowing a large number of conceivable geometric configurations. In general, the inherent complexity of games on graphs makes analytical investigations almost always impossible.
Nevertheless, we can calculate the fixation probability of a randomly placed mutant for any two-person, two-strategy game on a regular graph by using pair approximation and diffusion approximation (see online Supplementary Information). In particular, we find that cooperators have a fixation probability greater than 1/N and defectors have a fixation probability less than 1/N, if
The ratio of benefit to cost of the altruistic act has to exceed the degree, k, which is given by the number of neighbors per individual. This condition is derived for weak selection and under the assumption that the population size, N, is much larger than the degree, k.
There is excellent agreement with numerical simulations (Fig 2). For a given population size, b/c > k is a necessary condition for selection to favor cooperators. As the population size increases, the discrepancy between b/c > k and the numerical simulations becomes smaller. Moreover, we find that the rule also holds for random graphs25 and scale-free networks26,27, where individuals differ in the number of their neighbors. Here k denotes the average degree of the graph. Scale free networks fit slightly less well than random graphs, presumably because they have a larger variance of the degree distribution.
Fig. 2.

The simple rule, b/c > k, is in good agreement with numerical simulations. The parameter k denotes the degree of the graph, which is given by the (average) number of neighbors per individual. The first row illustrates the type of graph for (a) k = 2 and (b–e) k = 4. The second and third rows show simulation data for population sizes N = 100 and N = 500. The fixation probability, ρ, of cooperators is determined by the fraction of runs where cooperators reached fixation out of 106 runs under weak selection, w = 0.01. Each type of graph is simulated for different (average) degrees ranging from k = 2 to k = 10. The arrows mark b/c = k. The dotted horizontal line indicates the fixation probability 1/N of neutral evolution. The data suggest that b/c > k is necessary but not sufficient. The discrepancy is larger for non-regular graphs (d,e) with high average degree (k = 10). This is not surprising given that the derivation of the rule is for regular graphs and in the limit N ≫ k. Note that the larger population size, N = 500, gives better agreement.
The intuitive justification for the b/c > k rule is illustrated in Fig 3. Consider one cooperator and one defector competing for an empty site. The payoff for the cooperator is PC = bqC|C(k − 1)− ck. The payoff for the defector is PD = bqC|D(k − 1). The conditional probability to find a cooperator next to a cooperator is qC|C and to find a cooperator next to a defector is qC|D. The cooperator pays cost c for all of its k neighbors and receives benefit b from each cooperator among its k − 1 neighbors excluding the contested site. The defector pays no cost, but receives benefit b from each cooperator among its k − 1 neighbors also excluding the contested site. The payoff that comes from the contested site is excluded, because it contributes equally to the cooperator and the defector and therefore cancels out. If PC > PD, then selection favors the cooperator. Pair-approximation shows that (k − 1)(qC|C − qC|D) = 1 for weak selection. Thus, the cooperator has on average one more cooperator neighbor than the defector. Therefore, we obtain PC − PD = b − ck, which leads to the b/c > k rule.
Fig. 3.
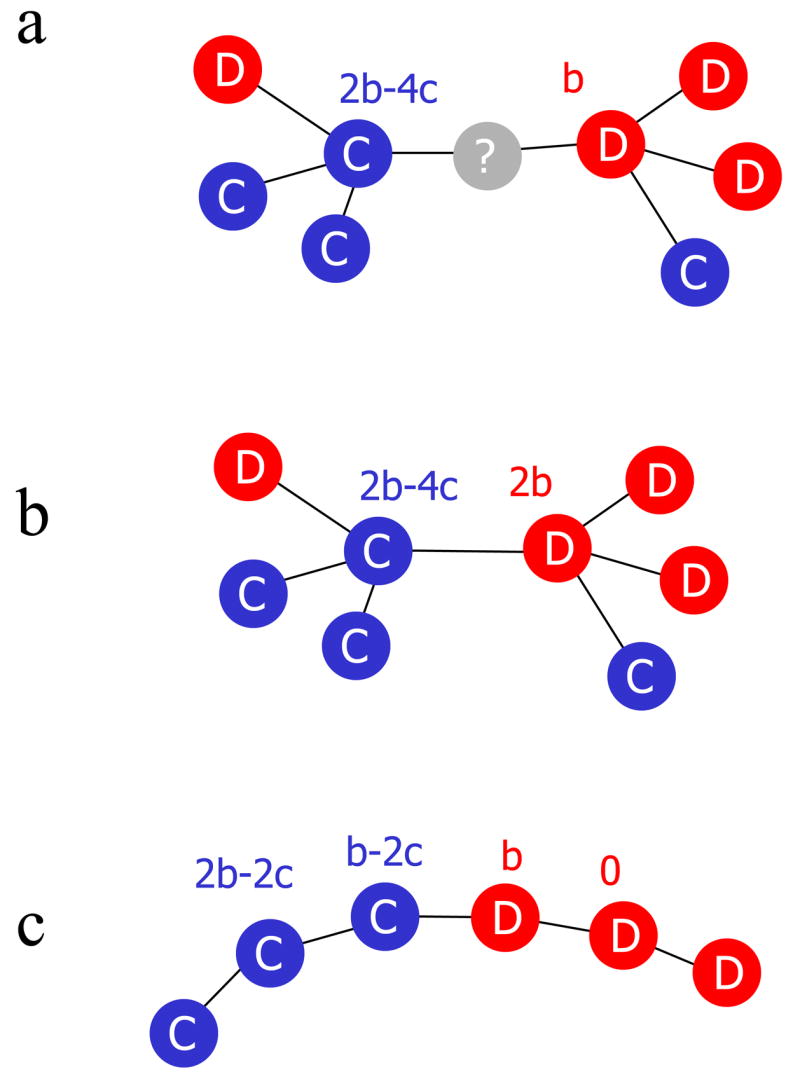
Some intuition for games on graphs. (a) For ‘death-birth’ (DB) updating, we must consider a cooperator and a defector competing for an empty site. The pair-approximation calculation shows that for weak selection the cooperator has one more cooperator among its k − 1 other neighbors than the defector. Hence, the cooperator has a higher chance to win the empty site if b/c > k. (b) For ‘birth-death’ (BD) updating, we must consider a cooperator-defector pair competing for the next reproduction event. Again the cooperator has one more cooperator among its k − 1 other neighbors than the defector, but the focal cooperator is also a neighbor of the defector. Hence, both competitors are linked to the same number of cooperators, and therefore the defector has a higher payoff. For BD updating, selection does not favor cooperation. (c) On a cycle (k = 2), the situation is simple. A direct calculation, for weak selection and large population size, leads to the following results. For BD updating, the boundary between a cluster of cooperators and defectors tends to move in favor of defectors. For DB updating, the cooperator cluster expands if b/c > 2. For IM updating, the cooperator cluster expands if b/c > 4.
We have also explored other update mechanisms. Suppose at each time step a random individual is chosen to update its strategy; it will stay with its own strategy or imitate one of the neighbors proportional to fitness. For this ‘imitation updating’, we find that cooperators are favored if b/c > k+2. This result can be obtained with an exact calculation for the cycle and with pair approximation for regular graphs. Again there is good agreement with numerical simulations (Fig 4 online). Mathematically, imitation updating can be obtained from our earlier death-birth updating by adding loops to every vertex. Therefore, each individual is also its own neighbor. Let us define the connectivity, k, of a vertex as the total number of links connected to that vertex, noting that a loop is connected twice. Then the simple rule b/c > k holds both for the imitation and death-birth updating.
There are also update rules, where selection can never favor cooperators. For example, let us consider ‘birth-death’ updating: at each time step an individual is selected for reproduction proportional to fitness, and the offspring replaces a randomly chosen neighbor. In this case, selection always favors defectors, because only the payoff of individuals right at the boundary between cooperators and defectors matters, and there cooperators are always at a disadvantage (Fig 3b). In the two other models, the payoffs of individuals that are one place removed from the boundary also play a role, which gives cooperation a chance to live.
Using a different model, van Baalen & Rand11 have derived a condition for the initial invasion of cooperators. In their model, the vertices of a spatial lattice (or a graph) are either empty or occupied by cooperators or defectors. There are birth, death and migration events. Implicitly, they have shown that without migration a few cooperators can successfully invade a population of defectors if b/c > k2/(k−1). The difference between this result and ours is not surprising. The invasion condition of van Baalen & Rand examines whether rare cooperators are able to increase in abundance, while our fixation probability includes the whole evolutionary trajectory including the initial invasion and propagation of cooperators as well as the final extinction of defectors. For a comparison of invasion and fixation criteria see Wild & Taylor30. Interestingly, the update mechanism of van Baalen & Rand does not allow selection to favor the fixation of cooperators.
In summary, we have shown that evolutionary dynamics on graphs can favor cooperation over defection if the benefit to cost ratio, b/c, of the altruistic act exceeds the average connectivity, k. The fewer connections the easier it is for natural selection to promote cooperation. In our present analysis, all connections are equally strong. A next step will be to explore graphs with weighted edges. In social networks, people might have a substantial number of connections, but only very few of them are strong. Hence, the ‘effective’ average degree, k, of many relevant networks could be small, thereby making selection of cooperation on graphs a powerful option.
Our study is theoretically motivated, but has implications for empirical research. For example, one can envisage an experiment where people are asked to play a non-repeated Prisoner’s Dilemma within a given network. Certain network structures should promote cooperative behavior more than others. In particular, more cooperation should emerge if connectivity is low. Moreover, in certain animal species there exist complicated social networks. Observational studies could reveal how network structure affects the level of cooperation; higher connectivity should reduce cooperation. In this paper, as a logical first step, we have studied the simplest possible interaction between unconditional cooperators and defectors, but in an extended approach, both in terms of theory and experiment, it will be interesting to see which strategies of direct or indirect reciprocity evolve on particular networks.
Finally, we note the beautiful similarity of our finding with Hamilton’s rule1, which states that kin selection can favor cooperation provided b/c > 1/r, where r is the coefficient of genetic relatedness between individuals. The similarity makes sense. In our framework, the average degree of a graph is an inverse measure of social relatedness (or social viscosity). The fewer friends I have the stronger my fate is bound to theirs.
Supplementary Material
Acknowledgments
Support from JSPS, NDSEG and Harvard-MIT HST is gratefully acknowledged. The Program for Evolutionary Dynamics at Harvard University is sponsored by Jeffrey Epstein.
Footnotes
Author Information The authors declare no competing financial interests.
References
- 1.Hamilton WD. The genetical evolution of social behaviour. J theor Biol. 1964;7:1–16. doi: 10.1016/0022-5193(64)90038-4. [DOI] [PubMed] [Google Scholar]
- 2.Trivers R. The evolution of reciprocal altruism. Q Rev Biol. 1971;46:35–57. [Google Scholar]
- 3.Axelrod R, Hamilton WD. The evolution of cooperation. Science. 1981;211:1390–1396. doi: 10.1126/science.7466396. [DOI] [PubMed] [Google Scholar]
- 4.Wilson EO. Sociobiology. Harvard Univ. Press; Cambridge, MA: 1975. [Google Scholar]
- 5.Wedekind C, Milinski M. Cooperation through image scoring in humans. Science. 2000;288:850–852. doi: 10.1126/science.288.5467.850. [DOI] [PubMed] [Google Scholar]
- 6.Fehr E, Fischbacher U. The nature of human altruism. Nature. 2003;425:785–791. doi: 10.1038/nature02043. [DOI] [PubMed] [Google Scholar]
- 7.Nowak MA, Sigmund K. Evolution of indirect reciprocity. Nature. 2005;437:1291–1298. doi: 10.1038/nature04131. [DOI] [PubMed] [Google Scholar]
- 8.Nowak MA, May RM. Evolutionary games and spatial chaos. Nature. 1992;359:826–829. [Google Scholar]
- 9.Killingback T, Doebeli M. Spatial evolutionary game theory: Hawks and Doves revisited. Proc R Soc London B. 1996;263:1135–1144. [Google Scholar]
- 10.Nakamaru M, Matsuda H, Iwasa Y. The evolution of cooperation in a lattice-structured population. J theor Biol. 1997;184:65–81. doi: 10.1006/jtbi.1996.0243. [DOI] [PubMed] [Google Scholar]
- 11.van Baalen M, Rand DA. The unit of selection in viscous populations and the evolution of altruism. J theor Biol. 1998;193:631–648. doi: 10.1006/jtbi.1998.0730. [DOI] [PubMed] [Google Scholar]
- 12.Mitteldorf J, Wilson DS. Population viscosity and the evolution of altruism. J theor Biol. 2000;204:481–496. doi: 10.1006/jtbi.2000.2007. [DOI] [PubMed] [Google Scholar]
- 13.Hauert C, De Monte S, Hofbauer J, Sigmund K. Volunteering as red queen mechanism for cooperation in public goods games. Science. 2002;296:1129–1132. doi: 10.1126/science.1070582. [DOI] [PubMed] [Google Scholar]
- 14.Le Galliard J, Ferriere R, Dieckman U. The adaptive dynamics of altruism in spatially heterogeneous populations. Evolution. 2003;57:1–17. doi: 10.1111/j.0014-3820.2003.tb00211.x. [DOI] [PubMed] [Google Scholar]
- 15.Hauert C, Doebeli M. Spatial structure often inhibits the evolution of cooperation in the snowdrift game. Nature. 2004;428:643–646. doi: 10.1038/nature02360. [DOI] [PubMed] [Google Scholar]
- 16.Ifti M, Killingback T, Doebeli M. Effects of neighbourhood size and connectivity on the spatial continuous prisoner’s dilemma. J theor Biol. 2004;231:97–106. doi: 10.1016/j.jtbi.2004.06.003. [DOI] [PubMed] [Google Scholar]
- 17.Santos FC, Pacheco JM. Scale-free networks provide a unifying framework for the emergence of cooperation. Phys Rev Lett. 2005;95:098104. doi: 10.1103/PhysRevLett.95.098104. [DOI] [PubMed] [Google Scholar]
- 18.Levin SA, Paine RT. Disturbance, patch formation, and community structure. P Natl Acad Sci USA. 1974;71:2744–2747. doi: 10.1073/pnas.71.7.2744. [DOI] [PMC free article] [PubMed] [Google Scholar]
- 19.Durrett R, Levin SA. The importance of being discrete (and spatial) Theor Popul Biol. 1994;46:363–394. [Google Scholar]
- 20.Hassell MP, Comins HN, May RM. Species coexistence and self-organizing spatial dynamics. Nature. 1994;370:290–292. [Google Scholar]
- 21.Skyrms B, Pemantle R. A dynamic model of social network formation. P Natl Acad Sci USA. 2000;97:9340–9346. doi: 10.1073/pnas.97.16.9340. [DOI] [PMC free article] [PubMed] [Google Scholar]
- 22.Abramson G, Kuperman M. Social games in a social network. Phys Rev E. 2001;63:030901. doi: 10.1103/PhysRevE.63.030901. [DOI] [PubMed] [Google Scholar]
- 23.Szabó G, Vukov J. Cooperation for volunteering and partially random partnership. Phys Rev E. 2004;69:036107. doi: 10.1103/PhysRevE.69.036107. [DOI] [PubMed] [Google Scholar]
- 24.Lieberman E, Hauert C, Nowak MA. Evolutionary dynamics on graphs. Nature. 2005;433:312–316. doi: 10.1038/nature03204. [DOI] [PubMed] [Google Scholar]
- 25.Watts DJ, Strogatz SH. Collective dynamics of ‘small-world’ networks. Nature. 1998;393:440–442. doi: 10.1038/30918. [DOI] [PubMed] [Google Scholar]
- 26.Barabasi A, Albert R. Emergence of scaling in random networks. Science. 1999;286:509–512. doi: 10.1126/science.286.5439.509. [DOI] [PubMed] [Google Scholar]
- 27.Taylor PD, Jonker L. Evolutionary stable strategies and game dynamics. Math Biosci. 1978;40:145–156. [Google Scholar]
- 28.Hofbauer J, Sigmund K. Evolutionary Games and Population Dynamics. Cambridge Univ. Press; Cambridge, UK: 1998. [Google Scholar]
- 29.Nowak MA, Sasaki A, Taylor C, Fudenberg D. Emergence of cooperation and evolutionary stability in finite populations. Nature. 2004;428:646–650. doi: 10.1038/nature02414. [DOI] [PubMed] [Google Scholar]
- 30.Wild G, Taylor PD. Fitness and evolutionary stability in game theoretic models of finite populations. Proc R Soc Lond B. 2004;271:2345–2349. doi: 10.1098/rspb.2004.2862. [DOI] [PMC free article] [PubMed] [Google Scholar]
Associated Data
This section collects any data citations, data availability statements, or supplementary materials included in this article.