

Abstract
Background
Color vision requires comparison between photoreceptors that are sensitive to different wavelengths of light. In Drosophila, this is achieved by the inner photoreceptors (R7 and R8) that contain different rhodopsins. Two types of comparisons can occur in fly color vision: between the R7 (UV-sensitive) and R8 (blue or green-sensitive) photoreceptor cells within one ommatidium (unit eye); or between different ommatidia that contain spectrally distinct inner photoreceptors. Photoreceptors project to the optic lobes: R1-6, which are involved in motion detection, project to the lamina, while R7 and R8 reach deeper in the medulla. This paper analyzes the neural network underlying color vision in the medulla.
Results
We reconstruct the neural network in the medulla, focusing on neurons likely to be involved in processing color vision. We identify the full complement of neurons in the medulla, including second order neurons that contact both R7 and R8 from a single ommatidium, or contact R7 and/or R8 from different ommatidia. We also examine third order neurons and local neurons that likely modulate information from second order neurons. Finally, we present highly specific tools that will allow us to functionally manipulate the network and test both activity and behavior.
Conclusions
This precise characterization of the medulla circuitry will allow us to understand how color vision is processed in the optic lobe of Drosophila, providing a paradigm for more complex systems in vertebrates.
Introduction
During evolution, eyes have been optimized to process maximum amounts of information by perceiving different parameters of the visual world and responding to them. The eyes can perform several major functions, from simple detection of light for circadian clock entrainment to formation of images. The eyes can also achieve other visual functions where the quality of the light input such as color, or the vector of polarized light (for navigation purposes) is also considered. The image of the environment formed by the optics of the eye on the retina is then transferred to brain processing centers. Both retina and brain processing centers have specialized morphology and function to achieve their various tasks (for review: [2]).
The Drosophila compound eye is composed of ∼800 ommatidia, each containing eight photoreceptor cells named R1 to R8 (for review: [3]). In each ommatidium, the six ‘outer photoreceptors’ (R1-R6) contain the wide spectrum Rhodopsin Rh1, which allows them to absorb light efficiently for their specialized function in motion detection (for review: [4]).
Tests based on associative learning strategies have demonstrated color vision in Drosophila (most recently: [5]). The R7 and R8 ‘inner photoreceptors’ function as sensory receptors for this color vision system [6,7]. They contain different types of Rhodopsin (Rh3-Rh6). Based on the Rh content of their inner photoreceptors, two main classes of ommatidia can be distinguished that are distributed stochastically in the main part of the retina [8,9], resulting in the formation of a mosaic of photoreceptors with different wavelength absorption (for review: [10]). Ommatidia exhibit unique fluorescence of their inner photoreceptors that appear either yellow (y) (70% of ommatidia) or pale (p) (the remaining 30%). The p-ommatidia contain UV-Rh3 in R7 and blue-Rh5 in R8, while y-ommatidia contain UV-sensitive Rh4 in R7 and green-sensitive Rh6 in R8. These two subtypes of ommatidia presumably allow discrimination of a broad range of wavelengths, with the p-ommatidia involved in the discrimination among short wavelengths while y-ommatidia must be involved in discriminating among longer wavelengths.
The adult Drosophila optic lobe has approximately 60,000 cells and can be divided in four neuropiles (for review: [11]): lamina, medulla, lobula and lobula plate (Figure 1A). The medulla represents the largest structure in the optic lobe with an estimated 40,000 neurons [12] whose cell bodies are located either in the medulla cortex, the region between the lamina and the medulla neuropil (arrows in Figure 1A), or the medulla rim, the region between the medulla and the lobula plate (arrowheads in Figure 1A). The medulla neuropil is stratified in 10 layers (M1-M10) orthogonal to the orientation of photoreceptor projections [13]. They can be divided in two larger domains: M1-M6 are where R7 and R8 send their projections (Figure 1B) while M7-M10 are lower medulla layers that are devoid of photoreceptors projections (brackets in Figure 1B).
Figure 1. Transcription Factor Expression Patterns in the Medulla.

(A) Adult optic lobe showing neurons (Elav, blue) in the medulla (Me) cortex (arrows) and medulla rim (arrowheads), lobula (Lo) and lobula plate (LP). (B) High magnification of medulla layers. Brackets show lower medulla layers (M7-M10). (C) Expression pattern of ey-Gal4 driving UAS-CD8::GFP (green). Brackets show lower medulla layers and arrows axonal projections to the lobula. (D) Expression pattern of ap-Gal4. Arrowheads point to L4 neurons and arrows to axonal projections to the lobula. Brackets show medulla layers. (E) Expression pattern of dll-Gal4. (F) Expression pattern of c699-Gal4. Brackets in (E) and (F) show ramifications in the lamina. (G) Non-overlapping expression of ey-Gal4 driving UAS-nuGFP (green), Distal-less antibody (red) and ap-lacZ (blue) in medulla neurons. Inset shows high magnification of medulla cortex. (H) Expression of ey-,dll-,c699-Gal4 driving UAS-nuGFP (green) and ap-lacZ (red) in medulla neurons (blue). Photoreceptor projections visualized with glass-lacZ (green) in (A-B), monoclonal antibody 24B10 (blue) in (C-F) and neuropil stained with DN-Cadherin (red) in (A-F). Scale bar: 50μm (A,C-H) or 15μm (B).
Thus, the medulla is the first step in the color vision pathway since it receives direct input from R8 to the M3 layer and R7 to the M6 layer [11]. It is however the second step in the motion detection pathway from R1-6 via input of lamina monopolar neurons to the medulla [14]. Therefore, the medulla likely couples the motion detection and color vision pathways.
Corresponding to each set of R7/R8 projections, there are ∼800 ‘columns’, defined as fixed cassettes of cells that repetitively contact every R7-R8 fascicule. Columns likely represent the functional units in the medulla with ‘columnar neurons’ contacting photoreceptors from only one ommatidium. ‘Non-columnar neurons’ presumably integrate information coming from broader receptor fields. Fischbach, Cajal, Strausfeld and colleagues extensively described and categorized medulla cells in Drosophila, Calliphora and Musca, respectively [13,15,16]. In these investigations, Golgi impregnation was used to reconstruct the morphology of optic lobe cells. Although immensely useful, this technique has limitations due its inability to identify landmarks (e.g. photoreceptors). This makes it difficult to correlate the position and contacts of different cells, with the photoreceptors which provide the input to the system or among medulla neurons, and to define their polarity.
Using the MARCM technique [17] and a series of enhancer traps-Gal4 lines reporting the expression of several transcription factors (TFs), and by generating a collection of piggyBac Gal4 enhancer trap lines specific for many of the individual cell types, we have been able to reconstruct the morphology of most individual medulla neurons (Table 1). Based on morphology, probable connection patterns and neuronal polarity, we focus on five broad classes of neurons: columnar and non-columnar projection neurons that reach the lobula and the lobula plate; local columnar and non-columnar local neurons with ramifications limited to the medulla; and feedback neurons that project back to the lamina. Although many of these neuronal classes had previously been identified [13], our precise characterization and the identification of new classes allow us to construct a possible neural circuitry that could be the basis for color vision in Drosophila.
Table 1. Medulla Cell Types.
Neuronal cell types identified in the Drosophila medulla. Cell types are organized according to: i) their expression of a TF-Gal4 (ap-, ey- and dll-Gal4 lines), ii) Columnar (C) vs. non-columnar (NC) cells and iii) presence of one dendritic arbor contacting R7 or R8 (R7/8), two arbors (R7 & R8) or ramifications in the lower medulla layers (LM). Numbers between parentheses represent the number of cells examined for each cell type. P&Y: pale and yellow ommatidia; OT: optic tubercle and Lo: lobula. New cell types are shown in red. Cell for which we describe a specific Gal4 enhancer trap line are noted in blue.

|
Results
Transcription Factors Expressed in Medulla Neurons
In order to obtain a complete description of medulla neurons, we identified broad molecular markers for all neurons in this structure. Extensive work on the development of the mammalian retina has led to the identification of a network of TFs expressed and required in specific retinal cell types [18]. The fly and vertebrate eyes use similar developmental pathways that were presumably involved in the formation of photoreceptors in their common ancestor [19]. Therefore, we looked at the expression pattern in the medulla of the fly orthologs of these TFs using enhancer trap Gal4 driver lines crossed with a membrane-bound UAS-CD8::GFP reporter (Figure 1C-E).
An enhancer trap in the eyeless gene (eyOK107-Gal4) [20], the Pax-6 ‘eye master control gene’ [21], drives reporter gene expression in ∼30% of medulla cortex neurons (Figure 1C) (Table 1).
Two enhancer trap lines in apterous (apmd544-Gal4[22] and ap-lacZ [23]), which encodes a LIM-homeoprotein homologous to mammalian Lhx2, are expressed in L4 lamina cells (arrowheads in Figure 1D) and in ∼40% of cells in the medulla cortex (Figure 1D) (Table 1). Both ey-Gal4 and ap-Gal4 are expressed in medulla ‘projection neurons’ that reach to deeper optic lobe neuropils (arrows in Figure 1C-D), but they appear to mark different subsets of neurons whose ramifications occupy distinct domains in the medulla: ey-Gal4 preferentially marks cells that contact lower medulla layers (brackets in Figure 1C), while processes of ap-Gal4 cells are present throughout the entire medulla (brackets in Figure 1D).
An enhancer trap in distal-less, dllmd23-Gal4 [22], shows expression in ∼20% of medulla cortex cells and in medulla rim cells (Figure 1E) (Table 1). These cells appear to be medulla local neurons, while a sub-population sends ramifications back to the lamina (brackets in Figure 1E).
Finally, c699-Gal4 [24] is expressed in only one medulla cell type, identified as T1 cells [13], representing ∼5% of medulla cells (Figure 1F). This cell type does not express any of the other three transcription factors (Table 1).
As these Gal4 lines are expressed in several subtypes of medulla neurons, we analyzed whether they are co-expressed in the same cells. None of these TF markers overlap (ey>GFP, ap-lacZ and anti-Dll [25]), both during larval development (J.M and C.D., submitted) and adulthood (Figure 1G and inset). Furthermore, flies carrying a combination of three Gal4 lines (c699-, dll- and ey-Gal4) driving nuclear GFP as well as ap-lacZ mark over 95% of medulla neurons (Figure 1H). The remaining classes seem to be labeled by 192a-, 782c-, 2402a-, and 1118-Gal4 lines expressed in very restricted groups of medulla cells (see below and ‘other cell types’ in Table 1). Therefore, these markers are not only expressed in mutually exclusive subsets of neurons but, more importantly, they mark the large majority of medulla neurons.
Visualizing Neuronal Subtypes in the Medulla
Visual inputs flow from the retina to the lamina or to the medulla before reaching downstream targets in the lobula complex. Therefore, the medulla presumably represents an intermediate structure where projection neurons carry visual information towards deeper regions of the optic lobe.
Precise anatomical studies using Golgi impregnation in Drosophila have identified two broad classes of neurons in the medulla [13]: (i) Projection neurons connecting the medulla with either only the lobula (transmedullary neurons, Tm), or with both lobula and lobula plate (TmY neurons, which have branched axons), or projecting back to the lamina. These projection neurons constitute the main output pathway from the medulla and are considered as the equivalent of the mammalian retinal ganglion cells [15]. (ii) Local interneurons with ramifications limited to the medulla.
In order to reconstruct the neural network in the medulla, we generated MARCM GFP-clones [17] of projection and local neurons using the Gal4 lines described above (Figure 1) and UAS-CD8::GFP that decorates both axonal and dendritic ramifications. Examination through confocal microscopy of more than 10,000 adult brains has allowed us to reconstruct the morphology and pattern of projections of 2,000 single-cell clones in frontal sections, re-identifying those neurons previously described [13] and expanding to a large set of new neurons. In order to have precise morphological landmarks, we labeled all R7 and R8 projections with a monoclonal antibody against Chaoptin (24B10) [26] and the optic lobe neuropil with DN-Cadherin [27]. We were then able to reconstruct cell arborizations and precise morphology for each neuron type present in the medulla (Table 1).
We describe below a selected number of representative examples of the types of neurons that we identified. We use the nomenclature from Fischbach and Dittrich [13] for known cell types and we adjust it to name newly identified cells by considering the medulla layers where major ramifications are displayed (Table 1).
Vertical Integration: R7 and R8 Integration
In mammals, color vision requires the comparison between cones expressing different opsins in order to distinguish between wavelength and intensity contrasts (for review: [28]). The organization of the fly retina, with UV-sensitive R7 located on top of green or blue sensitive R8, allows both inner photoreceptors within one ommatidium to look at the same point in space. We find a broad class of columnar Tm cells (Table 1) with ramifications in both R7 and R8 layers (Figure 2A-B) which might be able to compare the output of R7 and R8 photoreceptors, such as in a color opponent system (vertical integration). The previously unidentified Tm cells that we name Tm3-6 (Figure 2A) are representative of this class. They have ramifications in the M3 and M6 layers (arrowheads in Figure 2B) and also present ramifications in lower medulla layer domains (M7-M10) (arrows in Figure 2A), which appears to be a common feature of almost all medulla neurons.
Figure 2. Projection Neurons in the Medulla.

MARCM single-cell clones in projection neurons with ap- (A,C,G) or ey-Gal4 (E,I). (A) Tm3-6 cell. Arrow points to ramifications in M7-M9 layers and arrowhead to axonal projection to the lobula. (B) Close-up of Tm3-6 ramifications in photoreceptor layers. (C) Tm2 cell. Arrow points to ramifications in M9 layer and arrowhead to axonal projection to the lobula. (D) Close-up of Tm2 ramifications. Arrowheads points to lateral ramifications and arrow to axonal projection bypassing R7. (E) Non- columnar Tm8 cell. (F) Close-up of Tm8 ramifications. Arrow points to ramifications in M8 layer. (G) A non-columnar TmY2 cell. (H) Close-up of TmY2 ramifications. Arrow points to ramifications in M7 layer. (I) TmP&Y R7 cell. (J) Close-up of TmP&Y R7 ramifications. Arrow points to ramifications in M7 layer. Photoreceptors are visualized with 24B10 (blue). P: pale, Y: yellow. Scale bar: 30μm (A,C,E,G), 15μm (B,D,F,H,J) or 60μm (I).
We find a second subclass of columnar neurons that present ramifications in a single photoreceptor terminal layer (Figures 2C-D)(Table 1). For instance, Tm2 cells (Figure 2C) exhibit extensive contacts in the M2-M4 layers (Figure 2D), with two lateral ramifications surrounding R8 terminations (arrowheads in Figure 2D). They bypass R7 termini (M6 layer) (arrow in Figure 2D) when projecting deeper toward the lobula. They also send a second set of small ramifications in the M9 lower medulla layer (arrow in Figure 2C). Tm2 cells express ort (C.-H. Lee, personal communication), the gene that encodes the receptor for histamine, the neurotransmitter of photoreceptors and therefore presumably receive inputs from either R8 or R7. The ramifications displayed by this subclass in M1-M5 [13] correspond to layers where lamina neurons also project, arguing that these neurons might be involved in integration with motion detection before the information is sent to downstream lobula targets.
Horizontal Integration: Pale and Yellow Ommatidia
The single lens camera-like mammalian eye forms images on the retina, where rods and cones are displayed in a two dimensional continuous layer: comparison for color vision occurs between neighboring cones. Instead, in Drosophila, each pixel corresponds to an ommatidium that has a dedicated lens, and the color of the pixel could be inferred from comparisons in columnar neurons that contact R7 and R8 from one ommatidium. However, we also find a family of non-columnar projection neurons (with more than 20 types) that project to the termini of R7/R8 belonging to several neighboring ommatidia (as in vertebrates). These neurons present arborizations with different complexity in several photoreceptor layers and in their axonal projections to the lobula complex. They might perform ‘horizontal’ comparison between pale and yellow ommatidia (Figures 2E-J).
The first subclass includes cells that contact both R7 and R8 in several columns. These cells present at least 11 different variations based on dendritic arbor morphology in photoreceptor layers (Table 1). They penetrate the medulla along a specific R7/R8 column, and then expand ramifications in photoreceptor layers covering from 2 to 10 columns, both in the R8 and R7 layers. Like other projection neurons, they also contact lower medulla layers M7-M9 (arrow in Figure 2F). Figures 2E-F shows one such neuron that resembles Tm8 [13]. Different sub-classes differ whether their axons project only to the lobula (e.g. Tm8)(Figure 2E) or also to the lobula plate (Table 1).
The second subclass with at least 9 different variations contains neurons with only one tuft of lateral ramifications that contact either several R7 or several R8 photoreceptors (Figures 2G-J). For instance, TmY2 [13] only arborize in the R8 layer (Figures 2G-H). A previously unidentified cell type, which we name TmP&Y R7, arborizes only in the R7 layer (Figures 2I-J). Both subtypes have ramifications in M7/M8 lower medulla layers (arrows in Figures 2H,J).
Local Circuit Neurons
Visual processing must involve interneurons, or ‘local circuit neurons’, which might shape the outputs generated by projection neurons. We identify two broad classes of columnar and non-columnar local neurons, which extend distinct ramifications exclusively in the medulla (Table 1).
The first class of local neurons are columnar Medulla intrinsic (Mi) cells [13] (Table 1). Like columnar projection neurons, these local neurons have branches at two different levels in the photoreceptor layers (Figures 3A-B), or exhibit arborizations branching out in one main tuft (Figure 4C). It is noteworthy that the ramifications of local neurons often resemble and coincide with those of corresponding projection neurons, arguing for functional relationship between them. For instance, columnar local Mi1 and projection TmY5a neurons have similar ramifications in M1, M3 (R8) and M5 layers (Figures 3A-D).
Figure 3. Microcircuits in the Medulla.

MARCM single-cell clones (green) in local and projection neurons using ap-(A,G) or ey-Gal4 (C,E). The comparison between left and right panels highlights the similarity of projection patterns between local and projection neurons that suggests the existence of microcircuits. (A) Mi1 cell. Arrow points to ramifications in M10 layer. (B) Close-up of Mi1. Arrow points to ramification in M3. (C) TmY5a cell. Arrow points to ramifications in lower medulla layers and arrowheads to axonal projections to lobula and lobula plate. (D) Close-up of TmY5a ramifications in M3 and M6 layers (arrowheads). (E-F) Dm1-5 cell. (G) TmY8 cell. Arrowheads point projections to lobula and lobula plate. (H) Close-up of TmY8 ramifications. Photoreceptors are visualized with 24B10 antibody (blue). Scale bar: 15μm (A,B,D,E,F,H) or 40μm (C,G).
Figure 4. Axons in Projection and Local Neurons.

Expression of axonal marker UAS-tau-lacZ (red) in ey- (A,F) and ap-Gal4 (C,D) MARCM single-cell clones (green) in projection and local neurons. Axons in TmY5a (A) and Tm7 (D) projection neurons. Inset in (D) shows tau-LacZ staining in axonal projection of Tm7 cell. Close-up of TmY5a (B) and Tm7 (E) ramifications in photoreceptor layers. Axons in Mi9 (C) and Dm1-5 (F) local neurons. Axons are visualized with β-Gal (red) and photoreceptors with 24B10 (blue). Scale bar: 30μm (A,D) or 15μm (B,C,E,F).
We also find two subclasses of non-columnar local neurons. Distal medulla (Dm) neurons [13] have ramification in photoreceptor layers while Proximal medulla neurons (Pm, described below) [13] extend arbors in lower medulla domain. We find Dm cells whose morphology closely matches that of almost every class of non-columnar projection neurons described above (Table 1). For instance, a previously unidentified non-columnar local neuron that we name Dm1-5 and projection neuron TmY8 share ramifications in M1, M4 and M5 layers (Figures 3E-H). Their only difference is that TmY8 projects to the lobula complex while Dm1-5 remains local.
Axons in Projection and Local Neurons
The presence of matching pairs of local and projection neurons suggested functional relationship between them. We thus analyzed the pre- and postsynaptic nature of terminations in those classes of neurons. First, we used single cell MARCM clones to co-express UAS-CD8::GFP along with a reporter of a different color that marks axons (Tau::lacZ) [29] (Figure 4).
In columnar Tm cells, Tau::lacZ, accumulates in lobula and lobula plate projections (e.g. TmY5a, arrowheads in Figure 4A) and faintly in lower medulla layers, but not in lateral ramifications in photoreceptor layers, which are thus likely dendrites (arrows in Figure 4B). In contrast, MARCM analysis of local neurons such as Mi9 shows Tau::lacZ clearly enriched in lower medulla arborizations and in photoreceptor layers, although some fine ramifications are also Tau-negative in photoreceptor layers (Figure 4C), arguing for the presence of both pre- and postsynaptic contacts in photoreceptor layers.
We then analyzed the pre- and postsynaptic nature of terminations in non-columnar projection and local neurons. Similar to columnar projections neurons, non-columnar cells such as Tm7 accumulate Tau::lacZ in the main axis (Figure 4D and inset), but not in lateral ramifications in photoreceptor layers (Figure 4E). In contrast, equivalent non-columnar local neurons such as Dm1-5 do not show a clear separation of axon and dendrites as shown by extensive enrichment of Tau::lacZ in their medulla ramifications, especially in the M1 layer (Figure 4F).
Therefore, Tm projections neurons appear to collect visual information from photoreceptors and send it to the lobula complex. Local neurons are both pre- and postsynaptic in photoreceptor and lower medulla layers where they likely modulate the information carried by projection Tm cells.
Pre- and Post-synaptic Sites in Medulla Cells
To confirm results described above, we used specific lines to mark unique cell populations in the medulla. We screened available Gal4 lines and a collection of piggyBac Gal4 lines generated in our lab and in the lab of T. Tabata (Figures S1 and S3). Available lines are indicated in Table 1 and will be described in detail elsewhere (A. Celik, J.M, T. Tabata and C.D., in preparation). We co-expressed UAS-CD8::GFP along with a reporter of a different color that marks presynaptic sites (Synaptotagmin::HA) [30] (Figure 5). We also used UAS-DsRed together with a dendritic compartment marker (Dscam 17.1::GFP) [31] (Figure 5).
Figure 5. Dendrites and Presynaptic Sites in Projection and Local Neurons.

Markers driven by specific Gal4 enhancer trap lines indicate the polarity of neurons in the medulla. Co-expression of dendritic UAS-Dscam 17.1 GFP (red) and UAS-AUG::DsRed (green) in (A-B,E-F,I-J), or presynaptic marker UAS-Syt-HA (red) and UAS-CD8:GFP (green) in (C-D,G-H,K-L) in Tm12. (A-D) projection neurons, and Dm6 (E-H) and Pm1 (I-L) local neurons. Close-up of Tm12 (B,D), Dm6 (F,H), and Pm1 (J,L) ramifications (brackets). Arrows in (A,C) point to Syt-positive (C) axonal projections to the lobula and negative for Dscam 17.1 (A). Arrows in (B) point to postsynaptic sites and in (D) to presynaptic sites in lower medulla layers. Photoreceptors visualized with 24B10 (blue). Scale bar: 50μm (A,C,E,G,I,K) or 20μm (B,D,F,H,J,L).
In non-columnar Tm12 cells (Table 1), marked with the 2135a-Gal4 line (Figures S1A-B), Dscam 17.1 is expressed in ramifications in photoreceptor layers (brackets in Figure 5B) and lower medulla layers (arrows in Figure 5B) but it is absent from axonal projections to the lobula (arrows in Figure 5A). This confirms that these are dendrites and this pattern is largely complementary to that of Tau::lacZ. Presynaptic sites labeled with Synaptotagmin::HA (Syt) are localized in lobula projections (arrows in Figure 5C). Interestingly, they are also found in a few ramifications in lower medulla layers, although most ramifications there are marked with Dscam 17.1::GFP (arrows in Figures 5B).
For local neurons, we used the specific 782c-Gal4 line (Figures S1C-D) that drives expression in non-columnar Dm6 cells. These cells exhibit arborizations in M1 layer. Specific expression of Dscam 17.1 (Figure 5E) and Syt (Figure 5G) reveals enrichment of presynaptic sites (brackets in Figure 5H) in the arborizations that contact the M1 layer.
Third Order Neurons: Role of Lower Medulla Layers
Projection neurons described above, whether columnar or not, appear to contact photoreceptors and likely represent a first level of color integration. All of these Tm neurons also have presynaptic sites (Figure 5) in lower medulla layers (M7-M10), beyond photoreceptor layers, where a higher level of integration might take place. Interestingly, although we do not find columnar projection neurons that bypass photoreceptor layers, we find two subclasses of non-columnar projection neurons that do not contact photoreceptors, and appear to act as third-order neurons in the medulla network.
A class of previously unidentified Tm cells, which we name TmLM7 (Figures 6A-B), arborize extensively in the M7 layer (Figure 6B), where they appear to be postsynaptic (see below), before projecting to the lobula.
Figure 6. Third Order Neurons: Role of Lower Medulla Layers.
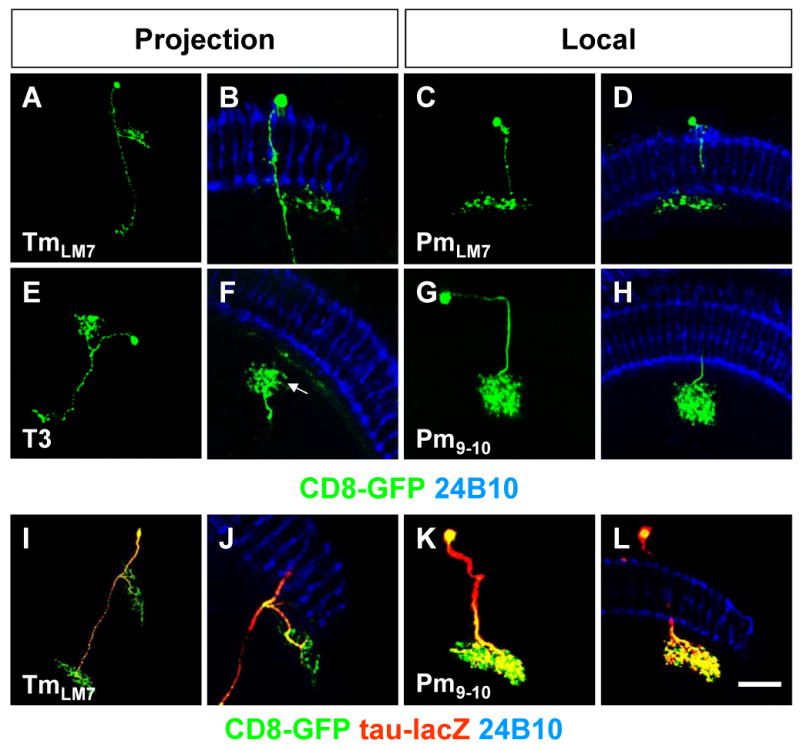
MARCM single-cell clones (green) using ey- (A,C,G,I,K) or ap-Gal4 (E) in projection (A,E,I) and local (C,G,K) neurons. (A) TmLM7 cell. (B) Close-up of TmLM7 ramifications. (C) PmLM7 cell. (D) Close-up of PmLM7 ramifications. (E) T3 cell. (F) Close-up of T3 cell ramifications. (G) Pm9-10 cell. (H) Close-up of Pm9-10 ramifications.
Co-expression of axonal marker UAS-tau-lacZ (red) in ey-Gal4 (I,K) MARCM-GFP single-cell clones (green) in projection (I) and local neurons (K). (I) Axons in TmLM7 neurons. (J) Close-up of TmLM7 ramifications. (K-L) Axons in Pm9-10 neurons. Axons visualized with β-Gal (red) and photoreceptors with 24B10 (blue). Scale bar: 30μm (A,E,I) or 15μm (B,C,D,F,G,H,J, K,L).
A second class includes T3 cells, whose cell bodies are in the medulla rim [13] (Figure 6E). They have axons that split in two branches, one reaching the deepest medulla layers (M9/10) (arrow in Figure 6F), covering between 2 and 4 columns, while the axonal branch reaches the lobula.
We also find several types of non-columnar local neurons (Table 1), known as Proximal medulla (Pm) neurons [13], which skip photoreceptor layers and only contact lower medulla layers. PmLM7 exhibit ramifications mainly in the M7 layer (Figures 6C-D) while Pm9-10, whose cell bodies are in the medulla cortex (Figures 6G-H) project to the M9-10 layers. Interestingly, PmLM7 and TmLM7 cells have similar ramifications in the same layers (compare Figures 6A-B with C-D) while Pm9-10 neurons have projections that are similar to T3 neurons (compare Figures 6E-F with G-H), further emphasizing the parallel between projection and local neurons.
We then analyzed the pre- and postsynaptic nature of terminations in these third order neurons. In MARCM single cell clones marking TmLM7, Tau::lacZ is enriched in lobula projections and in some, but not all projections in the lower medulla domain, with the finest neurites being Tau negative, thus presumably dendrites (Figures 6I-J). Similarly, Tau::lacZ is clearly enriched in the lower medulla arborizations of Pm9-10 cells (Figures 6K-L) with some fine ramifications being negative. We expressed Dscam 17.1 and Syt using a Pm1 cell specific line, 2402a-Gal4 (Figures S1E-F)(Pm1 differ from PmLM7 because their cell bodies are in the medulla rim). Both dendrites (Figures 5I-J) and presynaptic sites (Figures 5K-L) can be observed in lower medulla layers, although presynaptic sites appear more abundant (brackets in Figure 5L).
Local neurons that do not contact photoreceptor layers likely perform further processing which is then contributed to higher brain centers through second or third order projection neurons. The postsynaptic nature of some of the lower medulla ramifications of third order neurons suggests that these cells collect visual information already processed by other medulla cells with input from photoreceptor layers (either Tm or local neurons) and thus represent a higher level of hierarchy in visual processing.
Projections to Lobula
In the human retina, retinal ganglion cells carry visual information to higher optic centers. Similarly, projection neurons send their axons to higher visual processing centers in the lobula complex. We analyzed the axonal projection patterns in the lobula of individual medulla Tm neurons. Although lobula layers are morphologically less well defined than in the medulla, it is possible to define regions where medulla neurons project (Figure 7).
Figure 7. Axonal Projections to the Lobula.
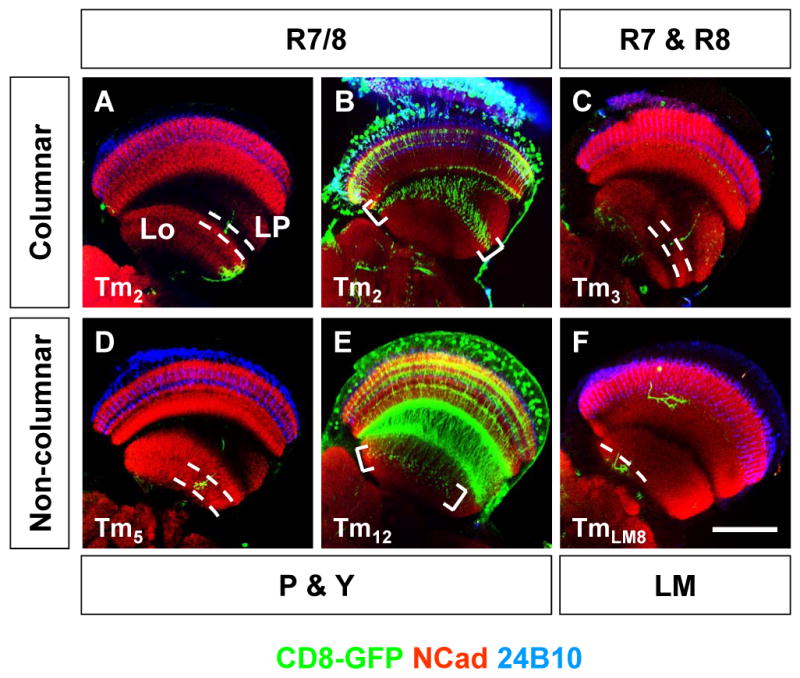
Axonal innervation (green) of Tm2 (A), Tm3 (C), Tm5 (D) and TmLM8 (F) MARCM single-cell clones to the lobula (between dashed lines). Expression pattern of otd-Gal4 (B) driving UAS-CD8::GFP (green) in Tm2 cells and photoreceptors, or 2135a-Gal4 in Tm12 cells (E). Brackets in (B,E) point to axonal projections in the lobula. Photoreceptors are visualized with 24B10 (blue) and neuropil with DN-Cadherin (red). Lo: lobula, LM: lower medulla, LP: lobula plate, P: pale, Y: yellow. Scale bar: 50μm.
Columnar Tm cells that contact only one photoreceptor layer (TmR7/8) (e.g. Tm1, Tm2 and Tm9) show very discrete axonal projections with small termini in the most superficial lobula layers (Figures 7A-B). We confirmed this result by looking at all axonal projections of Tm2 cells which are marked by an otd-Gal4 promoter fusion (T.Cook and C.D, unpublished data)(brackets in Figure 7B). However, columnar neurons contacting several photoreceptor layers (e.g. Tm3 cells, which contacts both M1 and M4 layers) project deeper, to an intermediate layer (Figure 7C).
Non-columnar Tm cells, whether or not they contact photoreceptor layers (Figure 2) also present more complex axonal termini in the lobula, with multiple branches in layers deeper than columnar neurons (Figures 7D-F). The depth of their projections in the lobula also directly correlates with the depth of their projection in the medulla. For instance, non-columnar Tm cells that contact several photoreceptors (e.g. Tm5)(Figure 7D) or Tm12 cells marked with the 2135a-Gal4 line (brackets in Figure 7E) project more superficially than those that do not contact photoreceptors, but have ramifications in the lower medulla (e.g. TmLM8), which project to the deepest layer in the lobula (Figure 7F).
Thus, lobula layers exhibit a hierarchy in the level of processing, with more superficial layers receiving signals with presumably lower level of processing while deeper layers are innervated by third order medulla neurons and non-columnar neurons. These data emphasize the spatial segregation of the different subtypes of projecting neurons to different lobula targets: visual information carried by columnar and non-columnar cells is processed in separate lobula layers, which might represent the hierarchy of processing.
Neurons Connecting Medulla and Lamina
The projection neurons described above are not the only output of medulla neurons. Indeed, other cells as T1, C3 and Lamina wide field (Lawf) neurons connect medulla and lamina [13]. These cell types show a high degree of conservation among insects [32], where they have been suggested to be part of a feedback circuit [13,33].
Using the dll-, c699- and 1118-Gal4 [34] enhancer trap lines, we generated single MARCM clones of C3 (Figures S2A-C), T1 (Figures S2D-F), and Lawf (Figures S2G-I) neurons, respectively. To analyze their polarity, we expressed Dscam 17.1 and Synaptotagmin with the 1675a-Gal4 enhancer line (Figures S3A-B), which is specific for C3 cells. We also expressed these markers with 1118-Gal4 (Figures S3C-D), which specifically marks Lawf neurons. C3 show dendritic ramifications in M1 and M5 layers (brackets in S4B), and Lawf neurons mainly in the M4 layer and faintly in the M1 layer (brackets in Figure S4F). However, Dscam 17.1 does not show staining in the lamina in either cell types (arrows in Figures S4B,F). C3 cells and Lawf cells show presynaptic sites (as shown with Syt-HA staining) in the lamina (arrows in Figures S4D,H). However, C3 cells show also some presynaptic sites in M1-2 layers (brackets in Figure S4D) while Lawf cells have significant presynaptic termini in M1 and some in M4 (brackets in Figure S4H). Thus, the flux of information in these connecting neurons confirms previous reports that C3 and Lawf cells are part of a feedback pathway from the medulla to the lamina [33]. The role of T1 cells remains unknown. They do not appears to have pre-synaptic sites in the lamina and likely serve as a relay for L2 lamina neurons [14].
Discussion
Analysis of the Visual System in Drosophila
The medulla represents the major neuropil in the optic lobe. Despite this complexity, using a series of TFs-Gal4 lines we have been able to dissect the medulla network at the single cell level. ap- and ey- Gal4 are expressed in non-overlapping populations, both in projection and local neurons. dll-Gal4 reveals expression almost exclusively in local neurons, although not all local neurons are marked by dll-Gal4 (Table 1). Through this extensive analysis we have been able to reconstruct morphologically 38 types of projection neurons, 22 types of local neurons and 3 connecting neurons (Table 1). Among these cell types, we found 6 new projection and 4 local neuron types not described before [13]. Most of these new cell types (e.g. TmLM7 and PmLM7) include cells with ramifications exclusively in the lower medulla domain.
We can thus define the elements represented in a ‘column’, the medulla functional units: i) 2 inputs from R7 and R8; ii) 5 ramifications from L1-5 lamina neurons; iii) 11 types of columnar and 20 of non-columnar projection neurons; iv) 4 types of columnar and 11 of non-columnar local neurons; and v) 2 types of columnar and 1 of non-columnar lamina connecting neurons. Additionally, 7 other non-columnar local and 7 projections neurons do not contact PRs. Overall, each R7/R8 termination pair is therefore surrounded by at least 54 different cell types, with 14 other cell types that do not contact PRs. The enormous number of cell types forming part of a column contrasts with the relatively small number of elements that feed into the medulla (R7-8 and R1-6 through L1-5 neurons). Thus, the divergence in the flow of information between PRs and medulla neurons argues that much local processing occurs in the medulla. In contrast, in the deeper optic lobe i.e lobula and lobula plate, the number of cells and their wide-field ramifications [13,35] argue for the convergence of information from medulla neurons.
Vertical vs. horizontal integration
Our analysis of the color vision network in the Drosophila medulla reveals the presence of two parallel routes carrying and processing visual information that coexist in the medulla neuropil: i) a point-to-point pathway formed by columnar neurons that only receive information from a single ommatidium (‘vertical integration’) (Figure S5A); ii) a pathway with a broader receptive field composed by non-columnar neurons that receive information from photoreceptors from several ommatidia (‘horizontal integration’) (Figure S5A).
The first pathway integrates outputs from R8 and R7, likely allowing broad wavelength discrimination between UV- and blue or green: cells comparing signals from p-ommatidia might mediate better discrimination among short wavelengths, while those comparing outputs of y-photoreceptors should better mediate discrimination among longer wavelengths. This suggests that there are two independent and non-overlapping retinotopic maps that separately process color information: one from p- and one from y-photoreceptors. These maps might be physically separated in higher brain centers but we do not observe specific p- or y-contacting neurons (J.M and C.D, unpublished observations), nor do we see distinct projections to different layers in the lobula complex (Figure 7B).
The second pathway reflects more complex visual processing, with non columnar Tm neurons cells integrating information from several R8 and R7 photoreceptors. Since the p- and y-ommatidia each compare output of photoreceptors with widely different absorption spectra (UV and green, or UV and blue), ‘horizontal integration’ between y- and p-ommatidia for both R7 and R8 might allow a much more precise evaluation of the colored world, although at a reduced spatial resolution. Additionally, we find cells that might directly compare p- and y-R8 cells (e.g. contacting blue and green R8, but not R7). Similarly, cells that compare p- and y-R7 photoreceptors might integrate information from the two different types of UV-photoreceptors. It should be noted that the difference in peak of absorption between Rh3 and Rh4 (∼20nm) in R7 is sufficient to allow precise discrimination of UV- wavelengths and is similar to the difference between M- and L- opsins in humans (30nm). Thus, this horizontal integration should allow the convergence of several inputs from multiple R7 and R8 photoreceptors to a single medulla cell.
Modulation by Local Neurons
It is not clear how comparison between photoreceptors is achieved, and whether local neurons expressing different neurotransmitters are involved to generate opposite outputs between R7 and R8 (for columnar neurons), or between p- and y-R7 or R8 (for non-columnar neurons). It is likely that R7 cells do sum up their output to support the strong UV-attraction that characterizes flies [36]. However, inner photoreceptors are not involved in scotopic vision (dim light) and an organization where neurons simply add their outputs makes little sense for what is known of the function and specialization of R7 and R8 cells in color vision. Therefore, it is likely that an opponent system exists in the medulla and that it is mediated by local neurons. Alternatively, color vision, might not need an opponent system but might result from non-linear interactions between R7 and R8. Their interaction with the same post-synaptic cell could be complex, e.g. Tm neurons might have synergistic responses to inputs from R7 and R8, or from photoreceptors from different ommatidia.
In the mammalian retina, horizontal and amacrine cells are interneurons that have a critical role in modulating retinal output [2]. Horizontal cells provide lateral interactions between photoreceptor terminals, creating a ‘center-surround organization’, enhancing the response of ganglion cells lying directly under the light stimulus and inhibiting their neighbors. Meanwhile, amacrine cells make inhibitory synapses on bipolar cells, thus controlling their output to ganglion cells, but also synapse onto ganglion cells and coordinate their firing. As in the mammalian retina, a great variety of neurons with local ramifications within the medulla might modulate the visual outputs carried by projection neurons. This modulation is accomplished by two kinds of local neurons:
Columnar local neurons with one Mi cell per ommatidium (Figure S5B). Interestingly, the arborizations of many of these columnar local neurons resemble those of corresponding Tm columnar projection neurons that contact either one photoreceptor, or both R7 and R8. They intermingle with them in photoreceptor layers as well as in lower medulla layers. In this microcircuit, Mi cells appear to interact both pre- and postsynaptically with Tm ramifications.
Dm cells are non-columnar local neurons that do contact photoreceptor layers while Pm cells only have projections in lower medulla layers. Both classes ramify extensively over several columns (Figure S5B). Interestingly, non-columnar local neurons appear to be pre- and postsynaptic both in photoreceptors layers and in lower medulla layers. This suggests that Dm local neurons perform a first level of integration with Tm cells at the level of photoreceptor layers, while this information is further processed by Pm cells that act at a second level in lower medulla layers.
Therefore, columnar and non-columnar projection neuron outputs could be modulated by columnar and non-columnar local neurons, respectively. In the Drosophila antennal lobe, two kinds of local neurons exist: inhibitory local interneurons [37,38] and a local excitatory population involved in processing projection neurons signals to downstream targets [39,40]. A similar system might also exist in the medulla.
Parallel Pathways in Visual Processing
Whether Tm projection neurons are columnar or non-columnar, they all arborize in lower medulla layers (M7-M10). For most Tm cells analyzed, these lower medulla ramifications appear to contain both presynaptic and postsynaptic terminations, suggesting that this region represents a second layer of integration in the color vision pathway after the direct comparison between R7 and R8 (or between y and p R7/R8).
A class of projection neurons, TmLM7 and TmLM8 only arborize in lower medulla layers where they mostly exhibit postsynaptic arborizations. This suggests that they play a role as third order neurons that collect more elaborate visual information already integrated by other Tm cells with ramifications in photoreceptor layers and presynaptic endings in lower medulla layers, and then carry this processed visual information to downstream targets.
Conclusions
Our observations have allowed us to reconstruct the organization of the visual circuit in Drosophila. Generating single cell clones allowed us to decipher many of the intricacies of this pathway and to propose general rules of color vision processing in the medulla and transmission to downstream targets in the deeper optic lobes. Additionally, we have identified Gal4 lines with very restricted expression pattern in neuronal subtypes in the medulla. Future electrophysiological and behavioral experiments using these and additional Gal4 lines will help reveal the exact function of these optic lobe cells in these complex circuits and to reach a better understanding of the mechanisms that govern the physiology of vision both in invertebrates and vertebrates.
Experimental Procedures
Fly Stocks and Clonal Analysis
The following lines were used for the study and they are expressed in patterns described in the text. These lines are available: 27b-Gal4, 192a-Gal4, 686a-Gal4, 782c-Gal4, 1118-Gal4, 1675a-Gal4, 2135a-Gal4, 2402a-Gal4. The entire piggyBac enhancer trap screen will be published elsewhere (A. Celik, J.M, T. Tabata and C.D.). The other lines, apmd544-Gal4, c699-Gal4, dllmd23-Gal4, eyOK107-Gal4, otd-Gal4, aprK568-lacZ, glass-lacZ, UAS-CD8-GFP, UAS-nuGFP, UAS-Dscam17.1-GFP, UAS-Syt-HA, UAS-tau-LacZ and UAS-DsRed are available in the Bloomington stock center or from authors referenced in the text.
MARCM clonal analysis [17] was carried out by heat-shocking larvae and early pupae for 2-5 minutes at 37°C at different time points at intervals of 4 hours, from 72h after egg laying until 20% pupation. Each cell type included in the study was visualized at least 3 times. Columnar cells have higher probabilities to be visualized than non-columnar neurons as they are present in higher numbers. Samples were imaged using a Leica TCS SP2 confocal using a 20X immersion lens. Cells were fully reconstructed after collecting stacks every 1-2μm. Single sections allowed us to visualize putative contacts with photoreceptors. Images were assembled using Photoshop (Adobe).
The following stocks were used:
For 1118-Gal4: ywHs-Flp122 UAS-CD8-GFP; FRT40A TubP-Gal80/FRT40A; 1118-Gal4/TM2,
For ap-Gal4: ywHs-Flp122 UAS-CD8-GFP; ap-Gal4/CyO; FRT82B TubP-Gal80/FRT82B and ywHs-Flp122 UAS-CD8-GFP; UAS-tLacZ/ap-Gal4; FRT82B TubP-Gal80/FRT82B,
For c699-Gal4: ywHs-Flp122 UAS-CD8-GFP; FRT42D TubP-Gal80/FRT42D; c699-Gal4/TM6B and ywHs-Flp122 UAS-CD8-GFP; FRT42D TubP-Gal80/FRT42D; c699-Gal4/ UAS-tau-LacZ,
For dll-Gal4: ywHs-Flp122 UAS-CD8-GFP; Dll-Gal4 FRT40A TubP-Gal80/FRT40A, and ywHs-Flp122 UAS-CD8-GFP; Dll-Gal4 FRT40A TubP-Gal80/FRT40A; UAS-tau-LacZ/+,
For ey-Gal4: ywHs-Flp122 UAS-CD8-GFP;+; FRT82B TubP-Gal80/FRT82B; ey-Gal4/+ and ywHs-Flp122 UAS-CD8-GFP; UAS-tau-LacZ/+; FRT82B TubP-Gal80/FRT82B; ey-Gal4/+.
Cell counting in the medulla
We established the percentage of cells in the medulla cortex expressing each Gal4 by comparing the number of cells coexpressing GFP and Elav. The number of positive neurons in each bin was determined as the average percentage of cells in a 9025 μm2 area (n=10 brains per genotype) using a 20X immersion lens.
Immunocytochemistry
Flies were raised on standard medium at 25°C. Adult brains were dissected in cold PBS and fixed in PFA 4% during 20 minutes. Samples were incubated in a cocktail of primary antibodies diluted in 0.3% PBST (Triton X-100 in PBS) overnight at room temperature. Primary antibodies used were as follows: guinea pig anti-Dll (1/3,000, [25]), mouse anti-24B10 (1/50, DSHB), mouse anti-β-Gal (1/500, Promega), mouse anti-Elav (1/50, DSHB), rabbit anti-β-Gal (1/20,000, Cappel), rabbit anti-DsRed (1/1,000, Clontech), rabbit anti-GFP (1/1,000, Molecular Probes), rat anti-HA (1/200, Roche), rat anti-DNCad (1/25, DSHB) and sheep anti-GFP (1/1,000, Biogenesis). Brains were washed 3 times for 5 minutes in PBS and then incubated in secondary antibodies diluted in 0.3 PBST for 3 hours. Secondary antibodies (Molecular Probes) were use as follows: goat anti-rabbit Alexa488 (1/1,000), donkey anti-sheep Alexa488 (1/1,000), donkey anti-rabbit Alexa555 (1/1,000), goat anti-rat Alexa555 (1/500), goat anti-guinea pig Alexa555 (1/500) and donkey anti-mouse Alexa647 (1/200). After washing overnight, brains were mounted in Vectashield (Vector Labs).
Supplementary Material
Acknowledgments
We are very grateful to A. Celik and T. Tabata for providing us with pre-screened piggyBack Gal4 enhancer trap lines used in this work. We thank J.D. Amstrong, R. Axel, T. Cook, L. Luo, F. Rouyer, J. Treisman and the Bloomington Stock Center for stocks, and the Developmental Studies Hybridoma Bank at the University of Iowa and R. Mann for antibodies. We thank Tom Clandinin, Karl Fischbach, Adam Carter, and Justin Blau, and members of the Desplan lab for very useful comments on the manuscript and for support and discussions. We thank L. Swanson for providing us with Cajal's quote.
This work was supported by Grant NIH R01 EY017916 to C.D. This investigation was conducted in a facility constructed with support from Research Facilities Improvement Grant Number C06 RR-15518-01 from the National Center for Research Resources, National Institutes of Health.
Footnotes
“…to extend our understanding of neural function to the most complex human physiological and psychological activities, it is essential that we first generate a clear and accurate view of the structure of the relevant centers, and of the human brain itself, so that the basic plan the overview can be grasped in the blink of an eye.” Ramon y Cajal, circa 1904 [1].
Publisher's Disclaimer: This is a PDF file of an unedited manuscript that has been accepted for publication. As a service to our customers we are providing this early version of the manuscript. The manuscript will undergo copyediting, typesetting, and review of the resulting proof before it is published in its final citable form. Please note that during the production process errors may be discovered which could affect the content, and all legal disclaimers that apply to the journal pertain.
References
- 1.Ramon y Cajal S. Histology of the Nervous System of Man and Vertebrates. New York: Oxford University Press; 1995. [Google Scholar]
- 2.Wassle H. Parallel processing in the mammalian retina. Nat Rev Neurosci. 2004;5:747–757. doi: 10.1038/nrn1497. [DOI] [PubMed] [Google Scholar]
- 3.Wolff T, Ready DF. Pattern formation in the Drosophila Retina. In: Bate M, MA A, editors. The Development of Drosophila melanogaster. Vol. 2. Cold Spring Harbor: Cold Spring Harbor Laboratory Press; 1993. pp. 1277–1325. [Google Scholar]
- 4.Hardie R. Functional organization of the fly retina. Vol. 5. Berlin Heidelberg New York: Springer; 1985. [Google Scholar]
- 5.Tang S, Guo A. Choice behavior of Drosophila facing contradictory visual cues. Science. 2001;294:1543–1547. doi: 10.1126/science.1058237. [DOI] [PubMed] [Google Scholar]
- 6.Troje N. Spectral categories in the learning behaviour of blowflies. Z Naturforsch. 1993;48c:96–104. [Google Scholar]
- 7.Fukushi T. Colour perception of single and mixed monochromatic lights in the blowfly Lucilia cuprina. J Comp Physiol. 1994;175:15–22. [Google Scholar]
- 8.Franceschini N, Hardie R, Ribi W, Kirschfeld K. Sexual dimorphism in a photoreceptor. Nature. 1981;291:241–244. [Google Scholar]
- 9.Kirschfeld K, F R, Franceschini N. A photostable pigment within the rhabdomere of fly photoreceptors no. 7. J Comp Physiol. 1978;125:275–284. [Google Scholar]
- 10.Wernet MF, Desplan C. Building a retinal mosaic: cell-fate decision in the fly eye. Trends Cell Biol. 2004;14:576–584. doi: 10.1016/j.tcb.2004.09.007. [DOI] [PubMed] [Google Scholar]
- 11.Morante J, Desplan C. Building a projection map for photoreceptor neurons in the Drosophila optic lobes. Semin Cell Dev Biol. 2004;15:137–143. doi: 10.1016/j.semcdb.2003.09.007. [DOI] [PubMed] [Google Scholar]
- 12.Hofbauer A, Campos-Ortega JA. Proliferation pattern and early differentiation of the optic lobes in Drosophila melanogaster. Roux' s Arch Dev Biol. 1990;198:264–274. doi: 10.1007/BF00377393. [DOI] [PubMed] [Google Scholar]
- 13.Fischbach KF, Dittrich APM. The optic lobe of Drosophila melanogaster. I. A Golgi analysis of wild-type structure. Cell Tissue Res. 1989;258:441–475. [Google Scholar]
- 14.Rister J, Pauls D, Schnell B, Ting CY, Lee CH, Sinakevitch I, Morante J, Strausfeld NJ, Ito K, Heisenberg M. Dissection of the peripheral motion channel in the visual system of Drosophila melanogaster. Neuron. 2007;56:155–170. doi: 10.1016/j.neuron.2007.09.014. [DOI] [PubMed] [Google Scholar]
- 15.Cajal SR, Sanchez D. Contribucion al conocimiento de los centros nerviosos de los insectos. Trab Lab Invest Biol. 1915;XIII:1–167. [Google Scholar]
- 16.Strausfeld NJ. Atlas of an insect brain. Berlin, Heidelberg, New York: Springer-Verlag; 1976. [Google Scholar]
- 17.Lee T, Luo L. Mosaic Analysis with a Repressible Cell Marker for Studies of Gene Function in Neuronal Morphogenesis. Neuron. 1999;22:451–461. doi: 10.1016/s0896-6273(00)80701-1. [DOI] [PubMed] [Google Scholar]
- 18.Zuber ME, Gestri G, Viczian AS, Barsacchi G, Harris WA. Specification of the vertebrate eye by a network of eye field transcription factors. Development. 2003;130:5155–5167. doi: 10.1242/dev.00723. [DOI] [PubMed] [Google Scholar]
- 19.Desplan C. Eye development: governed by a dictator or a junta? Cell. 1997;91:861–864. doi: 10.1016/s0092-8674(00)80475-4. [DOI] [PubMed] [Google Scholar]
- 20.Connolly JB, Roberts IJ, Armstrong JD, Kaiser K, Forte M, Tully T, O' Kane CJ. Associative learning disrupted by impaired Gs signaling in Drosophila mushroom bodies. Science. 1996;274:2104–2107. doi: 10.1126/science.274.5295.2104. [DOI] [PubMed] [Google Scholar]
- 21.Gehring WJ, Ikeo K. Pax 6: mastering eye morphogenesis and eye evolution. Trends Genet. 1999;15:371–377. doi: 10.1016/s0168-9525(99)01776-x. [DOI] [PubMed] [Google Scholar]
- 22.Calleja M, Moreno E, Pelaz S, Morata G. Visualization of gene expression in living adult Drosophila. Science. 1996;274:252–255. doi: 10.1126/science.274.5285.252. [DOI] [PubMed] [Google Scholar]
- 23.Cohen B, McGuffin ME, Pfeifle C, Segal D, Cohen SM. apterous, a gene required for imaginal disc development in Drosophila encodes a member of the LIM family of developmental regulatory proteins. Genes Dev. 1992;6:715–729. doi: 10.1101/gad.6.5.715. [DOI] [PubMed] [Google Scholar]
- 24.Yang MY, Armstrong JD, Vilinsky I, Strausfeld NJ, Kaiser K. Subdivision of the Drosophila mushroom bodies by enhancer-trap expression patterns. Neuron. 1995;15:45–54. doi: 10.1016/0896-6273(95)90063-2. [DOI] [PubMed] [Google Scholar]
- 25.Estella C, McKay DJ, Mann RS. Molecular Integration of Wingless, Decapentaplegic, and Autoregulatory Inputs into Distalless during Drosophila Leg Development. Dev Cell. 2008;14:86–96. doi: 10.1016/j.devcel.2007.11.002. [DOI] [PMC free article] [PubMed] [Google Scholar]
- 26.Fujita SC, Zipursky SL, Benzer S, Ferrus A, Shotwell SL. Monoclonal antibodies against the Drosophila nervous system. Proc Natl Acad Sci U S A. 1982;79:7929–7933. doi: 10.1073/pnas.79.24.7929. [DOI] [PMC free article] [PubMed] [Google Scholar]
- 27.Iwai Y, Usui T, Hirano S, Steward R, Takeichi M, Uemura T. Axon patterning requires DN-cadherin, a novel neuronal adhesion receptor, in the Drosophila embryonic CNS. Neuron. 1997;19:77–89. doi: 10.1016/s0896-6273(00)80349-9. [DOI] [PubMed] [Google Scholar]
- 28.Solomon SG, Lennie P. The machinery of colour vision. Nat Rev Neurosci. 2007;8:276–286. doi: 10.1038/nrn2094. [DOI] [PubMed] [Google Scholar]
- 29.O' Keefe DD, Thor S, Thomas JB. Function and specificity of LIM domains in Drosophila nervous system and wing development. Development. 1998;125:3915–3923. doi: 10.1242/dev.125.19.3915. [DOI] [PubMed] [Google Scholar]
- 30.Robinson IM, Ranjan R, Schwarz TL. Synaptotagmins I and IV promote transmitter release independently of Ca(2+) binding in the C(2)A domain. Nature. 2002;418:336–340. doi: 10.1038/nature00915. [DOI] [PubMed] [Google Scholar]
- 31.Wang J, Ma X, Yang JS, Zheng X, Zugates CT, Lee CH, Lee T. Transmembrane/juxtamembrane domain-dependent Dscam distribution and function during mushroom body neuronal morphogenesis. Neuron. 2004;43:663–672. doi: 10.1016/j.neuron.2004.06.033. [DOI] [PubMed] [Google Scholar]
- 32.Strausfeld N, Campos-Ortega J. Vision in insects: pathways possibly underlying neural adaptation and lateral inhibition. Science. 1977;195:894–897. doi: 10.1126/science.841315. [DOI] [PubMed] [Google Scholar]
- 33.Datum KH, Weiler R, Zettler F. Immunocytochemical demonstration of γ-amino butyric acid and glutamic acid decarboxylase in R7 photoreceptors and C2 centrifugal fibers in the blowfly visual system. J Comp Physiol. 1986;159:241–249. [Google Scholar]
- 34.Blanchardon E, Grima B, Klarsfeld A, Chelot E, Hardin PE, Preat T, Rouyer F. Defining the role of Drosophila lateral neurons in the control of circadian rhythms in motor activity and eclosion by targeted genetic ablation and PERIOD protein overexpression. Eur J Neurosci. 2001;13:871–888. doi: 10.1046/j.0953-816x.2000.01450.x. [DOI] [PubMed] [Google Scholar]
- 35.Otsuna H, Ito K. Systematic analysis of the visual projection neurons of Drosophila melanogaster. I. Lobula-specific pathways. J Comp Neurol. 2006;497:928–958. doi: 10.1002/cne.21015. [DOI] [PubMed] [Google Scholar]
- 36.Reinke R, Zipursky SL. Cell-cell interaction in the Drosophila retina: the bride of sevenless gene is required in photoreceptor cell R8 for R7 cell development. Cell. 1988;55:321–330. doi: 10.1016/0092-8674(88)90055-4. [DOI] [PubMed] [Google Scholar]
- 37.Ng M, Roorda RD, Lima SQ, Zemelman BV, Morcillo P, Miesenbock G. Transmission of olfactory information between three populations of neurons in the antennal lobe of the fly. Neuron. 2002;36:463–474. doi: 10.1016/s0896-6273(02)00975-3. [DOI] [PubMed] [Google Scholar]
- 38.Wilson RI, Laurent G. Role of GABAergic inhibition in shaping odor-evoked spatiotemporal patterns in the Drosophila antennal lobe. J Neurosci. 2005;25:9069–9079. doi: 10.1523/JNEUROSCI.2070-05.2005. [DOI] [PMC free article] [PubMed] [Google Scholar]
- 39.Olsen SR, Bhandawat V, Wilson RI. Excitatory interactions between olfactory processing channels in the Drosophila antennal lobe. Neuron. 2007;54:89–103. doi: 10.1016/j.neuron.2007.03.010. [DOI] [PMC free article] [PubMed] [Google Scholar]
- 40.Shang Y, Claridge-Chang A, Sjulson L, Pypaert M, Miesenbock G. Excitatory local circuits and their implications for olfactory processing in the fly antennal lobe. Cell. 2007;128:601–612. doi: 10.1016/j.cell.2006.12.034. [DOI] [PMC free article] [PubMed] [Google Scholar]
Associated Data
This section collects any data citations, data availability statements, or supplementary materials included in this article.