

Abstract
Bioluminescence imaging (BLI) has emerged as a powerful new modality for studies of viral infection and therapy in small animal models. BLI technology captures the light emitted from different luciferase enzymes to detect sites of viral infection and quantify viral replication in the context of a living animal. In this review, we discuss the biochemical features of various luciferase enzymes and modifications to these enzymes that can greatly enhance their ability to image viral infection, host responses and the effects of therapy. We also describe BLI instrumentation and technical aspects of BLI needed to optimize imaging data. Examples of BLI for quantitative analysis of viral infection and in vivo monitoring of antiviral and antibacterial therapy are presented to highlight the potential for BLI to accelerate discovery of new antiviral agents and determine efficacy of antiviral compounds. Ongoing research to use multiple luciferase enzymes to image viral infection, host immune signaling pathways, and cell trafficking in the same animal will continue to advance BLI for longitudinal, real-time quantification and analyses of viral infection and pre-clinical testing of promising therapeutic agents.
Conventional studies of viral infection, responses to therapeutic agents, and host immune responses in small animal models rely upon euthanizing cohorts of animals at multiple time points to identify sites of infection and quantify viral titers. This experimental strategy has been the foundation for analyzing viral pathogenesis and treatment, but there are inherent weaknesses that limit applications of this approach for studying infection and testing new therapeutic compounds. Analyzing groups of mice at multiple time points after infection or treatment precludes serial studies of disease progression in the same animal. Data from longitudinal studies in the same animal may reveal key information about animal-to-animal variations in pathogenesis or therapeutic efficacy. Dissemination of a pathogen to an unexpected site may be missed because the infected tissue is not among the standard ones collected for analysis. Furthermore, conventional animal studies of viral infection require large numbers of animals to generate statistically meaningful data, which in turn necessitates larger amounts of candidate therapeutic agents for initial pre-clinical testing.
In vivo imaging has emerged as a powerful alternative to these conventional studies of viral pathogenesis and treatment. Among the many small animal imaging instruments that recently have been developed, bioluminescence imaging (BLI) is at the forefront of technologies used to study viral infection in mouse models. BLI detects light emitted from a variety of luciferase enzymes in the context of a living animal, allowing in vivo quantification of viral replication, dissemination, and host immune responses and signaling pathways. Importantly, these processes can be interrogated repetitively in the same animal over the course of hours to weeks, overcoming many of the limitations of conventional assays. In this paper, we will review different luciferase enzymes used for imaging, discuss details of the imaging technique to optimize quantification, and provide examples of BLI data for viral infection and therapy.
Background
Bioluminescence is produced by the reaction of a luciferase enzyme with its substrate. For BLI studies of viral infection, exogenous substrate must be delivered systemically before each imaging session. D-luciferin, the substrate for firefly and other beetle luciferases, is injected intraperitoneally, and imaging begins 8–10 minutes after injection. To image Renilla or Gaussia luciferases, coelenterazine substrate is injected into the vascular systemic by the intravenous or intracardiac route, and imaging begins as soon as the mice can be anesthetized and positioned in the imaging device. As we will describe, obtaining reproducible BLI data requires a standardized imaging protocol, including the amount of injected substrate per animal weight, the delay between injection and imaging, and the positioning of the mice.
BLI has several advantages that make it a powerful technique for studies of viral infection in mice. Instruments for BLI are relatively inexpensive compared with other small animal imaging modalities, such as positron emission tomography (PET), single photon emission tomography (SPECT), computed tomography (CT), or magnetic resonance imaging (MRI). BLI also does not require dedicated physicists or chemists to run the instrumentation and generate imaging probes, as needed for MRI and radiotracer PET and SPECT imaging, respectively. Signal-to-noise for BLI is higher than other imaging techniques because there is only very minimal background light in the intestine from chlorophyll or similar pigments present in most mouse chows. Furthermore, it is possible to image more animals per hour with BLI than other small animal imaging modalities. In our experience with BLI studies of viral infection, as many as 30 mice can be scanned in an hour. As a result, several different subgroups can be analyzed in the context of one experiment, accelerating studies of viral infection and testing of promising antiviral agents.
While BLI is the most commonly used imaging modality for animal studies of viral infection, there are important limitations that must be considered in designing experiments and interpreting data for bioluminescence. One of the key limitations is signal attenuation due to the absorption and scattering of light by mammalian tissues. Light in the visible spectrum, such as that produced by luciferases, is attenuated approximately 10-fold per cm of tissue, due to absorption by hemoglobin and other pigmented molecules in tissues (Contag et al., 1995). Melanin is the second most predominant absorber of visible light in mammals, which is an important consideration for studies using C57Bl/6 or other strains of mice with dark skin and fur. Therefore, BLI produces images that disproportionately display bioluminescence emitted from superficial sites rather than organs deep within the animal.
In contrast to tomographic techniques, BLI typically produces a single two-dimensional image of the entire animal, which can present challenges in precisely localizing sites of bioluminescence. With instruments available currently, the limitation of two-dimensional imaging can be overcome by obtaining images from perpendicular projections. Because BLI has only 1–3 mm spatial resolution, it can also be difficult to distinguish two discrete sources of light from adjacent anatomic sites. In the longer term, there are ongoing efforts to develop and optimize tomographic instruments for BLI and develop technologies to improve spatial resolution of this modality (Chaudhari et al., 2005) (Lu et al., 2006; Jansen et al., 2006). These instruments ultimately will generate cross-sectional BLI images with improved resolution, similar to images from X-ray computed tomography (CT) or magnetic resonance imaging (MRI). Even with limitations of current BLI technology, the ability to repetitively monitor and quantify disease processes in real-time makes this imaging modality particularly appealing for studies of viral infection, response to therapy, and mechanistic studies of drug effects.
Bioluminescence versus fluorescence
Bioluminescence refers to light produced from the chemical reaction of a luciferase enzyme with its specific substrate (Fig 1A). The spectrum of light produced by the bioluminescence reaction is determined by the enzyme itself (described in more detail below) and the substrate. By comparison, fluorescence imaging requires external light of appropriate wavelength to excite a target fluorescent dye molecule or genetically-encoded fluorescent protein (Fig 1B). The excited fluorescent molecule almost immediately releases longer wavelength, lower energy light for imaging studies.
Fig 1. Bioluminescence and fluorescence imaging reporters.


A. Luciferase enzymes (firefly, Renilla, or Gaussia) expressed in the cytoplasm of engineered cells catalyze production of light photons from the appropriate substrate. Beetle luciferases react with luciferin in a chemical reaction that requires magnesium, oxygen, and ATP. By comparison, Gaussia and Renilla luciferases use coelenterazine as a substrate in a reaction that does not require additional co-factors. In its native form, Gaussia luciferase is secreted from cells and reacts with substrate predominantly in the extracellular space.
B. Fluorescence imaging uses light of appropriate wavelength to excite a reporter molecule (fluorescent protein or dye molecule), resulting in emission of light with a characteristic emission spectrum for each type of fluorescent molecule. Fluorescence from dyes or proteins does not require an exogenous substrate, although fluorescence may be affected by conditions such as pH.
For small animal imaging studies using bioluminescence or fluorescence imaging, the wavelength of emitted light substantially affects transmission through tissues. Wavelengths from 650 – 900 nm, referred to as the “near-infrared window”, preferentially transmit through tissues because absorption by hemoglobin, lipids, and water is lowest in this range. Tissue autofluorescence also is minimized at these wavelengths. To improve imaging in deeper tissues, there are ongoing research efforts to develop luciferase enzymes and fluorescent proteins that emit (bioluminescence) or are excited by and emit (fluorescence) light in the far red or near infrared spectrum. As examples, green fluorescent protein (GFP) has excitation and emission wavelengths of approximately 490 and 510 nm, respectively. Both the input excitation and output emission light are strongly absorbed by tissues, limiting sensitivity for detecting GFP in deeper tissues using whole animal imaging. By comparison, near-infrared dyes such as Cy5.5, which has 675 nm excitation and 695 nm emission wavelengths, is more amenable to in vivo imaging studies. We will focus on luciferase enzymes and bioluminescence in this review because of its more widespread application for whole-animal imaging of viral infection. The reader is referred to other reviews for more details of fluorescent proteins and imaging (Shaner et al., 2005; Giepmans et al., 2006).
Luciferase enzymes for imaging
Luciferase enzymes from a variety of different organisms have been used for BLI studies of viral infection and other biologic processes (Table 1). Firefly (Photinus pyralis) luciferase, optimized for expression in mammalian cells, is the most commonly used luciferase for in vivo imaging. In a reaction that requires oxygen, magnesium, and ATP, firefly luciferase oxidizes its substrate, luciferin, to produce light with a broad emission spectrum and a peak at approximately 560 nm. Because of tissue attenuation, red and far-red emissions from firefly luciferase are detected preferentially for imaging in small animals. Luciferase enzymes also have been isolated from a click beetle, Pyrophorus plagiophthalamus, and optimized to produce green-orange (544 nm) or red (611 nm) light after oxidizing luciferin. At 37°C, light emission from these click beetle luciferases is comparable to that produced by firefly luciferase. Availability of luciferase enzymes with distinct emission spectra offers the potential to image two different biological processes in the same animal, using spectral filters to discriminate light produced by each enzyme.
Table 1.
Luciferase enzymes for BLI
| Luciferase | Peak Emission at 37°C (nm) | Substrate | Comments | References |
|---|---|---|---|---|
| Firefly (Photinus pyralis) | 612 | luciferin | codon-optimized for mammalian cells | (Zhao et al., 2005) |
| Click beetle green (Pyrophorus plagiophthalamus) | 544 | luciferin | optimized mutant | (Zhao et al., 2005)(Miloud et al., 2007) |
| Click beetle red (Pyrophorus plagiophthalamus | 611 | luciferin | optimized mutant | (Zhao et al., 2005)(Miloud et al., 2007) |
| Renilla reniformis (native) | 480 | coelenterazine | codon-optimized for mammalian cells | (Bhaumik and Gambhir, 2002) |
| Renilla reniformis(RLuc8) | 480 | coelenterazine | mutated for 5-fold increased light | (Loening et al., 2006) |
| Renilla reniformis (RLuc8.6-535) | 535 | coelenterazine | red-shifted mutant | (Loening et al., 2007) |
| Gaussia princeps | 480 | coelenterazine | native enzyme secreted | (Tannous et al., 2005)(Venisnik et al., 2007) |
Luciferases from Renilla (sea pansy) and Gaussia (marine copepod) react with a different substrate, coelenterazine, to produce blue light with an emission peak at approximately 480 nm. Both of these enzymes are ATP-independent and also are smaller than firefly luciferase, which may be advantageous for integrating into viral genomes and producing genetic fusions with other proteins of interest (Venisnik et al., 2007). Although Renilla and Gaussia luciferases have been used successfully for BLI studies (Bhaumik and Gambhir, 2002; Tannous et al., 2005), their utility is limited by the blue emission wavelength and higher background signals caused by auto-oxidation of coelenterazine (Bhaumik and Gambhir; 2002, Pichler et al., 2004) (Tannous et al., 2005). In vivo applications of these marine luciferases will be enhanced greatly by generating longer wavelength variants of these enzymes, as has been accomplished recently for Renilla luciferase (Loening et al., 2007). Wild-type Gaussia luciferase is a secreted enzyme, limiting its utility for localizing biological processes in vivo. Deleting the secretion signal from Gaussia reduces its capacity to produce light, although this form of the luciferase enzyme has been used successfully to monitor intracellular signaling pathways in cultured cells (Remy and Michnick, 2006).
In addition to these enzymes, lux operons from bacteria, such as Photorhabdus luminescens, emit blue light that has been used for BLI of bacterial infections. The lux operon encodes all proteins required for bioluminescence, including the luciferase, substrate, and substrate-regenerating enzymes. Bacteria that express a lux operon constitutively produce bioluminescence without the need for an exogenous substrate. Transferring this operon to mammalian cells would be advantageous for in vivo imaging, but there has been insufficient research to determine if this is possible.
Beyond isolating luciferase enzymes from different organisms and optimizing emission wavelengths, there also are ongoing efforts to alter the stability of luciferase enzymes for improved temporal resolution or higher levels of bioluminescence. Firefly luciferase has a half-life of ≈ 3–4 hours, which can limit the ability to detect immediate changes in viral replication. However, studies of viral infection and treatment typically are performed using once-daily asssays over the course of several days, so the half-life of luciferase should have little effect on quantitative BLI data for response to therapy. However, so as to improve the utility of firefly luciferase for monitoring rapid increases or decreases in gene expression, our laboratory and others have used destabilization motifs, such as PEST or tetra-ubiquitin, to reduce the half-life of firefly luciferase to as little as 15 minutes (Leclerc et al., 2000; Luker et al., 2003a). The trade-off for improved kinetics in monitoring gene expression is decreased amounts of luciferase, resulting in lower imaging signals that make these enzymes less useful for imaging viral infection. Researchers also have used mutagenesis to identify mutants of firefly and Renilla luciferases with improved pH, thermal, and/or resistance to proteolysis (White et al., 1996; Baggett et al., 2004; Loening et al., 2006). Stabilized enzymes improve sensitivity for imaging at the expense of losing temporal resolution for changes in promoter activity and gene expression. These modified luciferases further expand the opportunities to tailor imaging reporter strategies to the biologic questions driving a particular experiment.
In vivo pharmacology of luciferase substrates
BLI studies of viral infection have used recombinant pathogens that express luciferase enzymes, such as firefly and/or Renilla. In contrast to the bacterial lux operon, which produces its own substrate, these enzymes require an exogenous substrate (luciferin or coelenterazine, respectively). The in vivo biodistribution and pharmacology of luciferase substrates are therefore critical parameters to standardize for optimal sensitivity and reproducible quantification of BLI studies.
For BLI studies with beetle luciferases listed above, systemic delivery of the substrate luciferin typically is accomplished through intraperitoneal injection. The combination of firefly luciferase and luciferin has been used successfully for in vivo imaging throughout the body, including reporters expressed in anatomic sites protected by stringent blood-tissue barriers (central nervous system and placenta). This success is due in large part to the amplification of imaging signals by enzymatic activity of luciferase and the very low background of BLI, rather than the biodistribution of luciferin. Lee et al synthesized an I125-labeled analog of luciferin to measure biodistribution of luciferin in normal mice without expression of a beetle luciferase (Lee et al., 2003). Relatively low amounts of the injected dose (< 3%) accumulated in tissues such as bone, heart, and skeletal muscle, while < 0.5% of the substrate was retained in the brain. While I125 may have affected the overall biodistribution of luciferin, this study emphasizes the sensitivity of BLI for detecting light from enzymatic turnover of relatively low amounts of substrate.
To maximize detection of BLI signals and attain the least variation in experimental data, it is essential to standardize the dose of injected luciferin and the time between injection and the start of imaging. BLI studies typically use 150 mg/kg of luciferin in a solution of sterile saline or phosphate buffered saline. It is important to note that intraperitoneal injection of this concentration of luciferin does not produce maximal bioluminescence from firefly luciferase in tissues. Paroo et al injected either 150 mg/kg or 450 mg/kg of luciferin into mice bearing subcutaneous xenografts of tumor cells stably expressing firefly luciferase (Paroo et al., 2004). Emitted light increased by > 1500% above background luminescence in mice injected with the higher dose of luciferin, while light increased by only ≈ 100% in mice receiving the standard dose. These authors also analyzed bioluminescence produced by systemic injection of luciferin, followed by direct intratumoral injection of substrate. Direct injection of luciferin increased bioluminescence by > 6-fold above the signal produced by intraperitoneal injection of substrate, emphasizing that the standard intraperitoneal dose of luciferin does not maximize the amount of bioluminescence from firefly luciferase in vivo. The extent to which bioluminescence can be increased with higher doses of luciferin will be dependent on anatomic localization of the reporter. Nevertheless, these data point out the potential to substantially improve detection of weak bioluminescence signals in vivo, although these strategies also increase the cost of such experiments.
BLI signals from beetle luciferases peak approximately 10–20 minutes after intraperitoneal injection of substrate, depending on the experimental model (Paroo et al., 2004). Amounts of light decrease progressively through 60 minutes and typically become undetectable by 6 hours after administering substrate. The kinetics are essentially the same independent of the amount of injected luciferin (150 mg/kg versus 450 mg/kg). Because bioluminescence in vivo varies with time after injection, it is essential to begin imaging at a constant time after injecting luciferin in order to generate reproducible imaging data among individual mice on multiple days. Ideally, the optimal delay between injection of luciferin and imaging will be determined for a specific model system, and then this timing will be used in all experiments to standardize imaging data.
Imaging studies with Renilla and Gaussia luciferases use coelenterazine, a substrate that for several reasons is less favorable than luciferin. Coelenterazine typically is injected directly into the circulation, either through tail vein or intracardiac injection (Bhaumik and Gambhir, 2002; Tannous et al., 2005). Both of these routes are more cumbersome for repeated imaging studies than intraperitoneal injection. Coelenterazine auto-oxidizes in serum, which increases background signals on imaging studies. This substrate also has less favorable penetration across blood tissue-barriers, such as the blood-brain barrier, because of active transport out of tissues by ABCB1 (MDR1 P-glycoprotein) (Pichler et al., 2004; Zhao et al., 2004). In the context of viral infection, we have shown how these differences in biodistribution of luciferin and coelenterazine affect imaging studies of a recombinant Herpes simplex virus-1 that expresses both firefly and Renilla luciferases. Following corneal infection with this reporter virus, we readily detected firefly luciferase activity following intraperitoneal injection of luciferin (Fig 2) (Luker et al., 2002). However, Renilla luciferase was undetectable after intravenous injection of coelenterazine, and viral expression of Renilla could be identified only following topical administration of substrate to the infected eye. This example emphasizes that the choice of luciferase enzymes can substantially affect the ability to detect and quantify sites of infection with BLI.
Fig 2. BLI of Renilla luciferase expressed by a recombinant HSV-1 virus.

Representative images of mock-infected mice or mice infected via the cornea with 106 pfu of a recombinant HSV-1 virus that expresses Renilla luciferase. BLI was performed after intravenous or topical administration of coelenterazine. HSV-1 infection in the eye (arrow), as monitored by bioluminescence from Renilla luciferase, was detected only after topical administration of substrate.
Unlike the combination of beetle luciferases and luciferin, bioluminescence from Renilla and Gaussia luciferases shows flash kinetics after reacting with coelenterazine. For BLI studies, light emission from Renilla and Gaussia luciferases peaks 1–2 minutes after injection of substrate, and imaging signals decrease rapidly over 10–15 minutes (Bhaumik and Gambhir, 2002). Therefore, quantitative data from Renilla and Gaussia luciferase-expressing viruses will be affected greatly by small variations in timing between injection of substrate and image acquisition. On the other hand, the rapid kinetics of the coelenterazine reaction may be favorable for BLI studies using two different luciferase enzymes to monitor distinct biologic processes in vivo. BLI studies with Renilla and Gaussia may be performed with as little as 0.7 mg/kg coelenterazine, although bioluminescence continues to increase with greater doses up to at least 3.5 mg/kg. Using larger amounts of substrate potentially will improve detection of recombinant viruses expressing either Renilla or Gaussia luciferases. However, it is important to note that the cost of coelenterazine is substantially greater than luciferin, which places a practical limit on the amount of substrate that can be used for serial studies.
Quantification of BLI data
BLI data typically are quantified using region of interest (ROI) analysis to measure photons of light emitted from a defined anatomic site. Typically, quantitative data are measured as photons emitted per unit time from a fixed area (photon flux), which normalizes for differences in image acquisition time and imaging field of view. It is important to understand that these data provide relative quantification of bioluminescence, rather than absolute measurements of amounts of luciferase enzyme in a defined site. Relative quantification from BLI is due to variable attenuation of light by hemoglobin and other endogenous pigments as described above. As a result, quantitative analyses of bioluminescence among groups of mice and in the same mouse over time are most reliable using standard ROIs to measure photons emitted from a comparable anatomic site, such as the chest for infection with a respiratory virus.
Given appropriate consideration of these technical aspects, BLI can provide highly sensitive, reproducible data for luciferase activity produced by stably transfected cell lines or recombinant viruses. Using stable cell mammalian cell lines that constitutively express firefly luciferase, Sweeney et al established that BLI can detect as few as ≈ 30 cells in vitro and ≈ 1 × 10³ cells in a mouse (Sweeney et al., 1999). In both experimental settings, measured amounts of light correlated directly with numbers of cells, allowing in vivo measurements of cell proliferation. While the lower limits of detection are dependent on cell density and strength of promoter driving luciferase expression, this study emphasizes the power of BLI to detect relatively low numbers of luciferase-expressing cells.
Building upon these and related investigations with cancer cells, our laboratory and others have established that BLI data can be used to quantify replication of recombinant viruses engineered to express luciferase enzymes (see Table 2). Importantly, these BLI assays can be performed with input titers of virus that are comparable to those used for standard studies of virus-host pathogenesis. Using the firefly luciferase-expressing herpes simplex virus type-1 described above, we infected mice via the corneal route with viral titers ranging from ≈ 1 × 10² − 1 × 10⁶ pfu (Luker et al., 2002). Viral replication was monitored with BLI and compared with viral titers measured from tear films, the only non-invasive assay for HSV-1 in the corneal model of infection. BLI showed a dose-dependent increase in bioluminescence corresponding with increasing input amounts of HSV-1. Bioluminescence was maximal at day 5 and subsequently declined as the virus entered latency. At the peak of infection on day 5, luciferase activity significantly above background was detectable in mice infected with ≈ 1 × 10² pfu. By comparison, viral titers from tear films also corresponded with input titers of virus, but no virus could be detected in mice that had been infected with ≈ 1 × 10² pfu. Peak amounts of virus in tear films were greatest initially after infection and decreased over the course of infection. Differences in kinetics between BLI and viral titer data were due to the fact that most of the luciferase activity measured with BLI originated from the periocular tissues, which are infected by HSV-1 several days after inoculation of virus onto the cornea.
Table 2.
Recombinant viruses for bioluminescence imaging
| Virus | Promoter | Luciferase | Reference |
|---|---|---|---|
| HSV-1 | Divergent UL29 and UL30 promoters and oriL region | Firefly and Renilla | (Luker et al., 2002) |
| Sindbis | Subgenomic | Firefly | (Cook and Griffin, 2003) |
| Vaccinia | P7.5 early/late | Firefly | (Rodriguez et al., 1988,Luker et al., 2005) |
| Infectious hematopoietic necrosis virus | Genomic (between M and G genes) | Renilla | (Harmache et al., 2006) |
We also have demonstrated that BLI data can be used as a quantitative surrogate for replication of recombinant vaccinia viruses engineered to express firefly luciferase (Vac-FL). For cells infected in vitro with the reporter vaccinia virus, luciferase activity could be detected as early as 1 hour after inoculation of virus, and bioluminescence increased in direct proportion to viral replication (Luker et al., 2005). BLI detected infection with as few as 30 pfu of recombinant virus. Both the minimum time to detection and minimal detectable input titers of virus are dependent upon surface area occupied by infected cells, multiplicity of infection, and promoter used to drive luciferase. However, these data provide a general estimate of the sensitivity of BLI for quantifying infection with this reporter virus in vitro.
In vivo studies with this firefly-luciferase expressing vaccinia virus further established the direct correlation between bioluminescence and viral titers. We infected mice with 1 × 10⁶ pfu and quantified bioluminescence and viral titers in excised organs on day 7 post-infection (Fig 3A). Bioluminescence corresponded with viral titers in lung, liver, brain, and spleen. In addition, we measured bioluminescence produced in vivo by Vac-FL in the chest region of infected mice and correlated these measurements with standard plaque assays for viral titers in the lungs. There was a high correlation between in vivo bioluminescence and titers of Vac-FL, validating use of BLI as a quantitative assay for viral replication (Fig 3B). Vac-FL was not attenuated compared with wild-type Western Reserve vaccinia in vitro or in vivo, which validates the use of this reporter virus for studies of poxvirus pathogenesis.
Fig 3. Respiratory infection with a recombinant vaccinia virus producing firefly luciferase (Vac-FL).

A) Representative image of a mouse infected 7 days earlier with 1 × 10⁵ pfu Vac-FL via intranasal inoculation.
B) Bioluminescence from Vac-FL in the chest was quantified by region of interest analysis (y-axis) and correlated with viral titers in homogenized lungs measured by plaque assay (x-axis). There is a direct correlation (R = 0.83) between in vivo bioluminescence and ex vivo viral titers, validating the use of BLI to quantify replication of Vac-FL.
BLI has also been used to investigate the replication and dissemination of RNA viruses. Cook and Griffin generated luciferase-expressing Sindbis viruses in genetic backgrounds of fully virulent and attenuated virus strains (Cook and Griffin, 2003). For the fully virulent virus, the lower limit of detection for in vivo BLI was ≈ 103 pfu/g tissue, which was higher than the 102 pfu/g tissue threshold for a standard plaque assay on excised tissues. Sensitivity for detection and quantification of viral replication in vivo was enhanced by performing infections in albino C57Bl/6 mice, eliminating attenuation and scattering of light by pigment and fur present in the normal C57Bl/6 strain. As described above for DNA viruses, detection limits for BLI are dependent upon the promoter used to drive luciferase, the type of luciferase enzyme, and the sensitivity of the detection system. It is likely that BLI detection limits for these recombinant Sindbis viruses would be even lower for viruses constructed with newer codon-optimized versions of firefly luciferase and/or studies performed with current, more sensitive BLI imaging equipment. These authors also exploited their reporter viruses to differentiate between dissemination of alphaviruses within cells versus free virus in plasma. Because firefly luciferase requires ATP to produce light, bioluminescence is generated by intracellular virus particles. Therefore, BLI data overcomes the technical challenges inherent in removing all blood-borne, extracellular viruses from excised organs before performing a standard plaque assay. As suggested by these authors, an even more complete analysis of kinetics and magnitude of intracellular versus free virus in blood could be obtained through repetitive, non-lethal collection of blood samples at various times in disease progression.
BLI for monitoring antiviral therapy
As highlighted above, BLI provides a real-time, quantitative assay for viral replication and dissemination in living animals. While these features make it an ideal technology for measuring therapeutic efficacy of antiviral compounds, BLI has been underutilized for this purpose. As a proof-of-principle example, we used the HSV-1 corneal infection model to monitor response to therapy with the nucleoside analog valacyclovir (Luker et al., 2002). Beginning one day after HSV-1 infection, mice were treated with increasing concentrations of valacyclovir or vehicle control. BLI data showed a dose-dependent decrease in light produced by the firefly luciferase-expressing HSV-1 virus, which correlated with reductions in viral titers in tear film material. These data established that BLI can be used to quantify success of antiviral therapy and set the stage for using this technology to monitor effects of new therapeutic agents, dosing schedules, or vaccination strategies.
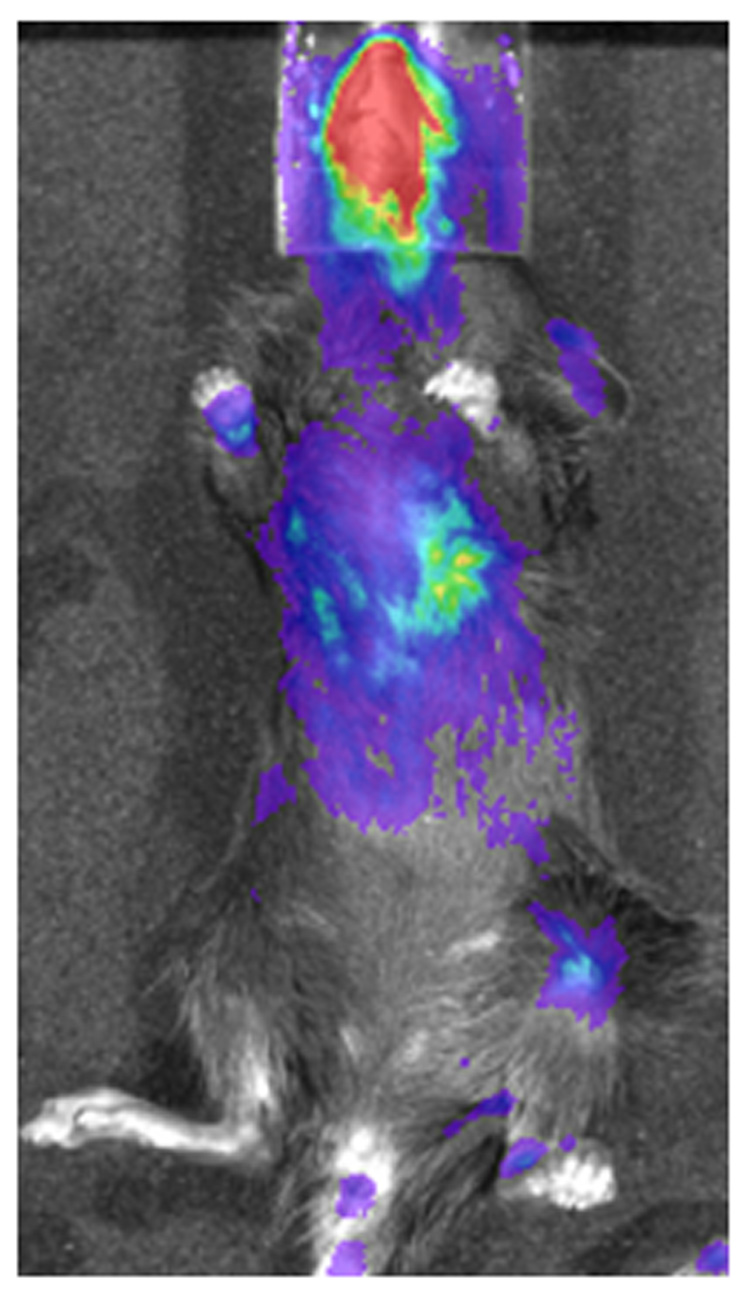
Further support for using BLI to monitor antiviral agents comes from our studies of the role of types I and II interferon in controlling HSV-1 and vaccinia virus infection. For both viruses, we used BLI to analyze viral replication and spread in wild-type mice and in mice lacking receptors for type I interferons (IFNR 1−/−) (Luker et al., 2003b, Luker et al., 2005). These studies established that interferons not only limit viral replication locally, but they also have substantial effects on viral dissemination and tissue tropism. In wild-type mice, intranasal infection with Vac-FL was limited predominantly to the nasopharynx with substantially less viral replication in the lungs and abdominal organs (Fig 4A). By comparison, spread of infection throughout the respiratory tract and systemically was significantly greater in IFNR 1−/− mice. These data can be quantified on individual days by region of interest (ROI) analysis, and viral replication in defined anatomic sites over the course of infection can be summarized by area under the curve analysis (Fig 4B). Because bioluminescence correlates directly with viral titers, these data can be used as a direct measure of antiviral effects of type I interferons.
Figure 4. Effects of type I interferons on Vac-FL infection.


A. Representative BLI image of mice lacking receptors for type I interferons (IFNR 1−/−) and wild-type mice infected intranasally with Vac-FL 5 days earlier. Image shows increased Vac-FL bioluminescence in the nasopharynx and lung (yellow arrow) of IFNR 1−/− mice relative to wild-type. IFNR 1−/− mice also have viral infection in the spleen (white arrow).
B. Area-under-the-curve analysis of Vac-FL photon flux in the head, chest, and abdomen regions of IFNR 1−/− and wild-type mice over the full course of infection. These quantitative data summarize the significant protective effect of type I interferons against vaccinia infection.
BLI has been used more widely for studies of antibacterial agents. One particularly exciting example is a study of Streptococcal pneumoniae infection (Kadurugamuwa et al., 2005). The authors engineered constitutively bioluminescent S. pneumoniae expressing a lux operon and used these bacteria to infect transgenic mice expressing firefly luciferase under control of the promoter for glial fibrillary acidic protein (GFAP). Because of differences in wavelengths of light emitted by the different luciferase enzymes and the need to inject luciferin substrate for firefly luciferase, it was possible to image both bacterial replication and the host inflammatory response in the nervous system. Using this elegant model, the authors were able to define time-dependent efficacy of the antibiotic ceftriaxone on limiting bacterial infection and host injury. Applying these same principles to studies of viral infection and treatment is likely to greatly advance development and validation of new antiviral agents for a number of different pathogens.
Conclusions and future directions
BLI is emerging as a powerful new technology to monitor viral infection in small animal models of infection and generate quantitative data for viral replication and inhibition in vivo. To date, BLI studies of viral infection have used the technology to localize expected and unexpected sites of viral infection, based on tracking the bioluminescent pathogen of interest. We envision that future in vivo studies of viral infection, host response, and antiviral therapy will incorporate increasingly sophisticated BLI imaging strategies. For example, it would be possible to monitor two different aspects of a viral life cycle in vivo, using distinct luciferase enzymes driven by separate kinetic classes of viral promoters. In addition, we envision that BLI studies will be used to monitor levels of specific viral proteins in vivo by fusing the protein of interest to a luciferase enzyme, similar to viruses encoding GFP fusion proteins (Ward and Moss, 2001).
Beyond more sophisticated BLI imaging methods, we also expect that BLI will become part of integrated, multimodality imaging studies of viral infection, host response, and therapy. Small animal imaging equipment for computed tomography (CT), magnetic resonance imaging (MRI), and radiotracer techniques (single photon or positron emission tomography; SPECT or PET, respectively) are available at many academic institutions and pharmaceutical companies. Each of these imaging modalities offers distinct capabilities for qualitative and quantitative analyses of anatomic perturbations during infection, cellular trafficking, and metabolic and physiologic host responses. Through image fusion and analysis methods, it will be possible to combine spatial and temporal information produced by these separate imaging studies.
Finally, we envision that BLI will become an integral part of drug discovery and development for antiviral agents. Luciferase reporter viruses, such as those encoding firefly luciferase, are optimal for high throughput screens to identify candidate antiviral compounds. These same reporter viruses then can be moved seamlessly to pre-clinical animal models, using BLI to monitor efficacy of therapy. As highlighted above, BLI data provide quantitative, reproducible information about viral burden and pharmacodynamic effects of therapy. By enabling longitudinal studies of viral infection and treatment in the same cohort of animals, it will be possible to reduce numbers and mice and amounts of compound needed for pre-clinical studies. These approaches will greatly advance preclinical studies of viral infection and therapy and develop imaging biomarkers that can be translated to clinical trials and patient care.
Acknowledgments
The authors thank Mike Bray for helpful suggestions regarding this review. Infectious disease imaging research in the authors’ laboratory is supported in part by R21AI066192 and NIH R24CA083099 for the University of Michigan Small Animal Imaging Resource.
Footnotes
Publisher's Disclaimer: This is a PDF file of an unedited manuscript that has been accepted for publication. As a service to our customers we are providing this early version of the manuscript. The manuscript will undergo copyediting, typesetting, and review of the resulting proof before it is published in its final citable form. Please note that during the production process errors may be discovered which could affect the content, and all legal disclaimers that apply to the journal pertain.
References
- Baggett B, Roy R, Momen S, Morgan S, Tisi L, Morse D, Gillies R. Thermostability of firefly luciferases affects efficiency of detection by in vivo bioluminescence. Mol. Imaging. 2004;3:324–332. doi: 10.1162/15353500200403178. [DOI] [PubMed] [Google Scholar]
- Bhaumik S, Gambhir S. Optical imaging of Renilla luciferase reporter gene expression in living mice. Proc. Natl. Acad. Sci. USA. 2002;99:377–382. doi: 10.1073/pnas.012611099. [DOI] [PMC free article] [PubMed] [Google Scholar]
- Chaudhari A, Darvas F, Bading J, Moats R, Conti P, Smith D, Cherry S, Leahy R. Hyperspectral and multispectral bioluminescence optical tomography for small animal imaging. Phys. Med. Biol. 2005;50:5421–5441. doi: 10.1088/0031-9155/50/23/001. [DOI] [PubMed] [Google Scholar]
- Contag C, Contag P, Mullins J, Spilman S, Stevenson D, Benaron D. Photonic detection of bacterial pathogens in living hosts. Mol. Microbiol. 1995;18:593–603. doi: 10.1111/j.1365-2958.1995.mmi_18040593.x. [DOI] [PubMed] [Google Scholar]
- Cook S, Griffin D. Luciferase imaging of a neurotropic viral infection in intact animals. J. Virol. 2003;77:5333–5338. doi: 10.1128/JVI.77.9.5333-5338.2003. [DOI] [PMC free article] [PubMed] [Google Scholar]
- Giepmans B, Adams S, Ellisman M, Tsien R. The fluorescent toolbox for assessing protein location and function. Science. 2006;312:217–224. doi: 10.1126/science.1124618. [DOI] [PubMed] [Google Scholar]
- Harmache A, LeBerre M, Droineau S, Giovannini M, Bremont M. Bioluminescence imaging of live infected salmonids reveals that the fin bases are the major portal of entry for Novirhabdovirus. J. Virol. 2006;80:3655–3659. doi: 10.1128/JVI.80.7.3655-3659.2006. [DOI] [PMC free article] [PubMed] [Google Scholar]
- Jansen E, Pickett P, Mackanos M, Virostko J. Effect of optical tissue clearing on spatial resolution and sensitivity of bioluminescence imaging. J. Biomed. Opt. 2006;11:041119. doi: 10.1117/1.2337651. [DOI] [PubMed] [Google Scholar]
- Kadurugamuwa JL, Modi K, Coquoz O, Rice B, Smith S, Contag PR, Purchio T. Reduction of astrogliosis by early treatment of pneumococcal meningitis measured by simultaneous imaging, in vivo, of the pathogen and host response. Infect. Immunity. 2005;73:7836–7843. doi: 10.1128/IAI.73.12.7836-7843.2005. [DOI] [PMC free article] [PubMed] [Google Scholar]
- Leclerc G, Boockfor F, Faught W, Frawley L. Development of a destabilized firefly luciferase enzyme for measurement of gene expression. Biotechniques. 2000;29:594–596. 598. doi: 10.2144/00293rr02. [DOI] [PubMed] [Google Scholar]
- Lee K, Byun S, Paik J, Lee S, Song S, Choe Y, BT K. Cell uptake and tissue distribution of radioiodine labelled D-luciferin: implications for luciferase based gene imaging. Nucl. Med. Commun. 2003;24:1003–1009. doi: 10.1097/00006231-200309000-00009. [DOI] [PubMed] [Google Scholar]
- Loening A, Fenn T, Wu A, Gambhir S. Consensus guided mutagenesis of Renilla luciferase yields enhanced stability and light output. Protein Eng. Des. Sel. 2006;19:391–400. doi: 10.1093/protein/gzl023. [DOI] [PubMed] [Google Scholar]
- Loening A, Wu A, Gambhir S. Red-shifted Renilla reniformis luciferase variants for imaging in living subjects. Nat. Methods. 2007;4:641–643. doi: 10.1038/nmeth1070. [DOI] [PubMed] [Google Scholar]
- Lu Y, Tian J, Cong W, Kuman D, Kumar D. MicroCT-guided Bioluminescence Tomography Based on the Adaptive Finite Element Tomographic Algorithm. Conf. Proc. IEEE Eng. Med. Biol. Soc.; 2006. pp. 381–384. [DOI] [PubMed] [Google Scholar]
- Luker G, Bardill J, Prior J, Pica C, Piwnica-Worms D, Leib D. Noninvasive bioluminescence imaging of herpes simplex virus type 1 infection and therapy in living mice. J. Virol. 2002;76:12149–12161. doi: 10.1128/JVI.76.23.12149-12161.2002. [DOI] [PMC free article] [PubMed] [Google Scholar]
- Luker G, Pica C, Song J, Luker K, Piwnica-Worms D. Imaging 26S proteasome activity and inhibition in living mice. Nat. Med. 2003a;9:969–973. doi: 10.1038/nm894. [DOI] [PubMed] [Google Scholar]
- Luker G, Prior J, Song J, Pica C, Leib D. Bioluminescence imaging reveals systemic dissemination of HSV-1 in the absence of interferon receptors. J. Virol. 2003b;77:11082–11093. doi: 10.1128/JVI.77.20.11082-11093.2003. [DOI] [PMC free article] [PubMed] [Google Scholar]
- Luker K, Hutchens M, Schultz T, Pekosz A, Luker G. Bioluminescence imaging of vaccinia virus: effects of interferon on viral replication and spread. Virology. 2005;341:284–300. doi: 10.1016/j.virol.2005.06.049. [DOI] [PubMed] [Google Scholar]
- Miloud T, Henrich C, Hammerling G. Quantitative comparison of click beetle and firefly luciferases for in vivo bioluminescence imaging. J. Biomed Opt. 2007;12:054018. doi: 10.1117/1.2800386. [DOI] [PubMed] [Google Scholar]
- Paroo Z, Bollinger R, Braasch D, Richer E, Corey D, Antich P, Mason R. Validating bioluminescence imaging as a high-throughput, quantitative modality for assessing tumor burden. Molec. Imaging. 2004;3:117–124. doi: 10.1162/15353500200403172. [DOI] [PubMed] [Google Scholar]
- Pichler A, Prior J, Piwnica-Worms D. Imaging reversal of multidrug resistance in living mice with bioluminescence: MDR1 P-glycoprotein transports coelenterazine. Proc. Natl. Acad. Sci. USA. 2004;101:1702–1707. doi: 10.1073/pnas.0304326101. [DOI] [PMC free article] [PubMed] [Google Scholar]
- Remy I, Michnick S. A highly sensitive protein-protein interaction assay based on Gaussia luciferase. Nat. Methods. 2006;3:969–971. doi: 10.1038/nmeth979. [DOI] [PubMed] [Google Scholar]
- Rodriguez J, Rodriguez D, Rodriguez J, McGowan E, Esteban M. Expression of the firefly luciferase gene in vaccinia virus: a highly sensitive gene marker to follow virus dissemination in tissues of infected animals. Proc. Natl. Acad. Sci. USA. 1988;85:1667–1671. doi: 10.1073/pnas.85.5.1667. [DOI] [PMC free article] [PubMed] [Google Scholar]
- Shaner N, Steinbach P, Tsien R. A guide to choosing fluorescent proteins. Nat. Methods. 2005;2:905–909. doi: 10.1038/nmeth819. [DOI] [PubMed] [Google Scholar]
- Sweeney T, Mailander V, Tucker A, Olomu A, Zhang W, Cao Y, Negrin R, Contag C. Visualizing the kinetics of tumor-cell clearance in living animals. Proc. Natl. Acad. Sci. USA. 1999;96:12044–12049. doi: 10.1073/pnas.96.21.12044. [DOI] [PMC free article] [PubMed] [Google Scholar]
- Tannous B, Kim D, Fernandex J, Weissleder R, Breakefiled X. Codon-optimized Gaussia luciferase cDNA for mammalian gene expression in culture and in vivo. Mol. Ther. 2005;11:435–443. doi: 10.1016/j.ymthe.2004.10.016. [DOI] [PubMed] [Google Scholar]
- Venisnik K, Olafsen T, Gambhir S, Wu A. Fusion of Gaussia luciferase to an engineered anti-carcinoembryonic antigen (CEA) antibody for in vivo optical imaging. Mol. Imaging Biol. 2007;9:267–277. doi: 10.1007/s11307-007-0101-8. [DOI] [PubMed] [Google Scholar]
- Ward B, Moss B. Visualization of intracellular movement of vaccinia virus virions containing a green fluorescent protein-B5R membrane protein chimera. J. Virol. 2001;75:4802–4813. doi: 10.1128/JVI.75.10.4802-4813.2001. [DOI] [PMC free article] [PubMed] [Google Scholar]
- White P, Squirrell D, Arnoud P, Lowe C, Murray J. Improved thermostability of the North American firefly luciferase: saturation mutagenesis at position 354. Biochem. J. 1996;319:343–350. doi: 10.1042/bj3190343. [DOI] [PMC free article] [PubMed] [Google Scholar]
- Zhao H, Doyle T, Coquoz O, Kalish F, Rice B, Contag C. Emission spectra of bioluminescent reporters and interaction with mammalian tissue determine the sensitivity of detection in vivo. J. Biomed. Opt. 2005;10:41210. doi: 10.1117/1.2032388. [DOI] [PubMed] [Google Scholar]
- Zhao H, Doyle T, Wong R, Cao Y, Stevenson D, Piwnica-Worms D, Contag C. Characterization of coelenterazine analogs for measurements of Renilla luciferase activity in live cells and living animals. Mol. Imaging. 2004;3:43–54. doi: 10.1162/15353500200403181. [DOI] [PubMed] [Google Scholar]