

Abstract
This protocol describes the procedures for measuring nanometer distances in nucleic acids using a nitroxide probe that can be attached to any nucleotide within a given sequence. Two nitroxides are attached to phosphorothioates that are chemically substituted at specific sites of DNA or RNA. Inter-nitroxide distances are measured using a four-pulse double electron–electron resonance technique, and the measured distances are correlated to the parent structures using a Web-accessible computer program. Four to five days are needed for sample labeling, purification and distance measurement. The procedures described herein provide a method for probing global structures and studying conformational changes of nucleic acids and protein/nucleic acid complexes.
INTRODUCTION
Site-directed spin labeling (SDSL) provides local structural and dynamic information about a macromolecule via electron paramagnetic resonance (EPR) spectroscopy measurements of a stable nitroxide radical attached to the macromolecule in a site-specific manner. SDSL has matured as a tool for studying proteins, especially in systems that are difficult to examine using methods such as X-ray crystallography or NMR spectroscopy1. SDSL studies of nucleic acids have also been reported2. Two major categories of measurements are used in SDSL: monitoring the rotational motions of a single nitroxide provides site-specific structural and dynamic information and measuring the distances between a pair of nitroxides yields direct structural data. Only inter-nitroxide distance measurements are discussed here.
In SDSL, the distance between a pair of electron spins (i.e., the unpaired electron at the nitroxide) is determined by measuring the strength of the dipole–dipole interaction3 –12. Inter-spin distances between 5 and 20 Å can be measured using continuouswave (cw) EPR13–15, and distances between 20 and 70 Å have been measured using pulse EPR techniques16–25. SDSL uses a pair of identical nitroxide probes, which simplifies the labeling procedure. Once the nitroxides are attached to the target molecule, the measurements are not limited by the molecular weight, which makes SDSL useful for studying high molecular weight systems. Nitroxides are generally smaller than other probes (e.g., chromophores), and therefore induce smaller structural perturbation as compared to other larger probes. It should be noted that the unpaired electron is predominantly localized at the nitroxyl group in a nitroxide26. This facilitates the interpretation of the measured distances.
This protocol describes a tool-kit that uses SDSL distance measurements for mapping global structures and monitoring conformational changes of nucleic acids and protein/nucleic acid complexes. First, we describe a nitroxide probe, designated R5, that can be efficiently attached to any nucleotide position within a given sequence27. Second, we describe the use of a 4-pulse EPR technique, called double electron–electron resonance (DEER)28, to measure inter-nitroxide distances ranging from 20 to 70 Å. Finally, we describe an Internet-accessible program, called NASNOX-W29, which permits efficient evaluation of inter-R5 distances in nucleic acids.
A sequence-independent nitroxide probe for nucleic acids
The R5 nitroxide probe is attached to a phosphorothioate that is substituted at a specific backbone position during chemical synthesis of DNA or RNA (Fig. 1)23,25,27. R5 has a number of unique features that facilitate measurements of multiple distance constraints in nucleic acids. Because the labeling scheme takes advantage of a functional group present in all nucleotides, R5 can be attached to any nucleotide position to ‘scan’ a given sequence. The efficiency of R5 labeling is close to 100%, and the presence of R5 does not severely perturb the conformation of DNA and RNA duplexes23,25,27. Because the cost of introducing a phosphorothioate, both in time and in money, is much less than other types of modification, R5 labeling is cost-effective as compared with other labeling schemes15,19,24,30–34.
Figure 1.
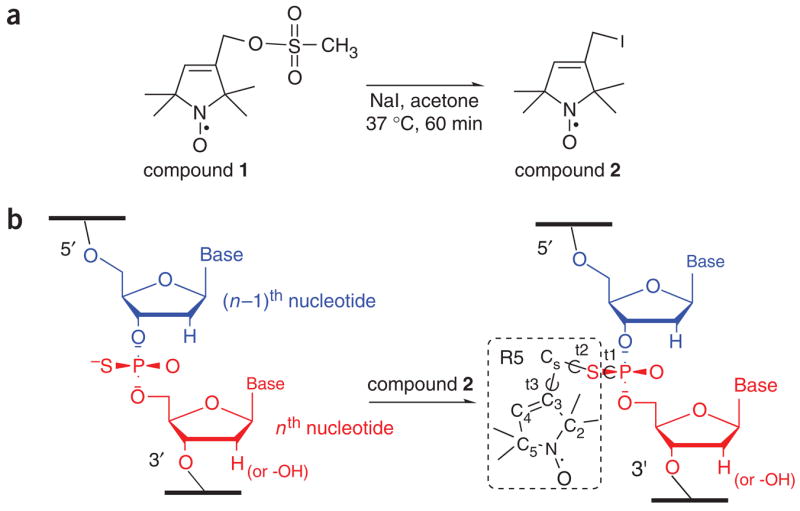
Schematics of R5 labeling. (a) Reactive R5 precursor synthesis. (b) Site-specific attachment of R5. As shown, the spin label is attached to the Sp diastereomer of the nth nucleotide within a strand of nucleic acid.
R5 is a ‘flexible’ probe—the nitroxide is attached via three rotatable single bonds in either one of the two phosphorothioate diastereomers that are introduced in a ~50/50 ratio during chemical synthesis of nucleic acids (Fig. 1)23,25. We have measured experimentally inter-R5 distances between 20 and 50 Å in nucleic acid duplexes ranging from 12 to 68 bp23,25. The measured distances can be reproduced theoretically using an efficient computer program (NASNOX) that properly accounts for the phosphorothiate diastereomers and the allowable R5 conformers23,25,29. In addition, R5 may also serve as a paramagnetic relaxing agent in NMR experiments to provide additional distance constraints. Preliminary studies also indicate that the dynamics of a single-labeled R5 provides information at the nucleotide level (A.P. and P.Z.Q., manuscript in preparation).
Measuring inter-spin distance using four-pulse DEER
A number of pulse EPR schemes have been reported28,35–41, and several have been applied to DNA19,23 and RNA18,20,24,25. Among them, the 4-pulse DEER experiment has been successfully implemented for measuring distances from 20 to 80 Å in studies of polymers28,41–43, proteins21,22,44–46 and nucleic acids19,23–25. The pulse scheme is shown in Figure 2 (ref. 28). At the ‘observer’ frequency (ν1), a refocused echo with a fixed position in time is detected for spins in resonance (defined as spin A). Between the second and third ν1 pulses, an inversion pulse is applied at the pump frequency (ν2), which flips spins that are in resonance with ν2 (defined as spin B). Dipolar coupling between spin A and B results in modulation of the amplitude of the refocused echo (Fig. 2), and the modulation frequency is a function of the inter-spin distance.
Figure 2.
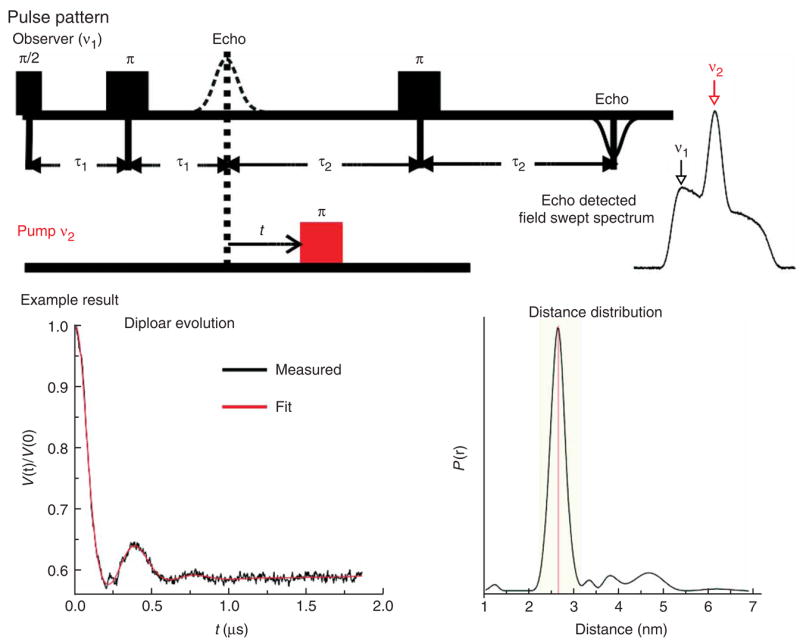
Pulse sequences for the 4-pulse double electron–electron resonance (DEER). The data shown is measured between sites 6 and 19 of the CS DNA23 (see Fig. 3a). The DEER measurement gives 〈rDEER〉 = 26.4 Å and σDEER = 1.7 Å, while the NASNOX program gives 〈rNASNOX〉 = 26.8 Å and σNASNOX = 2.8 Å for the two models reported in the CS DNA NMR structure23.
Computer program for correlating measured inter-R5 distances to the parent structure
In a nitroxide, the unpaired electron is predominantly localized at the nitroxyl group26, which in most cases is spatially distinct from the site of interest (i.e., the nitroxide attachment point at the macromolecule). We have reported a program, called NASNOX, which predicts inter-R5 distances in a given nucleic acid structure that is either determined experimentally or derived from modeling23,25,29. NASNOX models R5 at a pair of nucleic acid sites using experimentally determined bond lengths and bond angles29. With the nucleic acid coordinates fixed, the programvaries torsion angles t1, t2 and t3 (Fig. 1b) in a stepwise fashion and identifies those R5 conformers that have no steric clash between the nitroxide and the parent molecule. Once the allowable conformers are identified, the ensemble of inter-R5 distances is calculated, and the corresponding mean and s.d. of the distances is reported.
For inter-R5 distances >20 Å, the mean distances computed by NASNOX have been shown to agree very well with those measured experimentally23,25 and those computed by all atom molecular dynamics simulations29. The correlation between the s.d. of the distance distributions is less satisfying23,25, in part due to DNA motion29.
The biggest advantage of NASNOX is its speed—each R5 conformer distribution and the corresponding inter-R5 distances can be computed in seconds to minutes on a desktop PC. An Internet-accessible version of NASNOX, called NASNOX-W, is available at http://pzqin.usc.edu/NASNOX/. While the current NASNOX program is developed specifically for R5, the underlying principles should be applicable to other probes.
The following protocol has been used to study DNA and RNA23,25,29. To facilitate the presentation, a dodecameric DNA duplex (Fig. 3a) is used as an example to illustrate the procedures. This DNA is designated as CS following its PDB id no. 1CS2 (ref. 47), and spin-labeling studies on this DNA have been reported23,29.
Figure 3.

Sample data of R5 labeling and purification. (a) The sequence and secondary structure of the CS model DNA. The numbering of the phosphates is shown. (b) An example of anion-exchange HPLC results. The black trace is the 260-nm absorbance of a crude CS DNA strand with a phosphorothioate at position 4, and the red trace is the corresponding product after R5 labeling. The splitting in the unlabeled DNA is due to diastereomer separation. The labeled DNA elutes earlier than the unlabeled oligonucleotide due to the loss of a negative charge upon R5 attachment. The labeling efficiency is 94% based on the areas under respective peaks. The data shown were obtained using a PA-100 column with a flow rate of 2 ml min−1, and the linear gradient used is shown in the inset table. Variation of this gradient has been used for DNA and RNA ranging from 12 to 44 nt long. For example, for a 44-nt DNA, the gradient is modified to Step 2: 0–20% B in 4 ml; Step 3: 20–30% B in 24 ml. (c) An example of a mass spectrum of a CS DNA strand with R5 attached at position 2. (d) An example of a 20% polyacrylamide denaturing gel for examining R5 labeling. The label is attached at position 3 of a CS DNA strand. Lane 1: DNA strand without modification; Lane 2: DNA strand containing one phosphorothioate; and Lane 3: DNA strand with one R5 attached.
MATERIALS
REAGENTS
Acetone, 99.5% (Fisher Scientific, cat. no. A929-1)
Acetonitrile, 99.8% (Malinckrodt Chemicals, cat. no. 2856-10)
Glycerol (molecular biology grade, Z 99.9%; Sigma-Aldrich, cat. no. G5516)
Hydrochloric acid (HCl, molecular biology grade; Sigma, cat. no. H1758)
1-Oxyl-2,2,5,5-tetramethyl-3(methanesulfonyloxymethyl)pyrroline (compound 1, Fig. 1a) (Toronto Research Chemicals, cat. no. O872400)
3-Iodomethyl-1-oxyl-2,2,5,5-tetramethylpyrroline (compound 2, Fig. 1a) (Toronto Research Chemicals, cat. no. I709500) (see REAGENT SETUP)
2-(N-Morpholino)-ethanesulfonic acid (MES, free acid, 99.5 %; (Calbiochem, cat. no. 475893) (see REAGENT SETUP)
Sodium perchlorate, 99+% (Acros Organics, cat. no. 197120010)
Sodium chloride (molecular biology grade, 99.9%; Calbiochem, cat. no. 567441)
Sodium iodide (NaI, 99.999%; Acros, cat. no. 212680100)
2-amino-2-(hydroxymethyl)propane-1,3-diol (Tris, molecular biology grade, 99.8%, EMD Chemicals, cat. no. 9230) (see REAGENT SETUP)
MOPS, 499.5% (Sigma, cat. no. M5162) (see REAGENT SETUP)
EDTA, 99.995% (Aldrich, cat. no. 431788) (see REAGENT SETUP)
Sodium hydroxide (NaOH pellets, 499.998%; Sigma-Aldrich, cat. no. 480878)
Sterile H2O (see REAGENT SETUP)
Anion-exchange HPLC buffer A (see REAGENT SETUP)
Anion-exchange HPLC buffer B (see REAGENT SETUP)
EQUIPMENT
Bench-model Freeze-Dryer (FTS Systems, model number Flexi-Dry MP #FD-3-85A-MP)
SpeedVac (Labconco, CentriVap model 78100-00) equipped with a self-cleaning dry vacuum system (Welch Vacuum, model 2025)
Anion-exchange HPLC column (Dionex PA-100, 250 × 4 mm2; Dionex)
G-25 Sephadex column (22.5 × 1.2 cm2)
Quartz capillary, OD 1.8 mm, ID 1.5 mm (Vitrocom, Inc. Mountain Lakes, NJ, cat. no. CV1518Q)
HPLC system (Amersham Bioscience)
Bruker ELEXSYS E580 X-band pulse spectrometer (see EQUIPMENT SETUP)
REAGENT SETUP
Oligonucleotides with site-specific phosphorothioate substitutions
By convention, each phosphate ‘belongs’ to the ribose that is on the 3′-side of the P atom(Fig. 1b). For an R5 labeled at the nth nucleotide, the phosphorothioate substitution is located between the (n−1)th and nth nucleotides (Fig. 1b). For RNA labeling, a corresponding 2′-deoxyribonucleotide should be incorporated at the (n−1)th position (5′ to the phosphorothioate modification, Fig. 1b) in order to prevent strand scission upon labeling25. Either 1 or 2 nt can be modified to phosphorothioate within an oligonucleotide strand.
We have been using custom-synthesized oligonucleotides from vendors such as Integrated DNA Technology (http://www.idtdna.com/) or Dharmacon (http://www.dharmacon.com/). From these vendors, a synthesis scale of 100 nanomol generally yields >50 nmol of products for oligonucleotides <30 nt in length, which is sufficient for EPR studies (see Step 1). When ordering the oligonucleotide, one must adhere to the vender’s instructions on how to specify the desired location(s) of the internal phosphorothiate modification. One should check with the vendor regarding any additional in-house workup steps required. Generally, oligonucleotides that have undergone the basic postsynthesis deprotection and desalting procedure (e.g., ‘standard desalting’ at Integrated DNA Technology) can be used for R5 labeling without purifications. However, we recommend checking the quality of the synthesis products using HPLC or gel electrophoresis. The phosphorothioate-modified oligonucleotides can be stored in powder form at −20 °C for 3 months.
Alternatively, one may synthesize the oligonucleotide in-house using the solid-phase phosphoramidite synthesis method48,49. Because solid-phase synthesis proceeds from the 3′ to 5′ direction, a modified synthesis cycle is implemented during the addition of the (n−1)th nucleotide for a phosphorothioate substitution at the nth nucleotide (Fig. 1b). In the modified synthesis cycle, the oxidation solution is replaced by a sulfurizing agent (e.g., the Beaucage reagent50), and the oxidation step is carried out before the capping step (to avoid phosphodiester formation). A variety of sulfurizing agents are commercially available (e.g., Glen Research Co., cat. nos. 40-4036-10 and 40-4037-10). The details of the modified cycle depend on the sulfurizing agents used and the brand and model of the synthesizer.
Sterile H2O
In general, nuclease-free water should be used. In our studies, sterile water (conductivity ≥17.5 MΩ-cm) is obtained using an ultra-pure water system from Barnstead International (Nanopure Diamond (UV/UF), model no. D11931). Water is further filtered through a membrane with a pore size of 0.22 μm before use.
3-Iodomethyl-1-oxyl-2,2,5,5-tetramethylpyrroline
This is designated as compound 2 (Fig. 1a). It is commercially available and its synthesis has been reported51. However, because compound 2 is light-sensitive and degrades during storage, we recommend that compound 2 be prepared freshly before each labeling reaction from the more stable compound 1 shown in Figure 1a (see Steps 1–6).
1 M MES, pH 5.8
Dissolve 195.2 g of MES in ~0.9 l of water. Adjust the pH to 5.8 with HCl. Adjust the total volume to 1 l with water. Filter through a membrane with a pore size of 0.22 μm.
1 M Tris, pH 7.6
Dissolve 121.4 g of Tris in ~0.9 l of water. Adjust the pH to 7.6 with HCl. Adjust the total volume to 1 l with water. Filter through a membrane with a pore size of 0.22 μm.
1 M MOPS, pH 6.5
Dissolve 209.3 g of MOPS in ~0.9 l of water. Adjust the pH to 6.5 with NaOH. Adjust the total volume to 1 l with water. Filter through a membrane with a pore size of 0.22 μm.
0.5 M EDTA
Dissolve 146.1 g of EDTA in ~0.8 l of water, adjust the pH to ~8.0 (until all EDTA has dissolved). Adjust the total volume to 1 l with water. Filter through a membrane with a pore size of 0.22 μm.
ME (10 mMMOPS, 1 mM EDTA)
Add 10 ml of 1 M MOPS, pH 6.5 and 10 ml of 0.5M EDTA to 980 ml of ultra-pure water. Filter through a membrane with a pore size of 0.22 μm.
Anion-exchange HPLC buffer A
1 mM NaClO4, 20 mM Tris–HCl (pH 6.8) and 20% vol/vol acetonitrile.
Anion-exchange HPLC buffer B
400 mMNaClO4, 20mMTris–HCl (pH 6.8) and 20% vol/vol acetonitrile.
EQUIPMENT SETUP
HPLC
Any HPLC system with a two-solvent gradient capability is sufficient. We use an ÄKTA basic HPLC system from Amersham Bioscience (now part of GE Healthcare), which is equipped with a two-module pump (maximal flow rate 10 ml min−1) and a UV-Vis detector (wavelength range 190–700 nm).
Bruker ELEXSYS E580 X-band pulse spectrometer with two microwave excitation sources (observation and pump, respectively). The spectrometer is fitted with a 2-mm split-ring resonator and a liquid helium cryostat (CF935, Oxford Instruments) and is setup as it was commercially installed by Bruker.
PROCEDURE
R5 labeling TIMING 1–2 d
1| Dissolve 2.48 mg of compound 1 in 500 μl of acetone and dissolve 15 mg of NaI in 100 μl of acetone to make a 1 M NaI solution. For Steps 1–7, volumes and concentrations are calculated assuming that 18 nanomol of crude oligonucleotide are used as the starting material. Upon completion of labeling and purification (Steps 1–11), generally >5 nanomol (~30% overall yield) of R5-labeled oligonucleotide are obtained. This is sufficient for 3–4 DEER samples, each with 15 μl of 100 μM double-labeled oligonucleotide (see Step 12).
2| Add 10 μl of the 1 M NaI solution to the compound 1 solution. Mix thoroughly.
▲ CRITICAL STEP This reaction calls for equal-mole of NaI and compound 1. Avoid excess of >10% of either compound. Excess NaI will compete with compound 2 in the subsequent reaction, while excess compound 1 wastes the spin-label reagent.
3| Incubate the reaction mixture at 37 °C for 60 min. As the reaction proceeds successfully, a large amount of white precipitate (NaOSO2CH3) can be observed.
4| Separate the soluble compound 2 from the precipitated by-product (NaOSO2CH3) via centrifugation. Spin down the precipitate using a bench-top centrifuge (10 min, 18,000g, room temperature (20–25 °C)). Recover the supernatant.
5| Wash the precipitate once with acetone and spin down again as in Step 4. Combine the present supernatant fraction with that from Step 4.
6| Remove the solvent from the supernatant using a SpeedVac to obtain the desired compound 2 as a reddish-brown oil.
▲ CRITICAL STEP Compound 2 is light-sensitive, and one should avoid excessive light exposure by wrapping the tubes with aluminum foil.
▪ PAUSE POINT The dried compound 2 can be stored in the dark at −20 °C for up to 2 months, although this may result in a reduced labeling efficiency.
7| React compound 2 with oligonucleotide (total reaction volume 100 μl). Dissolve the crude oligonucleotide (see REAGENT SETUP) in H2O, determine its concentration using its absorbance at 260 nm and then prepare a 0.5 mM stock of the crude oligonucleotide. Dissolve the product from Step 6 in 20 μl of acetonitrile, then add to this solution 10 μl of 1.0 M MES (pH 5.8), 36 μl of 0.5 mM crude oligonucleotide and 34 μl H2O. Incubate the reaction mixture in the dark (wrap with aluminum foil) at room temperature for 12–24 h. Apply constant and gentle mixing during incubation.
▲ CRITICAL STEP Keep the concentration of compound 2 >60 mM. We have found empirically that [compound 2] <60 mM generally leads to incomplete nucleic acid labeling. To save compound 2, one can reduce the total reaction volume to as low as 20 μl.
▲ CRITICAL STEP The concentration of DNA or RNA can be scaled up to 1 mM. If a large quantity of labeled sample is needed (e.g., NMR paramagnetic relaxation measurements), multiple 100 μl reactions are advised.
▲ CRITICAL STEP No special adjustments are needed for attaching two labels instead of one in an oligonucleotide strand that contains two phosphorothioates.
▪ PAUSE POINT The labeling mixture can be stored at −20 °C for up to 1 week, although we recommend purification as soon as possible.
? TROUBLESHOOTING
Purification of labeled oligonucleotides TIMING 1–2 d
8| Purify R5-labeled oligonucleotides by anion-exchange HPLC. We use a PA-100 column with buffers A and B specified in the ‘REAGENT SETUP’. An example of a gradient used for purifying a 12-nt oligonucleotide is shown in Figure 3b. Samples are detected via absorbance at 260 nm. Generally, a flow rate of 2 ml min−1 is used. Sample fractions (0.5–1 ml each) are collected manually, with the total volume being 1–3 ml.
▲ CRITICAL STEP Ifmultiple peaks of samples are collected, one should first characterize the individual peak using techniques such as mass spectrometry and cw-EPR. Once the identity of the individual peak is confirmed, one can combine the appropriate sample fractions in the following steps.
▲ CRITICAL STEP For certain nucleic acid sequences, the Rp and Sp phosphorothioate diastereomers may separate during HPLC elution (see Fig. 3 and TROUBLESHOOTING). One can combine the two diastereomers for DEER measurement, or treat each diastereomer independently.
▲ CRITICAL STEP With an adjusted gradient (Fig. 3b), DNA up to 44-nt in length has been purified using the PA-100 column. Denaturing gel electrophoresis can also be used to purify R5-labeled oligonucleotides (Fig. 3d) and is recommended for longer oligonucleotides.
? TROUBLESHOOTING
9| Desalt the anion-exchange HPLC fractions using a G-25 Sephadex column with water as the running buffer.
10| Lyophilize the desalted sample from Step 9 using a bench-top freeze-dryer.
11| Resuspend the dried, labeled oligonucleotide in either ME or sterile water (20–50 μl). Determine the sample concentration via absorbance at 260 nm. Note that the absorbance for R5 (ε260 ~1,000 M−1 cm−1) can generally be ignored, as it is significantly lower than that of the nucleic acids (ε260 ~10,000 M−1 cm−1 per nucleotide). We strongly recommend at this point that the products be characterized by matrix-assisted laser desorption/ionization–time of flight mass spectroscopy, gel electrophoresis and cw-EPR.
▪ PAUSE POINT The lyophilized sample can be stored at −20 °C for up to 3 months.
DEER sample preparation TIMING ~1 d
12| Assemble a double-labeled sample under appropriate conditions. In a typical ‘annealing’ procedure for the CS DNA, a 100 μl solution containing 20 μM each of the labeled DNA strands was heated to 95 °C for 3 min, then cooled at room temperature for 20 min. The heat–cool cycle was repeated, followed by the addition of a 400 μl solution containing 5 mM NaCl and 2.5 mM Tris (pH 7.5). The mixture was incubated at room temperature for 5 h and then lyophilized. The CS duplex was then resuspended in 20 μl of a glycerol/water (20/80, vol/vol) solution. The final sample mixture contains 100 mM NaCl, 50 mM Tris pH 7.5, 20% (vol/vol) glycerol and 100 μM double-labeled DNA duplexes.
▲ CRITICAL STEP Make sure that the concentration of the double-labeled sample does not exceed 250 μM, as high concentration of spins gives rise to intermolecular spin–spin interactions that interfere with the DEER measurement and data interpretation. Data have been obtained for double-labeled samples with a concentration as low as 60 μM.
▲ CRITICAL STEP Glycerol is included to prevent sample aggregation upon freezing. It also lacks methyl groups and other highly dynamic protons that shorten the nitroxide spin phase memory time52,53.
13| Seal one end of a quartz capillary. Load 15 μl of a 100 μM double-labeled sample (200 μM spin concentration) into the capillary. Drain the sample to the bottom of the capillary by a gentle centrifugation—we generally place the capillary in a 15-ml Falcon tube, put the Falcon tube into a table-top centrifuge and spin for ~30 s (~500g, room temperature).
▪ PAUSE POINT The loaded capillary can be stored at −20 °C for up to 2 months, or the EPR spectrum can be measured immediately.
DEER data acquisition TIMING 1–2 d
14| Sample insertion and resonator and bridge tuning. Set the cryostat to 50 K and allow the temperature to equilibrate for ~30 min. Make sure there is no sample in the compartment, but the sample holder is in place before connecting the coolant. The transfer line and cryostat should be fully evacuated before use to ensure proper cooling.
▲ CRITICAL STEP On a fully functional and calibrated Bruker E580 spectrometer, the DEER experiment setup generally proceeds through three stages: (i) sample insertion and resonator and bridge-tuning (Steps 14–17); (ii) field swept spectrum acquisition (Steps 18–21); and (iii) DEER setup and acquisition (Steps 22–23). One should consult the Bruker manuals54,55, which provide detailed descriptions of these steps as well as tips and safety checks that are important for the handling of the spectrometer.
? TROUBLESHOOTING
15| Turn on the spectrometer in the cw mode and set the microwave power to ~20 dB using the control in the Tune window. With the cavity empty, adjust the frequency and critically couple the resonator. The ‘dip’ should be easy to spot at this point.
? TROUBLESHOOTING
16| Flash-freeze the sample by immersing it in liquid nitrogen. Load it immediately into the cryostat. A slight frequency shift can be observed as the sample enters into the active volume. Keep the cryostat system close to the environment during sample freezing to avoid the formation of ice crystals inside. The cryostat temperature should remain constant to within a few degrees during the loading process.
? TROUBLESHOOTING
17| Adjust the frequency with the sample in the cavity. In the cw Tune window, overcouple the resonator until the Q-value is as small as possible (the ‘dip’ almost disappears). Readjust the frequency if necessary. Turn the cw power off (attenuation is set to 60 dB) and set the spectrometer to operate.
18| Acquire the echo-detected field swept spectrum. Create a new experiment using the New Experiment tab and select the ‘DEER’ option. This step is required to set up the first DEER measurement every time the spectrometer is turned on. However, it can be omitted in the subsequent measurements.
19| Turn on the pulse traveling wave tube (TWT) amplifier, wait until it is in Standby and then set the spectrometer to pulse mode. Select the 1 kW amplifier if multiple amplifiers are available.
20| Safety Test! Following the Bruker manual55, place the magnetic field to an off-resonance position, program a π/2 (+x) − π (+x) − π (+x) pulse sequence, enter Receiver Unit parameters (i.e., video gain, video bandwidth, MW attenuation), set an acquisition trigger, and set up the SpecJet Display window. Check the presence of the defense pulses. Then set the TWT to Operate, slowly increase the microwave power (decrease MW attenuation) and check cavity ringdown.
21| Set the magnetic field (center field) to the expected location of the EPR signal (approximately g = 2 for a nitroxide sample). Find the EPR signal and identify the refocused echo. Adjust the position and length of the integrator to cover the entire echo. Optimize the echo signal by adjusting settings such as video gain, microwave attenuation, signal phase and shot repetition time (SRT). Select a two-step phase cycle. Acquire a field swept spectrum. Adjust the center field so that its value corresponds to the maximum of the spectrum. Re-optimize the refocused echo if necessary. Then acquire and store the optimized field swept spectrum. Table 1 shows an example of parameters for detecting the field swept spectrum in the R5-labeled CS DNA. Adjustments of these parameters are required for different samples.
TABLE 1.
Example of field sweep experiment parameters used in CS DNA study.
| pi/2 [ns] | 8 |
| gate [ns]a | 60–80 |
| d0 [ns]b | 448 |
| d1 [ns] | 200 |
| d2 [ns] | 1200 |
| Phase cycling | Two-step |
| Shots/point | 100 |
| Number of points | 512 |
| Number of scans | 1 |
| Shot repetition time (SRT) [ms] | 1000 |
| Field position [G] | Maximum of the spectrum |
| Center field [G] | Maximum of the spectrum |
| Sweep width [G] | 200 |
Set the length of the integrator gate so that it encompasses the entire echo.
Adjust d0 to place the integrator at the beginning of the refocused echo. One may also vary d0 (e.g., –1948) to examine the Hahn echo.
? TROUBLESHOOTING
22| DEER setup and acquisition. Set up the pump pulse. Open the 4-P DEER tab, select the appropriate pump pulse length [pi (ELDOR)] and set attenuation to 0 dB (maximal power from the pump source).
▲ CRITICAL STEP We have used pi (ELDOR) = 16 ns in our studies (Table 2)23,25. For different spectrometers and different samples (particularly those with weak signals), one should optimize the pump pulse length to achieve the best possible modulation amplitude in the DEER measurement. The Bruker manual55 describes a number of semi-automatic pump pulse optimization procedures. For example, one can carry out a nutation experiment, in which a pump pulse with a length of 0 ns is placed before an observer Hahn echo sequence. The pump (ELDOR) frequency is set to the same as the observer frequency. With ELDOR attenuation fixed at 0 dB, the pump pulse length is increased to determine the value at which maximal echo inversion is observed. This value is the optimum pump pulse length.
TABLE 2.
Example of 4P-DEER parameters used in the CS DNA study.
| pi/2 [ns] | 8 |
| gate [ns] | 80 |
| d0 [ns] | 448 |
| d1 [ns] | 200 |
| d2 [ns]a | 2000 |
| pi (ELDOR) [ns] | 16 |
| d3 [ns] | 100 |
| Phase cycling | Two-step |
| Shots/point | 100 |
| Number of points | 512 |
| dx [ns] | 4 |
| Number of scansb | 13,200 (set to maximum) |
| SRT [ms] | 1000 |
| Field position [G] | Low field edge of the field-swept spectrum |
| Current ELDOR frequency [GHz] | Maximum of the field-swept spectrum |
| Attenuation [dB] | 0 |
d2 values between 800 and 2500 ns allows measurement of distances between 20 and 50 Å.
Stop when a desired signal-to-noise ratio is obtained.
23| In the 4-P DEER tab, set the field position for observation (‘Field Position’ in G) to the low field edge of the field swept spectrum (ν1, Fig. 2, Table 2). Set the position of the pump pulse (‘Current ELDOR Freq.’, in GHz) to the maximum of the field swept spectrum (ν2, Fig. 2, Table 2). Enter additional parameters (see Table 2 for an example from the CS DNA study). Start the DEER spectrum acquisition. Collect a few spectra to ensure that the acquisition will proceed correctly, then data average until the desired signal-to-noise ratio is obtained (generally ranging from 5 to 24 h).
▲ CRITICAL STEP For a nitroxide, the pump pulse position is typically ~70 MHz lower than the observer microwave frequency. See the Bruker manual for a detailed explanation on selecting and setting the field position and the ELDOR frequency55.
▪ PAUSE POINT Once the DEER data has been collected, it is stored and can be analyzed at any time.
? TROUBLESHOOTING
DEER data analysis TIMING 1–2 h
24| Launch the DeerAnalysis2006 program in Matlab. Use the ‘load’ button in the ‘Data set’ panel to load the DEER data in the Bruker ELEXSYS format. The data are shown as the black trace in the ‘original data’ panel.
▲ CRITICAL STEP A number of programs have been reported for DEER data analysis12,56–58. We have been using the DeerAnalysis2006 package developed by Jeschke and co-workers (http://dg3.chemie.uni-konstanz.de/~agje/G1.htm). A detailed manual is provided with the program, and the readers are strongly encouraged to consult it. The description that follows is for treating data in a macroscopically isotropic system.
25| Prepare the data by optimizing the zero time, phase and cut-off time from the original data panel.
26| In the ‘background model’ panel, select the ‘homogeneous 3 dimensions’ option, then compute the background correction by pressing the ‘optimize’ button next to ‘Backgr’ in the original data panel. This generates an exponential decay background due to the spins with randomly distributed inter-spin distances.
27| Specify start and end distances in the ‘Distance distribution’ panel (generally 2–8 nm).
28| Select the ‘Tikhonov reg.’ option at the ‘Distance analysis’ panel, check the ‘Compute L curve’ option, then click on the ‘Fit’ button. The fit result is shown in the ‘Dipolar evolution’ panel (either in the ‘Time domain’ or in the ‘Spectrum’ (frequency domain)), and the distribution is shown in the ‘Distance distribution’ panel. Note that the program also provides options for fitting the data to user-defined P(r) models, and model functions for one or two Gaussian peaks have been implemented. The user should consult the DEERAnalysis2006 manual and relevant literatures56–58 to select the appropriate fitting methods.
29| Once a satisfactory fit is obtained, press the ‘save’ button at the ‘Data set’ panel. Six files will be saved. The average distance for the selected range of the start/end distances is in the ‘_res.txt’ file. One can also compute the average distance and the s.d. for other selected distance ranges using data from the ‘_distr.dat’ file.
Computation of inter-R5 distances TIMING <1 h
30| Prepare the input PDB structure file. Download structures in PDB format. NASNOX-W accepts PDB structures downloaded from the Protein Data Bank59 or the Nucleic Acid Database60 or structures processed through programs such as AMBER861. Note that input structures with or without protons can both be used. If the structure does not contain protons, NASNOX-W will add these in a standard geometry.
▲ CRITICAL STEP Edit files containing multiple structures (i.e., structures determined by NMR, or files with multiple molecules in one unit cell) into multiple input files, with each input file containing only one structure.
▲ CRITICAL STEP For an RNA structure, the O2* (or O2′) atom(s) in the (n−1)th nucleotide(s) (Fig. 1b) should be deleted from the PDB file.
31| Access NASNOX-W at http://pzqin.usc.edu/NASNOX/. Figure 4 shows an example of input parameter setup. The current NASNOX-W corresponds to version 1.1 of NASNOX, as reported in refs. 29 and 25, with the hydrophobic contact option (see Step 37) set to ‘No’. An earlier version of NASNOX (version 1.0) was used in ref. 23.
Figure 4.
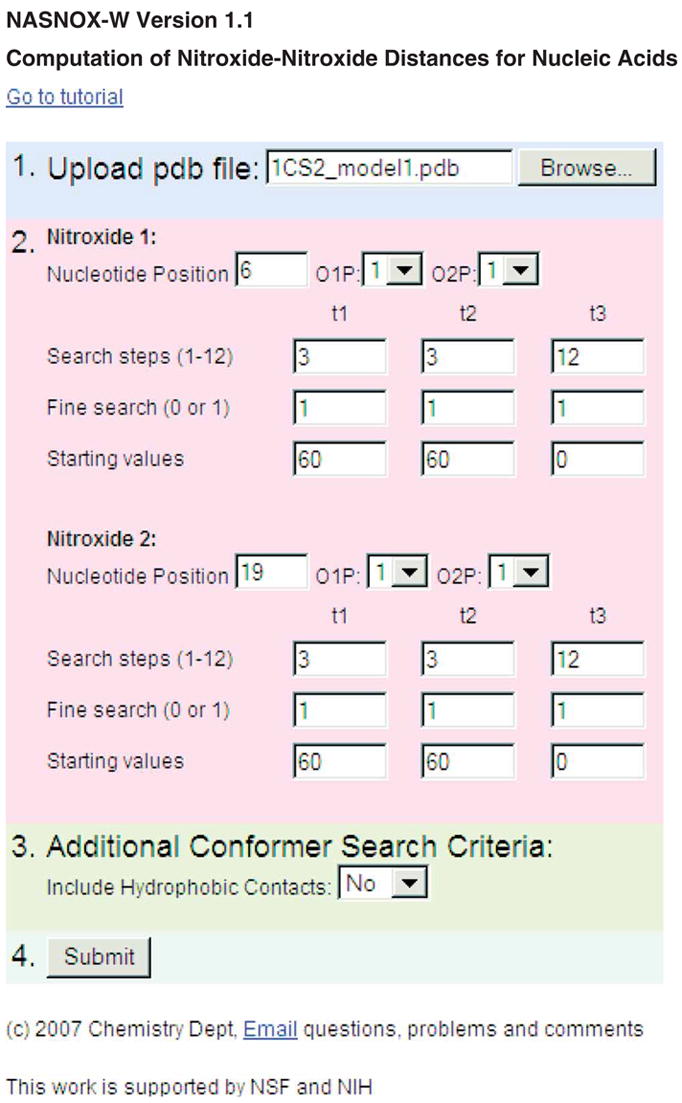
The NASNOX-W interface.
32| Upload the input structure in PDB format, which has been processed as described in Step 30 above.
33| Specify the position of the nucleotide with the first R5 label. See Figure 1b regarding the definition of nucleotide number.
34| To replace the O1P atom with R5, specify ‘1’ at the ‘O1P′ option, otherwise specify ‘0’. Repeat at the ‘O2P’ option for replacing the O2P atom with R5.
▲ CRITICAL STEP The label is added by replacing the O1P (OA, OP1 are acceptable in the PDB file) or O2P (OB, OP2) atom, or both. In our studies, we have found that some PDB files designate the Rp non-bridging oxygen as ‘O1P’ and the Sp nonbridging oxygen atom as ‘O2P’ (e.g., PDB ID 1SDR25), while other files use the reverse designation (Rp: ‘O2P’ and Sp: ‘O1P’; e.g., PDB ID 1CS229). The user must examine the PDB structure to determine the nomenclature of desired nonbridging O atoms for R5 attachment. As a guide, the RP diastereomer of a phosphorothioate-substituted R5 has the label oriented into the major groove of a DNA or RNA duplex.
▲ CRITICAL STEP The RP and SP diastereomers can be constructed simultaneously for each labeled position, in which case an ensemble of distances is computed between the racemic mixtures of labels at the two specified positions.
35| For the t1 torsion angle (Fig. 1b), specify the ‘number of search steps’ and the ‘starting value’. To invoke the ‘fine search’ option, specify ‘1’ in the corresponding box, otherwise specify ‘0’. Repeat these procedures to specify search criteria for torsion angles t2 and t3 (Fig. 1b).
▲ CRITICAL STEP NASNOX-W constructs the R5 label by setting torsion angle C5′–O5′–P–S at the value in the original DNA duplex (with S substituted for O1P or O2P and a P–S bond length of 1.99 Å )29. Torsion angles t1 (O5′–P–S–Cs), t2 (P–S–Cs–C3) and t3 (S–Cs–C3–C2) (Fig. 1b) are variable based on user input.
▲ CRITICAL STEP The ‘number of search steps’ is an integer and determines the value of the increment (I = 360/‘number of search steps’) in the allowable conformer search. ‘Number of search steps’ up to 12 has been tested successfully. We have typically used values of 3, 3 and 12 for the ‘number of search steps’ for t1, t2 and t3, respectively29, although a smaller value for t3 (3 or 6) is also acceptable.
▲ CRITICAL STEP The ‘starting value’ can be any integer between 0 and 360, although the chemically preferred values for t1 and t2 are 60 (gauche+), 180 (trans) and 300 (gauche−)29. For t3, a starting value of 0 can be used29.
▲ CRITICAL STEP Conformers are accepted if no atoms of the nitroxide label and the DNA come within a contact distance defined as 75% of the sum of the van der Waals radii of any two interacting atoms23. If selected, the ‘fine search’ option is invoked for a conformer that does not meet the appropriate steric criteria29. With this option, a fine search over the local conformational space is performed, with t1, t2 and t3 varied systematically as the original torsion angle (T) − 0.2*increment (I); T − 0.1*I; T; T + 0.1*I; and T + 0.2*I.
36| Repeat Steps 33–35 for the second R5 label.
37| (Optional) In the ‘Additional Conformer Search Criteria’ (Fig. 4), set the option to include or exclude hydrophobic contacts in the calculation. The default option is ‘No’, which excludes such contacts.
▲ CRITICAL STEP NASNOX-W corresponds to NASNOX version 1.1 reported in refs. 25 and 29, which selects allowable R5 conformer based only on the steric consideration. The ‘additional search criteria’ option is designed for future improvement of NASNOX, which will include additional physical interactions between R5 and nucleic acids in the allowable conformer search. One interaction was revealed in molecular dynamics simulations of R5-labeled DNA, which identified a conformer population that is stabilized by ‘hydrophobic contacts’ between the spin label and a thyminemethyl group29. We are currently working on incorporating the ‘hydrophobic contact’ criterion in NASNOX. To reproduce data from refs. 25 and 29, set this option to ‘No’.
38| Once the parameters for both R5 labels are defined, press the ‘submit’ button. The progress of the program will be reported on the screen. With the options specified in Figure 4, the runtime is ~25 s.
? TROUBLESHOOTING
39| Retrieve the output files following the links on the screen. Downloading these files to a local computer is usually most effective. The output files include: (i) a text file, ‘data.add’, which summarizes the input data, reports on the allowable conformers, lists the ensemble of inter-R5 distances and calculates an overall inter-R5 distance for the specified system and (ii) a PDB file, ‘data001lig.pdb’, with the allowable R5 conformers modeled onto the original structure. This can be viewed using the view ‘data001lig.pdb using JMol Applet’ option or by downloading the PDB file to a local computer.
? TROUBLESHOOTING
TIMING
Steps 1–7, R5 precursor preparation and oligonucleotide labeling: 1–2 d
Steps 8–11, purification of labeled oligonucleotides: 1–2 d
Steps 12 and 13, DEER sample preparation: 1 d
Steps 14–23, DEER data acquisition: 1–2 d. Data average time ranges from 6 to 24 h depending on the sample concentration and the range of the distance being measured
Steps 24–29, DEER data analysis: 1–2 h
Steps 30–39, NASNOX-W analysis: <1 h
? TROUBLESHOOTING
Troubleshooting advice can be found in Table 3.
TABLE 3.
Troubleshooting table.
| Step | Problem | Possible reason | Solution |
|---|---|---|---|
| R5 labeling | |||
| 7 | Precipitation when spin label is added to the nucleic acid solution | Nucleic acid (generally 4100 nt) crashed out of solution | Reduce the amount of acetonitrile |
| Phase separation | Poor mixing between the aqueous solution and the acetonitrile solution of nitroxide | Constant and gentle vortexing during incubation | |
| 8 | Broad elution profile without clearly distinguishable peaks | Nucleic acid forms secondary structures that interfere with HPLC separation | Purify using denaturing gel electrophoresis |
| Doublet in the HPLC traces, all elute earlier than the unlabeled species | Separation of the phosphorothioate diastereomers in the labeled oligonucleotide | Collect all peaks and confirm R5 labeling by mass spectrometry and continuous-wave-electron paramagnetic resonance (cw-EPR); All R5-labeled fractions may be combined in subsequent steps | |
| Multiple peaks in HPLC traces, some of them elute at the same position as the unlabeled species | Incomplete R5 labeling | Verify the presence of phosphorothioate in the oligonucleotide by mass spectrometry, I2 cleavage and nuclease digestion | |
| Increase incubation time at Step 7 | |||
| Increase the amount of compound 1 | |||
| DEER data acquisition | |||
| 14 | The temperature does not decrease | Presence of an obstruction in the system | Check that the needle valve which controls the flow of liquid helium is open |
| If the needle valve works well, disassemble the transfer line, warm up to room temperature and purge with dry air or nitrogen | |||
| In rare instances, the obstruction may be in the cryostat. If purging the transfer line does not solve the issue, warm up the entire system and purge it carefully before reassembly | |||
| 15 | The ‘dip’ cannot be located | The system is over- or undercoupled | Adjust the coupling while scanning the frequency to locate the ‘dip’ |
| The system has automatically entered the pulse mode to protect the hardware | Enter the FT Bridge window and use the Bridge/Standard Configuration tab to select the cw mode | ||
| 16 | The slight shift in frequency is not observed when the sample is inserted in the cryostat | The capillary may not be positioned correctly in the cavity | Remove the sample and insert it again |
| Ice forms on the capillary | Long exposure of the frozen capillary to air | Keep capillary immersed in liquid N2 until loading | |
| Capillary stuck to the resonator | Ice introduced into the resonator | Warm up and purge the system | |
| ‘Dip’ disappears | Ice introduced into the resonator | Warm up and purge the system | |
| Capillary shatters | Capillary not properly sealed | Prepare multiple sample capillaries | |
| 21 | Echo signal is clipped | Video gain value is too high | Display the signal without averaging and set the video gain so that the echo is not clipped |
| SpecJet Display gives an error message | One or more of the timings may be incorrect | Verify that all the time intervals are set correctly | |
| Refocused echo and Hahn echo are weak or cannot be detected | Settings are not optimized properly | Verify that center field and field position are set properly; Readjust settings | |
| Sample not in the active volume | Reinsert the sample | ||
| Spin concentration may be too low | Collect a cw-EPR spectrum to verify spin concentration. Relabel as needed | ||
| Strong Hahn echo, but weak or non-existence of the refocused echo | Sample has short-phase memory time | Try to increase phase memory time by lowering temperature or changing solvent (D2O instead of H2O) | |
| 23 | Only mono-exponential echo decay is observed | Low concentration of interacting spin pairs | Check and adjust labeling and assembling procedures to ensure sufficient presence of double-labeled sample |
| NASNOX-W | |||
| 38 | The NASNOX-W Applet fails to run | Errors in the PDB coordinates; incorrect atom names in the PDB file | Check structure correctness using a graphics program; check atoms names, particularly of phosphates |
| 39 | Corrupted structure in ‘data001lig.pdb’ | Errors in writing the output structure due to variations in the PDB input file (e.g., modified nucleotides) | Check the input PDB file format. However, in most such cases, distance information in the ‘data.add’ file is preserved |
ANTICIPATED RESULTS
R5 labeling
Examples of characterizing R5-labeled oligonucleotides are shown in Figure 3. Covalent attachment of one R5 group neutralizes one negative charge at the nucleic acid backbone. For DNA/RNA <30 nt in length, R5-labeled oligonucleotides elute earlier than the corresponding unmodified species during anion-exchange HPLC (Fig. 3b). This can be used to assess the labeling efficiency. The efficiency of R5 labeling (Steps 1–7) is generally >90%.
DEER measurements
The dipolar evolution spectrum should show at least one full period of oscillation (Fig. 2).
NASNOX-W analysis
Interpretation of the calculated conformer ensemble in the ‘data.add’ file. This file gives the status of each conformer for each label position:
| Label# | Conformer# | t1 | t2 | t3 | Search result |
|---|---|---|---|---|---|
| 1 | 1 | 60.0 | 60.0 | 0.0 | clash |
| 2 | 40 | 180.0 | 60.0 | 90.0 | conformer fit |
| 3 | 44 | 180.0 | 60.0 | −150.0 | modified fit 11 conformers |
One line is written for each conformer. The label number is specified in the order of definition in Steps 33–36. In the example shown in Figure 4, label 1 = nitroxide 1/O1P, label 2 = nitroxide 1/O2P, label 3 = nitroxide 2/O1P, label 4 = nitroxide 2/O2P. The conformer number specifies the particular set of (t1,t2,t3). With the ‘fine search’ and ‘hydrophobic contact’ switched off, the ‘search result’ is one of two options: ‘clash’ (the conformer is sterically disallowed) and ‘conformer fit’ (the conformer is acceptable). Invoking the ‘fine search’ option25,29 leads to a third possibility: a ‘modified fit’ for conformers that are spatially close to an originally clashing conformer (in this case, the number of acceptable ‘fine search’ conformers is also written).
Interpretation of the calculated inter-R5 distance in the ‘data.add’ file. The inter-R5 distances are output as follows:
| nox (base)– | nox (base) | N–N | O–O | mNO–mNO | ||
|---|---|---|---|---|---|---|
| 1 60 (6) – | 3 4 (19) | 28.3 | 29.9 | 29.1 | ||
| 1 68 (6) – | 4 88 (19) | 25.5 | 27.3 | 26.4 | 16 | |
| 2 40 (6) – | 3 44 (19) | 28.4 | 29.8 | 29.1 | 11 | |
| 2 45 (6) – | 4 43 (19) | 28.5 | 30.6 | 29.6 | 5 | 31 |
One line is written for each pair of label conformers. A label conformer is identified by the label number, the conformer number and the nucleotide attachment in parentheses. Distances are shown for measurements between nitrogen atoms (N–N), between oxygen atoms (O–O) and between the midpoints of the nitroxyl groups (the N–O bond; mNO–mNO) of each R5. For distances measured based on the conformers found using a ‘modified fit’ with the ‘fine search’ option, the number(s) of conformers found in the fine search is indicated at the end of the line.
Interpretation of the overall inter-R5 distance in the ‘data.add’ file. The overall inter-R5 distance for the specified system is output as follows (last lines of the ‘data.add’ file):
| Average distance | 27.3 | 28.7 | 28.0 | |
| s.d. | 2.3 | 2.8 | 2.6 | (9,604) |
Overall N–N, O–O, mNO–mNO distances (defined above) are output, with the s.d. for each. The number of inter-R5 distances in the ensemble is shown in parentheses.
Correlating DEER results with NASNOX outputs
Satisfactory correlations between DEER-measured average distances and those predicted by NASNOX have been demonstrated in duplexes of B-form DNA (R2 = 0.98)23 and A-form RNA (R2 = 0.97)25.
Acknowledgments
We thank Dr. Wayne L. Hubbell for providing access to a Bruker E-580 spectrometer; Drs. Wayne L. Hubbell, Christian Altenbach, Ned Van Eps and Balachandra G. Hegde for advice and discussions on DEER measurements; and Drs. Eric Chambers and Melina Bayramyan for early development of the NASDAC algorithm framework in which the NASNOX algorithm is based. Financial support is provided by the National Institutes of Health (R01 GM069557) and the National Science Foundation (MCB0546529). The authors also thank the William R. Wiley Environmental Molecular Sciences Laboratory for a pulse EPR instrumentation time award.
Footnotes
Reprints and permissions information is available online at http://npg.nature.com/reprintsandpermissions
References
- 1.Fanucci GE, Cafiso DS. Recent advances and applications of site-directed spin labeling. Curr Opin Struct Biol. 2006;16:644–653. doi: 10.1016/j.sbi.2006.08.008. [DOI] [PubMed] [Google Scholar]
- 2.Qin PZ, Dieckmann T. Application of NMR and EPR methods to the study of RNA. Curr Opin Struct Biol. 2004;14:350–359. doi: 10.1016/j.sbi.2004.04.002. [DOI] [PubMed] [Google Scholar]
- 3.Hubbell WL, Altenbach C. Investigation of structure and dynamics in membrane proteins using site-directed spin labeling. Curr Opin Struct Biol. 1994;4:566–573. [Google Scholar]
- 4.Hubbell WL, Cafiso DS, Altenbach C. Identifying conformational changes with site-directed spin labeling. Nat Struct Biol. 2000;7:735–739. doi: 10.1038/78956. [DOI] [PubMed] [Google Scholar]
- 5.Berliner LJ, Eaton GR, Eaton SS, editors. Biological Magnetic Resonance. Vol. 19. Kluwer Academic; New York: 2000. Distance measurements in biological systems by EPR; p. 614. [Google Scholar]
- 6.Borbat PP, Costa-Filho AJ, Earle KA, Moscicki JK, Freed JH. Electron spin resonance in studies of membranes and proteins. Science. 2001;291:266–269. doi: 10.1126/science.291.5502.266. [DOI] [PubMed] [Google Scholar]
- 7.Lakshmi KV, Brudvig GW. Pulsed electron paramagnetic resonance methods for macromolecular structure determination. Curr Opin Struct Biol. 2001;11:523–531. doi: 10.1016/s0959-440x(00)00242-6. [DOI] [PubMed] [Google Scholar]
- 8.Hubbell WL, Altenbach C, Hubbell CM, Khorana HG. Rhodopsin structure, dynamics, and activation: a perspective from crystallography, site-directed spin labeling, sulfhydryl reactivity, and disulfide cross-linking. Adv Protein Chem. 2003;63:243–290. doi: 10.1016/s0065-3233(03)63010-x. [DOI] [PubMed] [Google Scholar]
- 9.Steinhoff HJ. Inter- and intra-molecular distances determined by EPR spectroscopy and site-directed spin labeling reveal protein-protein and protein-oligonucleotide interaction. Biol Chem. 2004;385:913–920. doi: 10.1515/BC.2004.119. [DOI] [PubMed] [Google Scholar]
- 10.Jeschke G. EPR techniques for studying radical enzymes. Biochim Biophys Acta. 2005;1707:91–102. doi: 10.1016/j.bbabio.2004.02.012. [DOI] [PubMed] [Google Scholar]
- 11.Jeschke G, Polyhach Y. Distance measurements on spin-labelled biomacromolecules by pulsed electron paramagnetic resonance. Phys Chem Chem Phys. 2007;9:1895–1910. doi: 10.1039/b614920k. [DOI] [PubMed] [Google Scholar]
- 12.Schiemann O, et al. Spin labeling of oligonucleotides with the nitroxide TPA and use of PELDOR, a pulse EPR method, to measure intramolecular distances. Nat Protoc. 2007;2:904–923. doi: 10.1038/nprot.2007.97. [DOI] [PubMed] [Google Scholar]
- 13.Rabenstein MD, Shin YK. Determination of the distance between two spin labels attached to a macromolecule. Proc Natl Acad Sci USA. 1995;92:8239–8243. doi: 10.1073/pnas.92.18.8239. [DOI] [PMC free article] [PubMed] [Google Scholar]
- 14.Altenbach C, Oh KJ, Trabanino RJ, Hideg K, Hubbell WL. Estimation of inter-residue distances in spin labeled proteins at physiological temperatures: experimental strategies and practical limitations. Biochemistry. 2001;40:15471–15482. doi: 10.1021/bi011544w. [DOI] [PubMed] [Google Scholar]
- 15.Kim N, Murali A, DeRose VJ. A distance ruler for RNA using EPR and site-directed spin labeling. Chem Biol. 2004;11:939–948. doi: 10.1016/j.chembiol.2004.04.013. [DOI] [PubMed] [Google Scholar]
- 16.Persson M, et al. Comparison of electron paramagnetic resonance methods to determine distances between spin labels on human carbonic anhydrase II. Biophys J. 2001;80:2886–2897. doi: 10.1016/S0006-3495(01)76254-6. [DOI] [PMC free article] [PubMed] [Google Scholar]
- 17.Borbat PP, McHaourab HS, Freed JH. Protein structure determination using long-distance constraints from double-quantum coherence ESR: study of T4 lysozyme. J Am Chem Soc. 2002;124:5304–5314. doi: 10.1021/ja020040y. [DOI] [PubMed] [Google Scholar]
- 18.Schiemann O, Weber A, Edwards TE, Prisner TF, Sigurdsson ST. Nanometer distancemeasurements on RNA using PELDOR. J Am Chem Soc. 2003;125:3334–3335. doi: 10.1021/ja0274610. [DOI] [PubMed] [Google Scholar]
- 19.Schiemann O, et al. A PELDOR based nanometer distance ruler for oligonucleotides. J Am Chem Soc. 2004;126:5722–5729. doi: 10.1021/ja0393877. [DOI] [PubMed] [Google Scholar]
- 20.Borbat PP, Davis JH, Butcher SE, Freed JH. Measurement of large distances in biomolecules using double-quantum filtered refocused electron spin-echoes. J Am Chem Soc. 2004;126:7746–7747. doi: 10.1021/ja049372o. [DOI] [PubMed] [Google Scholar]
- 21.Sale K, Song L, Liu YS, Perozo E, Fajer P. Explicit treatment of spin labels in modeling of distance constraints from dipolar EPR and DEER. J Am Chem Soc. 2005;127:9334–9335. doi: 10.1021/ja051652w. [DOI] [PubMed] [Google Scholar]
- 22.Banham JE, Timmel CR, Abbott RJ, Lea SM, Jeschke G. The characterization of weak protein-protein interactions: evidence from DEER for the trimerization of a von Willebrand Factor A domain in solution. Angew Chem Int Ed Engl. 2006;45:1058–1061. doi: 10.1002/anie.200503720. [DOI] [PubMed] [Google Scholar]
- 23.Cai Q, et al. Site-directed spin labeling measurements of nanometer distances in nucleic acids using a sequence-independent nitroxide probe. Nucleic Acids Res. 2006;34:4722–4734. doi: 10.1093/nar/gkl546. [DOI] [PMC free article] [PubMed] [Google Scholar]
- 24.Piton N, et al. Base-specific spin-labeling of RNA for structure determination. Nucleic Acids Res. 2007;35:3128–3143. doi: 10.1093/nar/gkm169. [DOI] [PMC free article] [PubMed] [Google Scholar]
- 25.Cai Q, et al. Nanometer distance measurements in RNA using site-directed spin labeling. Biophys J. 2007;93:2110–2117. doi: 10.1529/biophysj.107.109439. [DOI] [PMC free article] [PubMed] [Google Scholar]
- 26.Makinen MW, Mustafi D, Kasa S. ENDOR of spin labels for structure determination: from small molecules to enzyme reaction intermediates. In: Berliner LJ, editor. Biological Magnetic Resonance. Springer-Verlag; New York, LLC: 1998. pp. 181–249. [Google Scholar]
- 27.Qin PZ, Butcher SE, Feigon J, Hubbell WL. Quantitative analysis of the isolated GAAA tetraloop/receptor interaction in solution: a site-directed spin labeling study. Biochemistry. 2001;40:6929–6936. doi: 10.1021/bi010294g. [DOI] [PubMed] [Google Scholar]
- 28.Pannier M, Veit S, Godt A, Jeschke G, Spiess HW. Dead-time free measurement of dipole-dipole interactions between electron spins. J Magn Reson. 2000;142:331–340. doi: 10.1006/jmre.1999.1944. [DOI] [PubMed] [Google Scholar]
- 29.Price EA, Sutch BT, Cai Q, Qin PZ, Haworth IS. Computation of nitroxidenitroxide distances for spin-labeled DNA duplexes. Biopolymers. 2007;87:40–50. doi: 10.1002/bip.20769. [DOI] [PMC free article] [PubMed] [Google Scholar]
- 30.Spaltenstein A, Robinson BH, Hopkins PB. Sequence- and structuredependent DNA base dynamics: synthesis, structure, and dynamics of site and sequence specifically spin-labeled DNA. Biochemistry. 1989;28:9484–9495. doi: 10.1021/bi00450a036. [DOI] [PubMed] [Google Scholar]
- 31.Edwards TE, Okonogi TM, Robinson BH, Sigurdsson ST. Site-specific incorporation of nitroxide spin-labels into internal sites of the TAR RNA; structure-dependent dynamics of RNA by EPR spectroscopy. J Am Chem Soc. 2001;123:1527–1528. doi: 10.1021/ja005649i. [DOI] [PubMed] [Google Scholar]
- 32.Qin PZ, Hideg K, Feigon J, Hubbell WL. Monitoring RNA base structure and dynamics using site-directed spin labeling. Biochemistry. 2003;42:6772–6783. doi: 10.1021/bi027222p. [DOI] [PubMed] [Google Scholar]
- 33.Gannett PM, et al. Probing triplex formation by EPR spectroscopy using a newly synthesized spin label for oligonucleotides. Nucleic Acids Res. 2002;30:5328–5337. doi: 10.1093/nar/gkf634. [DOI] [PMC free article] [PubMed] [Google Scholar]
- 34.Barhate N, Cekan P, Massey AP, Sigurdsson ST. A nucleoside that contains a rigid nitroxide spin label: a fluorophore in disguise. Angew Chem Int Ed Engl. 2007;46:2655–2658. doi: 10.1002/anie.200603993. [DOI] [PubMed] [Google Scholar]
- 35.Milov AD, Salikohov KM, Shirov MD. Applications of ENDOR in electron-spin echo for paramagnetic center space distribution in solids. Fiz Tverd Tela. 1981;23:975–982. [Google Scholar]
- 36.Kurshev VV, Raitsimring AM, Tsvetkov YD. Selection of dipolar interaction by the ‘‘2 + 1’’ pulse train ESE. J Magn Reson. 1989;81:441–454. [Google Scholar]
- 37.Milov AD, Ponomarev AB, Tsvetkov YD. Electron-electron double resonance in electron spin echo: model biradical systems and the sensitized photolysis of decalin. Chem Phys Lett. 1984;110:67–72. [Google Scholar]
- 38.Larsen RG, Singel DJ. Double electron—electron resonance spin—echo modulation: Spectroscopic measurement of electron spin pair separations in orientationally disordered solids. J Chem Phys. 1993;98:5134–5146. [Google Scholar]
- 39.Rakowsky MH, More KM, Kulikov AV, Eaton GR, Eaton SS. Time-domain electron paramagnetic resonance as a probe of electron-electron spin-spin interaction in spin-labeled low-spin iron porphyrins. J Am Chem Soc. 1995;117:2049–2057. [Google Scholar]
- 40.Saxena S, Freed JH. Double quantum two-dimensional Fourier transform electron spin resonance: distance measurements. Chem Phys Lett. 1996;251:102–110. [Google Scholar]
- 41.Martin RE, et al. Determination of end-to-end distances in a series of TEMPO diradicals of up to 2.8 nm length with a new four-pulse double electron electron resonance experiment. Angew Chem Int Ed Engl. 1998;37:2833–2837. doi: 10.1002/(SICI)1521-3773(19981102)37:20<2833::AID-ANIE2833>3.0.CO;2-7. [DOI] [PubMed] [Google Scholar]
- 42.Hinderberger D, Schmelz O, Rehahn M, Jeschke G. Electrostatic site attachment of divalent counterions to rodlike ruthenium(II) coordination polymers characterized by EPR spectroscopy. Angew Chem Int Ed Engl. 2004;43:4616–4621. doi: 10.1002/anie.200460500. [DOI] [PubMed] [Google Scholar]
- 43.Pornsuwan S, Bird G, Schafmeister CE, Saxena S. Flexibility and lengths of bis-peptide nanostructures by electron spin resonance. J Am Chem Soc. 2006;128:3876–3877. doi: 10.1021/ja058143e. [DOI] [PubMed] [Google Scholar]
- 44.Jeschke G, Wegener C, Nietschke M, Jung H, Steinhoff HJ. Interresidual distance determination by four-pulse double electron-electron resonance in an integral membrane protein: the Na+/proline transporter PutP of Escherichia coli. Biophys J. 2004;86:2551–2557. doi: 10.1016/S0006-3495(04)74310-6. [DOI] [PMC free article] [PubMed] [Google Scholar]
- 45.Hanson SM, et al. Structure and function of the visual arrestin oligomer. EMBO J. 2007;26:1726–1736. doi: 10.1038/sj.emboj.7601614. [DOI] [PMC free article] [PubMed] [Google Scholar]
- 46.Oldham WM, Van Eps N, Preininger AM, Hubbell WL, Hamm HE. Mechanism of the receptor-catalyzed activation of heterotrimeric G proteins. Nat Struct Mol Biol. 2006;13:756–757. doi: 10.1038/nsmb1129. [DOI] [PubMed] [Google Scholar]
- 47.Leporc S, et al. An NMR and molecular modeling analysis of d(CTACTGCTTTAG) d(CTAAAGCAGTAG) reveals that the particular behavior of TpA steps is related to edge-to-edge contacts of their base-pairs in the major groove. Nucleic Acids Res. 1999;27:4759–4767. doi: 10.1093/nar/27.24.4759. [DOI] [PMC free article] [PubMed] [Google Scholar]
- 48.Caruthers MH, Beaton G, Wu JV, Wiesler W. Chemical synthesis of deoxyoligonucleotides and deoxyoligonucleotide analogs. In: Lilley DMJ, Dahlberg JE, editors. Methods in Enzymology. Elsevier; 1992. pp. 3–20. [DOI] [PubMed] [Google Scholar]
- 49.Usman N, Cedergren R. Exploiting the chemical synthesis of RNA. Trends Biochem Sci. 1992;17:334–339. doi: 10.1016/0968-0004(92)90306-t. [DOI] [PubMed] [Google Scholar]
- 50.Iyer RP, Phillips LR, Egan W, Regan JB, Beaucage SL. The automated synthesis of sulfur-containing oligodeoxyribonucleotides using 3H-1,2- benzodithiol-3-one 1,1-dioxide as a sulfur-transfer reagent. J Org Chem. 1990;55:4693–4699. [Google Scholar]
- 51.Hankovszky HO, Hideg K, Lex L. Nitroxyls; VII1. Synthesis and reactions of highly reactive 1-Oxyl-2,2,5,5-tetramethyl-2,5-dihydropyrrole-3-ylmethyl sulfonates. Synthesis. 1980:914–916. [Google Scholar]
- 52.Lindgren M, et al. Electron spin echo decay as a probe of aminoxyl environment in spin-labeled mutants of human carbonic anhydrase II. J Chem Soc Perkin Trans. 1997;2:2549–2554. [Google Scholar]
- 53.Zecevic A, Eaton GR, Eaton SS, Lindgren M. Dephasing of electron spin echoes for nitroxyl radicals in glassy solvents by non-methyl and methyl protons. Mol Phys. 1998;95:1255–1263. [Google Scholar]
- 54.Weber RT. Bruker ELEXSYS E580 User’s Manual (v. 2.0) 2005. [Google Scholar]
- 55.Weber RT. Bruker Pulsed ELDOR Option User’s Manual (v. 1.0) 2006. [Google Scholar]
- 56.Jeschke G, Panek G, Godt A, Bender A, Paulsen H. Data analysis procedures for pulse ELDOR measurements of broad distance distributions. Appl Magn Reson. 2004;26:223–244. [Google Scholar]
- 57.Bowman MK, Maryasov AG, Kim N, DeRose VJ. Visulation of distance distribution from pulsed double electron-electron resonance data. Appl Magn Reson. 2004;26:23–39. [Google Scholar]
- 58.Chiang YW, Borbat PP, Freed JH. The determination of pair distance distributions by pulsed ESR using Tikhonov regularization. J Magn Reson. 2005;172:279–295. doi: 10.1016/j.jmr.2004.10.012. [DOI] [PubMed] [Google Scholar]
- 59.Berman HM, et al. The Protein Data Bank. Nucleic Acids Res. 2000;28:235–242. doi: 10.1093/nar/28.1.235. [DOI] [PMC free article] [PubMed] [Google Scholar]
- 60.Berman HM, et al. The nucleic acid database. A comprehensive relational database of three-dimensional structures of nucleic acids. Biophys J. 1992;63:751–759. doi: 10.1016/S0006-3495(92)81649-1. [DOI] [PMC free article] [PubMed] [Google Scholar]
- 61.Case DA, et al. AMBER8 Users’ Manual. University of California; San Francisco, California: 2004. [Google Scholar]