

Abstract
Nanometer distances in nucleic acids can be measured by EPR using two 1-oxyl-2,2,5,5-tetramethylpyrroline radicals, with each label attached via a methylene group to a phosphorothioate-substituted backbone position as one of two phosphorothioate diastereomers (RP and SP). Correlating the internitroxide distance to the geometry of the parent molecule requires computational analysis of the label conformers. Here, we report sixteen 4-ns MD simulations on a DNA duplex d(CTACTGCTTTAG).d(CTAAAGCAGTAG) with label pairs at C7/C19, T5/A17, and T2/T14, respectively. For each labeled duplex, four simulations were performed with SP/SP, RP/RP, SP/RP, and RP/SP labels, with initial all trans label conformations. Another set of four simulations was performed for the 7/19-labeled duplex using a different label starting conformation. The average internitroxide distance 〈 rMD〉 was within 0.2 Å for the two sets of simulations for the 7/19-labeled duplex, indicating sufficient sampling of conformational space. For all three labeled duplexes studied, 〈 rMD〉 agreed with experimental values, as well as with average distances obtained from an efficient conformer search algorithm (NASNOX). The simulations also showed that the labels have conformational preferences determined by the linker chemistry and label–DNA interactions. These results establish computational algorithms that allow use of the 1-oxyl-2,2,5,5-tetramethylpyrroline label for mapping global structures of nucleic acids.
Keywords: nucleic acid, nitroxide, molecular dynamics (MD), distance measurement, conformation
INTRODUCTION
Site-directed spin-labeling (SDSL) is used to derive local structural and dynamic information on a macromolecule via electron paramagnetic resonance (EPR) spectroscopy measurements of a stable nitroxide radical attached in a site-specific manner. SDSL has been established for analysis of proteins, especially in systems that are difficult to examine using methods such as X-ray crystallography or NMR spectroscopy,1–4 and has also been applied to study nucleic acids at the level of individual nucleotides.5–13 Currently, SDSL gives two main categories of information: the dynamics (rotational motion) of a singly attached nitroxide, which reports on the structure and dynamics of the labeled site; and the interspin distance between a pair of nitroxides, which provides direct structural data. Advances in pulse EPR techniques have enabled measurement of distances of up to ~70 Å 1,2,14; therefore, SDSL distance measurements may allow unrestricted mapping of proteins and nucleic acids.
Successful implementation of SDSL requires correlation of EPR measurements of the unpaired electron to structural and dynamic features at the site of interest of the macromolecule. In most cases, this site is designated by the attachment point for the nitroxide. However, since the nitroxide is an external molecular probe that is covalently attached to the macromolecule via a set of chemical bonds (i.e., a linker), the attachment point is spatially distinct from the location of the unpaired electron. Therefore, establishing the correlation between EPR-measured interspin distances (i.e., between the nitrogen atoms of the respective nitroxides) and the distances between the attachment points on the macromolecule requires a method to access the ensemble of linker-nitroxide label conformers at a specific site. In protein SDSL, the most common labeling scheme is to attach a radical, 1-oxyl-2,2,5,5-tetramethylpyrroline (R), to an engineered cysteine via a R—C—S—S—Cβ linkage; structures of proteins carrying such nitroxides have been obtained crystallographically for lysozyme15 and thrombin.16 Solution ensembles of linker-nitroxide conformations have been studied using simulation techniques17–22; for example, Sale et al.17,18 have shown that a combination of Monte Carlo conformational searching and brief MD simulations on identified low energy conformers can be used to compute theoretical distances in good agreement with experimental data.18
Several groups have reported SDSL distance measurements in nucleic acids utilizing nitroxides attached via different chemical linkers.5,7,8,23–25 In one approach, the radical R group is attached via a rigid R—C ≡ C—Cx linkage to a specific base atom (Cx), as first reported by Spaltenstein et al. at C5 of uridine.26 Distances measured between such nitroxide labels have been shown to match theoretical interspin distances obtained using solvated MD simulations of the labeled nucleic acids.8,25 With this type of nitroxide label, the rigid triple bond allows only very restricted nitroxide spatial motion, which is advantageous for correlating interspin label distances to those of the parent molecule. However, such labels require elaborate chemical syntheses with adjustments according to the identity of the base being labeled, and the rigidity of the linker may cause structural deviation, even in a simple DNA helix.21 Another nitroxide labeling scheme for nanometer distance measurements in DNA and RNA utilizes a simple methodology to attach the radical group (R) via a flexible R—C—S—P linkage to a phosphorothioate that is chemically substituted at a specific backbone position.5,27 This nitroxide label, which is typically designated as R5, can be attached to arbitrary nucleic acid sequences, thus enabling nitroxide “scanning” for global structure determination.5 However, because the R5 probe is attached via three rotatable single bonds in either one of two phosphorothioate diastereomers (Rp and Sp) that are introduced in a ~50/50 ratio during synthesis of the labeled nucleic acids, a large ensemble of R5 conformations may be present at a given labeling site.
The R5 conformational and chiral variability is challenging for theoretical prediction of interspin distances. However, we have shown that an efficient conformer-search algorithm can give distances between a pair of R5 labels that are consistent with experimental values.5 Here, we describe a modified version of this algorithm and compare the results with corresponding distance information derived from all atom MD simulations. Despite the flexibility that is inherent in the R5 label, the simulation data show that R5 has strong conformational preferences that are determined by the chemical nature of the linker and by favorable and unfavorable interactions of the label with the DNA; this is in contrast to the view of the probe as a freely rotating moiety. These results are reproduced by the conformer-search algorithm, thus setting a firm foundation for utilizing this algorithm (which we refer to as NASNOX) to predict interspin distances between a pair of R5 labels.
RESULTS
Internitroxide Distances from Molecular Dynamics and the Conformer-Search Algorithm
MD simulations and conformer-search calculations were performed on the DNA duplex d(CTACTGCTTTAG).d(C-TAAAGCAGTAG) (Figure 1) carrying two R5-labeled phosphorothioates (Figure 2) at positions 7 and 19, 5 and 17, and 2 and 14. Conformer distributions for spin labels computed using the NASNOX conformer-search are shown for the three labeled duplexes in Figure 3, with the RP and SP distributions in green and red, respectively. The internitroxide distance between the labels at positions 5 and 17 is likely to be shorter than that between the labels at positions 7 and 19, despite the location of these bases in the duplex (Figure 1). The conformer ensembles were used to calculate internitroxide (N—N) distances for each combination of RP and SP labels for each labeled duplex (Table I). As we have shown previously,5 calculation of these distances based on a conformer search and a rigid DNA duplex gives good agreement with internitroxide distances determined experimentally (Table I).
FIGURE 1.
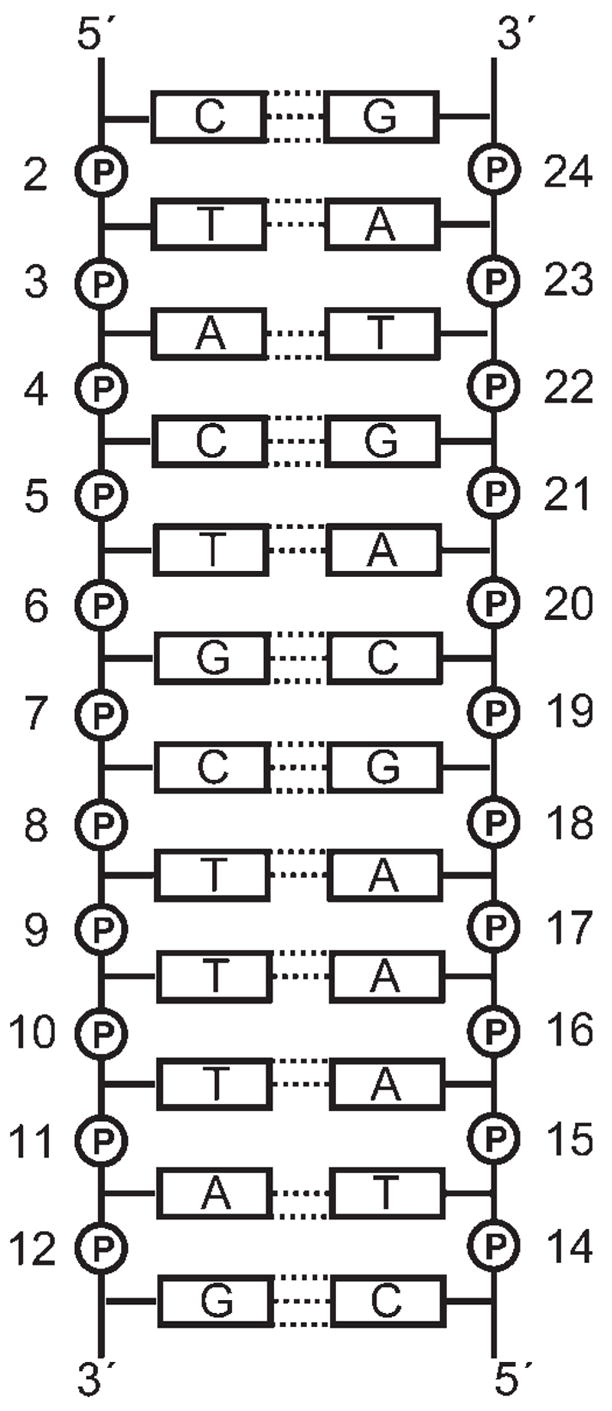
The DNA duplex used in the calculations, showing the numbering of each nucleotide.
FIGURE 2.
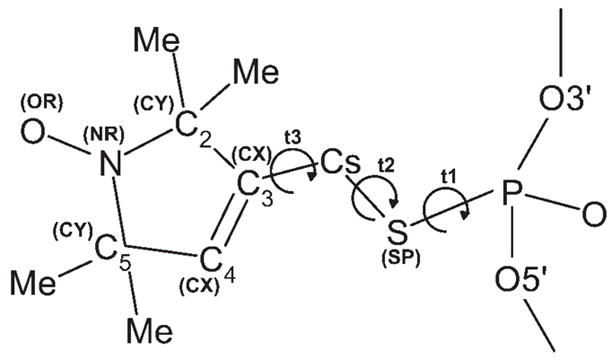
Structure of the phosphorothioate-substituted nitroxide spin label. Symbols in parentheses indicate the nonstandard atom types used in the AMBER force field parameterization (see Table S1 in the Supplementary Data). The variable torsional angles in the linker between the label and the phosphorothioate in the DNA are defined as t1 (O5′—P —S —Cs), t2 (P —S —Cs —C3), and t3 (S —Cs —C3 —C2).
FIGURE 3.

NASNOX conformer distributions for duplexes carrying labels at (a) positions 7 and 19, (b) positions 5 and 17, and (c) positions 2 and 14. Distributions for RP and SP labels are shown in green and red, respectively.
Table I.
Internitroxide (N–N) Distances Calculated from Molecular Dynamics (MD) Simulationsa,b and Using a Conformer-Search Algorithm (NASNOX)
| Duplex Labels | Label 1 | Label 2 | Simulation No. | N–N (Å ) MD | N–N (Å )NASNOX | N–N (Å )〈 rMD〉 | N–N (Å ) 〈rNASNOX〉 | N–N (Å 〈rEXPT〉c |
|---|---|---|---|---|---|---|---|---|
| 7–19 | 7-SP | 19-SP | 1 | 27.2 | 25.6 | |||
| 5 | 27.1 | |||||||
| 7-RP | 19-RP | 2 | 25.1 | 24.8 | 26.3d | 25.4 | 25.6 | |
| 6 | 26.0 | |||||||
| 7-SP | 19-RP | 3 | 27.1 | 25.5 | ||||
| 7 | 27.2 | |||||||
| 7-RP | 19-SP | 4 | 25.5 | 25.2 | ||||
| 8 | 25.3 | |||||||
|
| ||||||||
| 5–17 | 5-SP | 17-SP | 9 | 27.9 | 27.0 | 22.5 | 21.9 | 21.2 |
| 5-RP | 17-RP | 10 | 18.5 | 15.3 | ||||
| 5-SP | 17-RP | 11 | 21.2 | 21.3 | ||||
| 5-RP | 17-SP | 12 | 22.2 | 21.0 | ||||
|
| ||||||||
| 2–14 | 2-SP | 14-SP | 13 | 39.5 | 39.6 | 37.4 | 36.4 | 38.8 |
| 2-RP | 14-RP | 14 | 34.6 | 32.1 | ||||
| 2-SP | 14-RP | 15 | 38.0 | 35.2 | ||||
| 2-RP | 14-SP | 16 | 37.4 | 36.8 | ||||
Simulation nos. 1–4 and nos. 9–16 had a starting geometry based on 1CS2 (model 1) with both labels having t1 = t2 = t3 = 180°(for definitions of t1, t2, and t3, see Figure 2).
Simulation nos. 5–8 had a starting geometry based on 1CS2 (model 1) and labels with t1 = 60°(SP) or −60°(RP), t2 = 180°, and t3 = 0°.
Experimental values from Ref. (5). The errors in the measured mean distances are 5%.
An average of 26.2 Å (simulation nos. 1–4) and 26.4 Å (simulation nos. 5–8).
To examine the label mobility in detail and to assess the importance of flexibility of the nucleic acid in computing the internitroxide distances, we performed a series of MD simulations on the same labeled duplexes (Table I). Simulations were performed for duplexes containing labels at positions 7 and 19 (7/19, simulation nos. 1–8), positions 5 and 17 (5/17, simulation nos. 9–12), and positions 2 and 14 (2/14, simulation nos. 13–16) (Table I). All simulations used the 1CS2 NMR structure (model 1) as the starting duplex. For each doubly labeled 1CS2 duplex, separate simulations were run with two SP phosphorothioate chiral centers (SP/SP; nos. 1, 5, 9, and 13); two RP centers (RP/RP; nos. 2, 6, 10, and 14); with an SP center in strand 1 and an RP center in strand 2 (SP/RP; nos. 3, 7, 11, and 15); and with an RP center in strand 1 and an SP center in strand 2 (RP/SP; nos. 4, 8, 12, and 16). Data were collected at 0.2-ps intervals over 4 ns (following a 0.2 ns period of equilibration period), giving a total of 20,000 structures per simulation.
To examine the effect of the starting conformation of the linker on the calculated N—N distance, simulations for the 7/19-labeled duplex were performed using two different starting conformations for the labels: t1 = t2 = t3 = 180° (Table I, nos. 1–4); and t1 = 60° (SP) or −60° (RP), t2 = 180°, and t3 = 0° (Table I, nos. 5–8). Averaging of data over 4 ns gave internitroxide distances within 0.2 Å for three of the four pairs of similarly labeled duplexes (i.e., simulation no. 1/no. 5, no. 3/no. 7, and no. 4/no. 8, Table I), and the difference in the N—N distance for the fourth pair (no. 2/no. 6) is within 1 Å. This suggests that running the simulation for 4 ns is sufficient to determine N—N distances that are independent of the starting conformation of the label. Therefore, simulations with labels at the 5/17 and 2/14 positions were started with conformations of t1 = t2 = t3 = 180° only.
The internitroxide distances calculated over 4 ns for each set of four simulations were combined (80,000 structures) to give an overall N—N distance (〈rMD〉) for a given labeled duplex (this is necessary, since the experimental data represent a combination of data from a racemic mixture of RP and SP labels at each position5). Combination of the data for simulation nos. 1–4 gave 〈rMD〉 as 26.2 Å and a similar calculation for nos. 5–8 gave 〈rMD〉 as 26.4 Å: this again indicates the insignificance of the label starting conformation and 〈rMD〉 is shown as an average of 26.3 Å for the 7/19-labeled duplex in Table I. This is in good agreement with the experimentally determined value of 25.6 Å (Table I).
The overall N—N distances from MD simulations and the NASNOX (〈rNASNOX〉) conformer-search algorithm are also in good agreement. The MD simulations generally give a slightly longer N—N distance, perhaps because of the additional DNA flexibility. In this context, it is of note that the fit to the experimental data for the 2/14-labeled duplex is better for the MD simulations, since these labels are close to the duplex termini, at which greater flexibility of the duplex is likely (see below). For the 7/19- and 5/17-labeled duplexes, the agreement with the experimental data is similar for 〈rMD〉 and hrNASNOXi (Table I).
Ensemble of Internitroxide Distances from Molecular Dynamics Simulations
The width of the distance distribution for each simulation and NASNOX conformer search, and the corresponding overall and experimental values, are given in Table S3 (Supplementary Data) as the standard deviation for each ensemble. N—N distances in simulation nos. 1, 9, and 13 (all SP/SP pairs) are shown in Figure 4 and the corresponding P—P distances (distances between the phosphorus atoms of the phosphorothioates) are shown in Figure 5. These data are representative of those for other simulations. For the 7/19-labeled duplex (simulation no. 1), only small changes in the N—N distance were observed (Figure 4a) and the P—P distance is confined between 17 and 19 Å (Figure 5a). This behavior and the relatively similar internitroxide distances for the SP/SP, RP/RP, SP/RP, and RP/SP combinations (Table I, Figure 3) for the 7/19-labeled duplex account for the narrow distance distribution observed experimentally (Table S3).
FIGURE 4.
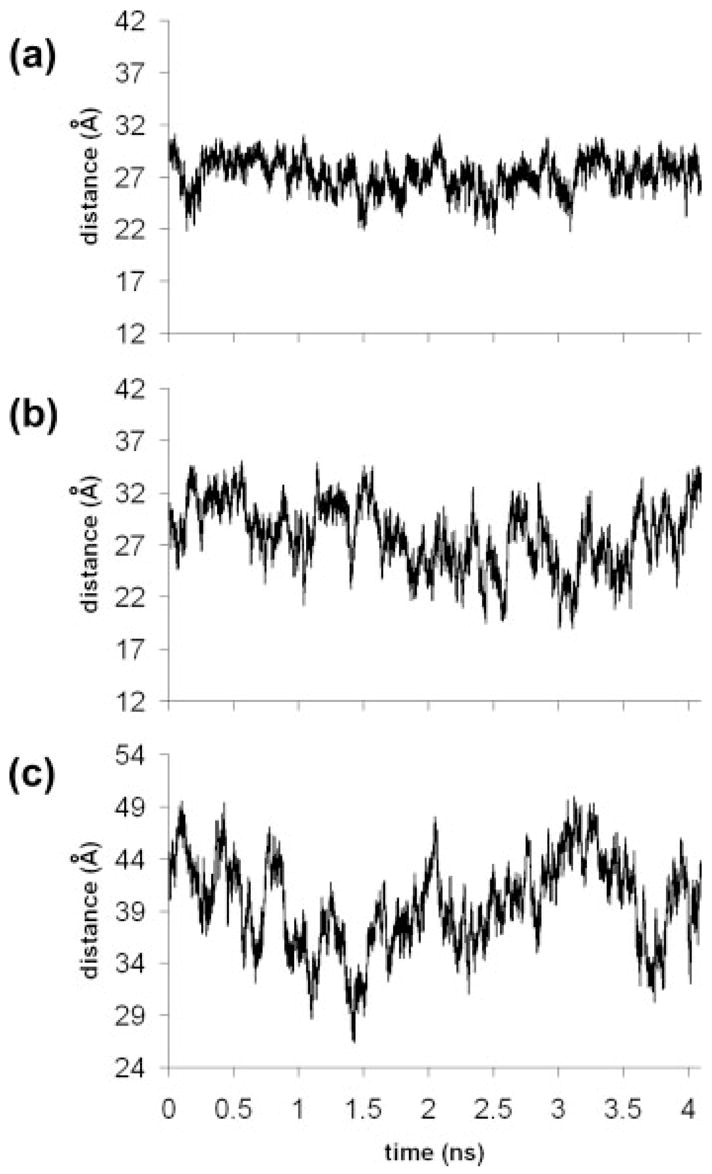
Internitroxide (N—N) distances over 4.2 ns from simulations of duplexes carry two SP labels: (a) 7/19-labeled duplex (simulation no. 1), (b) 5/17-labeled duplex (simulation no. 9), and (c) 2/14-labeled duplex (simulation no. 13).
FIGURE 5.

Interphosphorothioate (phosphorus) distances (P—P) over 4.2 ns from simulations of duplexes carry two SP labels: (a) 7/19-labeled duplex (simulation no. 1), (b) 5/17-labeled duplex (simulation no. 9), and (c) 2/14-labeled duplex (simulation no. 13).
In contrast, the P—P distances in the 2/14-labeled duplex (Figure 5c) are between 30 and 42 Å over the simulation, consistent with significant mobility at the DNA ends. The N—N distance in the 2/14-labeled duplex (Figure 4c) fluctuates between 29 and 49 Å, and a comparison of Figures 4c and 5c indicates that most of this motion is due to DNA flexibility, rather than internal motion of the labels, since the patterns in Figures 4c and 5c are similar. Therefore, the wide distribution found experimentally for the 2/14-labeled duplex (Table S3) is largely due to the motion of the DNA, and the experimental and theoretical distributions are in good agreement. For the 5/17-labeled duplex, the MD simulations and NASNOX give similar theoretical N—N distance distributions, but neither fit well with that reported experimentally (Table S3). However, two of the simulations of the 5/17-labeled duplex (nos. 10 and 11, Table I) give 〈rMD〉 at the lower limit of experimentally measurable distances.5 This may account for the deviation between the measured and computed distance distribution profile.
Conformer Distributions from Molecular Dynamics Simulations
The spin label at an RP center is oriented somewhat toward the DNA major groove, whereas that at an SP center is oriented more toward the minor groove of the duplex (Figure 6). This difference in orientation has a significant effect on the favored conformational space of the label in the respective diastereoisomers. The conformer distribution around the t1 torsion angle (Figure 2) for each label in each simulation is shown in Table II. The conformer locations are illustrated in Figure 6 (which shows the label at position 7, but the general conformer orientations are similar at all positions). The RP t1 gauche+ conformer (in pink in Figure 6a) is oriented into the major groove, whereas the RP t1 trans and t1 gauche− conformers are generally oriented away from the duplex. In contrast, the SP t1 gauche− conformer (in blue in Figure 6b) is oriented toward the minor groove, and the RP t1 trans and t1 gauche+ conformers are oriented away from the duplex.
FIGURE 6.

Conformer locations for spin labels on the DNA duplex: (a) RP labels with t1 torsional angles in the gauche+ (pink, + 60°), trans (green, 180°), and gauche2 (blue, 260°) positions, with t2 = t3 = 180°. (b) SP labels with t1 torsional angles in the gauche+ (pink, +60°), trans (green, 180°), and gauche+ (blue, − 60°) positions, with t2 = t3 = 180°. The structures show labels at position 7, but the conformer locations (but not necessarily the distributions) are the same at each position of the duplex.
Table II.
Conformer Distributions Around t1 in Molecular Dynamics Simulations (Each of 4 ns) of Spin-Labeled Phosphorothioate-Modified d(CTACTGCTTTAG).d(CTAAAGCAGTAG) Duplexes
| t1 Distribution (%)
|
t1 Distribution (%)
|
|||||||
|---|---|---|---|---|---|---|---|---|
| Simulation No.a | Label 1 | +60 | 180 | −60 | Label 2 | +60 | 180 | −60 |
| 1 | 7-SP | 17.3 | 77.1 | 5.6 | 19-SP | 54.4 | 43.8 | 1.7 |
| 2 | 7-RP | 32.5 | 36.6 | 30.9 | 19-RP | 20.3 | 36.5 | 43.3 |
| 3 | 7-SP | 46.5 | 52.6 | 0.9 | 19-RP | 0.0 | 37.8 | 62.2 |
| 4 | 7-RP | 39.1 | 17.2 | 43.7 | 19-SP | 50.2 | 49.6 | 0.2 |
| 5b | 7-SP | 55.2 | 40.0 | 4.8 | 19-SP | 45.4 | 52.5 | 2.1 |
| 6b | 7-RP | 26.9 | 27.7 | 45.4 | 19-RP | 0.7 | 21.8 | 77.5 |
| 7b | 7-SP | 62.1 | 37.2 | 0.7 | 19-RP | 0.0 | 66.4 | 33.6 |
| 8b | 7-RP | 26.3 | 18.6 | 55.1 | 19-SP | 57.8 | 41.8 | 0.4 |
| 9 | 5-SP | 68.1 | 28.8 | 3.1 | 17-SP | 58.4 | 40.3 | 1.3 |
| 10 | 5-RP | 0.0 | 17.3 | 82.7 | 17-RP | 15.8 | 18.9 | 65.3 |
| 11 | 5-SP | 53.2 | 46.7 | 0.1 | 17-RP | 2.5 | 18.0 | 79.6 |
| 12 | 5-RP | 0.2 | 33.4 | 66.4 | 17-SP | 15.0 | 83.6 | 1.5 |
| 13 | 2-SP | 64.3 | 33.8 | 2.0 | 14-SP | 25.4 | 72.6 | 2.1 |
| 14 | 2-RP | 0.1 | 13.9 | 86.0 | 14-RP | 0.0 | 55.3 | 44.7 |
| 15 | 2-SP | 31.7 | 27.8 | 40.5 | 14-RP | 4.7 | 30.7 | 64.6 |
| 16 | 2-RP | 0.2 | 38.6 | 61.1 | 14-SP | 38.9 | 60.7 | 0.4 |
Simulation nos. 1–4 and nos. 9–16 had a starting geometry based on 1CS2 (model 1) with both labels having t1 = t2 = t3 = 180°(for definitions of t1, t2, and t3, see Figure 2).
Simulation nos. 5–8 had a starting geometry based on 1CS2 (model 1) and labels with t1 = 60°(SP) or − 60°(RP), t2 = 180°, and t3 = 0°.
For RP labels, the conformer distributions differ from position to position on the duplex. The RP labels at positions 19 (simulation nos. 2, 3, 6, and 7), 5 (nos. 10 and 12), 17 (nos. 10 and 11), 2 (nos. 14 and 16), and 14 (nos. 14 and 15) have an average gauche+:trans:gauche+ conformer distribution of 3.7%:32.4%:63.9%. Some RP t1 gauche+ conformers are observed for the 19-RP label in simulation no. 2 and the 17-RP label in simulation no. 10, but in general the gauche+ conformer (oriented into the major groove, Figure 6a) is unfavorable. In contrast, for 7-RP labels (simulation nos. 2, 4, 6, and 8) the average gauche+:trans:gauche− distribution is 31.2%:25.0%:43.8%, indicating approximately equal occupancy of the three positions. We return to these data in the next section.
For the SP labels, an average gauche+:trans:gauche− conformer distribution of 46.5%:49.3%:4.2% was calculated over all simulations (Table II). In the SP t1 gauche− conformation, the methylene group of the linker clashes with the C5′ position on the labeled nucleotide, which reduces occupancy of this conformation. Substantial occupancy of the SP t1 gauche− conformation occurred only for the 2-SP label. In contrast, the SP t1 gauche+ and t1 trans conformers (pink and green, respectively, in Figure 6b) are oriented away from the duplex DNA and showed about equal occupancy over all simulations.
For the t2 torsional angle (Supplementary Table S4), the RP and SP gauche+:trans:gauche− distributions averaged over the 16 simulations were 25.5%:62.6%:11.9% and 13.7%:61.5%:24.9%, respectively. The averages reflect the mirror symmetry of the two diastereoisomers, but the main driving force for the t2 torsional angle position seems to be orientation of the label away from the DNA duplex (achieved with t2 in a trans conformation). The motions of the t2 and t3 torsions are not strongly correlated with each other or with the t1 conformation, as illustrated in Figures 7 and 8.
FIGURE 7.

Torsional motion over 4.2 ns for an RP label: (a) torsion t1, (b) torsion t2, and (c) torsion t3. Data are shown for the 2-RP label in simulation no. 16. These data are typical of motion for all RP labels except those at position 7.
FIGURE 8.

Torsional motion over 4.2 ns for a 7-SP label: (a) torsion t1, (b) torsion t2, and (c) torsion t3. Data are shown for the 7-SP label in simulation no. 3. These data are typical of motion for all SP labels.
Motion of a typical RP label (excluding RP labels at position 7, see below) is shown in Figure 7; these data are for the 2-RP label in simulation no. 16. For torsion t1, the trans and gauche− conformers are both occupied (Figure 7a), whereas torsion t2 mainly occupies a trans conformation with occasional deviations into other conformational space (Figure 7b). Motion around torsion t3 is rapid and variable, and over 600° of conformational space is mapped by this torsional angle in 4 ns (Figure 7c). Typical motion of an SP label at any position on the duplex is shown in Figure 8; these data are for the 7-SP label in simulation no. 3. Torsion t1 adopts trans and gauche+ conformations (Figure 8a), torsion t2 is mainly in the trans position (Figure 8b), and torsion t3 is variable (Figure 8c), although for this particular label the t3 motion is restricted to the initial 360° of conformational space (however, t3 for other SP labels behaved similarly to t3 for the RP label in Figure 7c).
Sequence Dependence of Conformer Distributions for RP Labels
The conformational behavior of 7-RP labels (simulations nos. 2, 4, 6, and 8, Table II) indicated approximately equal occupancy of the gauche+, trans and gauche− positions around the P—S torsion angle, t1. In contrast, RP labels at other positions rarely adopted the gauche+ position: labels at positions 2, 5, and 14 showed almost zero occupancy of this conformation, and labels at positions 17 and 19 showed limited occupancy (Table II). As shown in Figure 6a, the RP t1 gauche+ conformer is oriented into the major groove. For the label at position 7, the base to the 3′ side of the labeled nucleotide is a thymine and the hydrophobic 5-methyl group of this base (base 8 in Figure 6a) can interact favorably with the hydrophobic spin label and stabilize the t1 gauche+ conformer, as shown in Figure 9 (data for the 7-RP label in simulation no. 2). The distance from the center of the tetramethylpyrroline ring to the carbon atom of the T8 methyl group is about 5 Å (a good hydrophobic contact) when the t1 torsion angle is in a gauche+ conformation (Figure 9). This interaction can apparently be maintained briefly with a t1 gauche− conformer (Figure 9), but is generally lost when the RP label adopts a t1 trans or gauche− conformation around torsion angle t1 (Figure 9).
FIGURE 9.
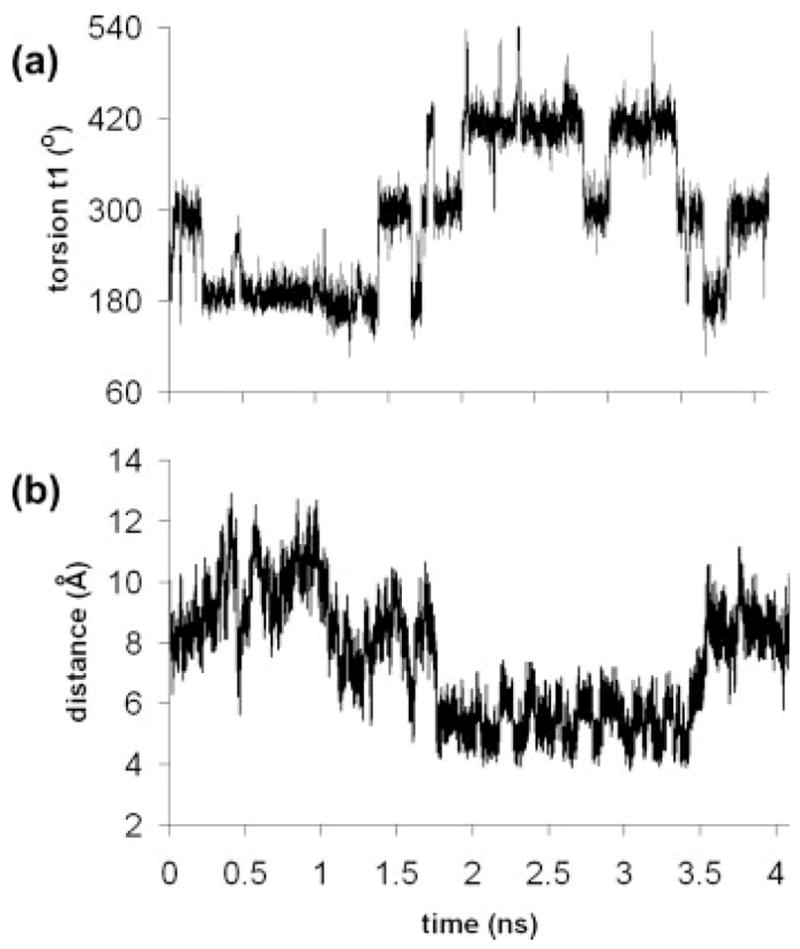
Torsional motion and distance data over 4.2 ns for the 7-RP label in simulation no. 2: (a) torsion t1, and (b) the distance from the center of the tetramethylpyrroline ring of the spin label and the methyl group (C atom) of the thymine at position 8.
The 2, 5, and 14 positions are labeled thymine nucleotides and it is likely that steric hindrance due to the methyl group of the labeled nucleotide prevents the RP label from entering the major groove, thereby making the t1 gauche+ conformer very unfavorable. Positions 17 and 19 are not thymine nucleotides, but they do not have a thymine base to the 3′ side; therefore, the t1 gauche+ conformer at these positions is not sterically prohibited, but it is not stabilized by hydrophobic interactions with a 3′ thymine, accounting for the intermediate occupancy of this conformation. Therefore, the simulations suggest that an RP label at a d(P “notT”-T) dinucleotide (where P indicates the phosphorothioate) is likely to adopt t1 gauche+, trans, and gauche− conformers in about equal proportions. In contrast, an RP label at a d(PT-N) site will not adopt a gauche+ conformation and a label at a d(P “notT”-“notT”) will do so only to a limited extent.
DISCUSSION
MD simulations are commonly used to derive conformational data from complex biological systems and here we have shown that such simulations are useful for derivation of internitroxide distances in spin-labeled nucleic acids. In fitting to experimental data, a correct assessment of conformational variability is particularly important for a spin label with a flexible linker chain. The N—N distances calculated from the simulated conformer ensembles were in good agreement with experimental data, indicating that the derived force field parameters provide a good representation of the chemistry of the R5 label.
The main drawback of using MD as a tool for simulating internitroxide distances is the substantial computational resources required for carrying out simulations that sufficiently cover the conformational space of the label. For the R5 label, this is compounded by the requirement for four simulations with different combinations of RP and SP labels. In the DNA duplex used in the current work, this is not a major problem; each 4.2-ns simulation required the order of 4 days running time on four parallel processors (relatively modest computer power). However, the goal of the SDSL method is not to examine known nucleic acid structures, but rather to determine conformational information for unknown folds. This approach requires systematic generation of potential folds and the subsequent computation of internitroxide distances for multiple paired positions for comparison with experimental data. Even for a relatively simple DNA- or RNA-fold (for example, a three-way junction), the number of potential conformations is high, and more complex folds will have thousands of potential conformers. Therefore, performance of MD simulations for multiple spin-label pairs and multiple nucleic acid conformers has some associated difficulties and an alternative approach would be useful.
The NASNOX algorithm allows rapid computation of internitroxide distances (from seconds to minutes on a standard desktop PC). The success of NASNOX is rooted in the notion that a discrete search of the t1, t2, and t3 torsion angles is sufficient for identifying allowable R5 conformers. This is justified by the results reported here, as simulations show that R5 has strong conformational preferences that are determined by the chemical nature of the linker and interactions of the label with the DNA. Consequently, MD simulations and NASNOX yield similar average N—N distances, and both match those determined experimentally. The use of a backbone label may be advantageous in SDSL for complex nucleic acid folds, since it is likely that some backbone positions will be unimportant for the fold stability. However, the flexibility of the label makes simulation of the theoretical internitroxide distances more challenging, but we believe that the NASNOX approach largely overcomes this difficulty.
The MD simulations provide insights into the conformational behavior of the spin labels that will allow further improvement of the NASNOX algorithm. The current version of NASNOX is based purely on steric contacts used to eliminate disallowed conformers. However, the proposed hydrophobic contacts between the label and the thymine base to the 3′ side may skew the conformer distribution in a manner that is currently unrepresented in NASNOX. We note that we do not exactly reproduce this behavior in the current version of NASNOX and modification of the algorithm to reflect certain physical forces between the label and the nucleic acid may further improve the agreement with experimental data, without a major increase in computational effort. NASNOX has been successfully implemented for both DNA5 and RNA,28 and we believe that further refinement will make the algorithm into an essential component in the SDSL methodology for mapping global structures of nucleic acids.
METHODS
Calculation Sets and Structure Building for Molecular Dynamics Simulations
The numbering of the DNA duplex d(CTACTGCTTTAG).d(C-TAAAGCAGTAG) is shown in Figure 1 and the atom names for the R5 label and phosphorothioate are given in Figure 2. A structure of the duplex has been determined using NMR spectroscopy (PDB ID: 1CS2).29 Input structures were built based on Model 1 of 1CS2.PDB, using the NASNOX algorithm within the framework of the program NASDAC 1.130 (Price, E.A. and Haworth, I.S., unpublished); this algorithm is described later in the Methods. The oxygen atom (OA or OB) at each label position was substituted by a sulfur atom (with a P—S bond of 1.99 Å ), but otherwise the experimental geometry of the duplex was retained. Each structure included two R5 labels as RP or SP diastereoisomers at different positions on opposite strands of the duplex. Labels were attached at positions 7 and 19 (simulation nos. 1–4 and nos. 5–8), 5 and 17 (simulation nos. 9–12), and 2 and 14 (simulation nos. 13–16). Spin labels were added with t1 = t2 = t3 = 180°(see Figure 2 for the definition of torsional angles t1, t2, and t3) for all simulations except nos. 5–8 (see footnote to Table I). The sets of calculations and details of the RP or SP chirality of each label are shown in Table I.
Forcefield Parameters
Atom numbering and other nomenclature used for the R5 spin label are shown in Figure 2. We have previously defined a geometry for the nitroxide label-phosphorothioate system, based on information from crystallographic and experimental sources.5 This geometry, with slight modifications (see below), was used in the NASNOX algorithm and also formed the basis of parameterization of the forcefield for the spin label. Simulations were performed using the parm94 forcefield31 implemented in AMBER832 with new parameters for the phosphorothioate-substituted nitroxide spin label (Table S1, Supplementary Data). New atom types CX, CY, NR, and OR were defined for the label (Figure 2) and parameters were assigned based on experimental geometry data (see below); by analogy with standard AMBER atom types; and with reference to previous derivations of AMBER parameters for DNA-bound nitroxide labels21 and phosphorothioate.33 Most bond and angle force constants and dihedral terms were assigned based on the equivalence of atom types CX and CY with standard parm94 AMBER types CA and CT, respectively. A few force constants were taken from previous publications, including that for the P—S bond33 and the NR—OR bond.21 Nonbonded parameters for atom types NR and OR were also taken from Darian and Gannett.21
Charges for R5-modified phosphorothioate-substituted nucleotides were calculated using the program NEMESIS, which is based on the empirical charge calculation program CHARGE.34 We used the empirical charges with guidance from earlier semiempirical calculations of charges for nitroxide labels21 and phosphorothioate33 to obtain a representative charge set. The final charges are shown in Table S2 (Supplementary Data). The sum of these charges is − 405 mE, including charges for the label itself and for atoms of the phosphorothioate (PO3S). Charges for other atoms of the phosphorothioate-substituted nucleotide and the nucleotide to the 5′ side of the phosphorothioate (in AMBER, this nucleotide contains the O3′ of the phosphorothioate) were used unaltered from standard parm94 values.31 The sum of the standard charges for the modified nucleotide [excluding P, O5′, O(phosphate), and O(replaced by S)] is − 118 mE and this sum for the nucleotide to the 5′ side of the phosphorothioate (excluding O3′ ) is − 477 mE; hence, these numbers and − 405 mE for the label (Table S2) give a total charge of − 1000 mE for the dinucleotide around the labeled phosphorothioate. We note that the charges indicate less polarization in the R5-substituted phosphorothioate than in the standard AMBER phosphodiester, similar to charges from ab initio calculations for phosphorothioate.33
Molecular Dynamics Simulations
Each double-labeled phosphorothiaote-modified duplex (Table I) was solvated in a periodic box containing TIP3P water molecules, with the box extending 12 Å from the extremes of the solute in the ±x, ±y, and ±z directions. This gave a box of approximate dimensions 60 × 60 × 75 Å 3 that contained 6000–6500 water molecules (the exact number depends on the starting structure for the simulation). The duplexes were neutralized by addition of 20 sodium ions in the tleap module of AMBER 8.0. Following minimization of the system for 1000 steps (500 steps of steepest decent, followed by 500 steps of conjugate gradient minimization), MD simulations were run on a Verari Systems computer with a Red Hat Linux 9.0 operating system, using the parallelized version of AMBER 8.0 operating on four processors. Simulations were run with a time step of 0.002 ps, a residue-based cut-off of 8 Å, and the particle-mesh Ewald method for electrostatic interactions. SHAKE was applied to all hydrogen atoms and the target pressure was 1 atm. Equilibration of the solvent molecules was achieved in an initial simulation of 5000 steps (100 ps) with position restraint of all solute atoms (except for sodium ions) with a force constant of 20 kcal mol− 1Å − 2, during which the temperature of the system was raised linearly from 0 to 298 K over the first 2500 steps (50 ps). Following the 100-ps solute-restrained period, the restraint on the solute atoms was removed and a further 100 ps of equilibration was performed at 298 K. This was followed by a 4-ns simulation for data collection, during which structures were collected every 0.2 ps. This procedure was used for the 16 simulations described in Table I. Results were visualized using VMD35 and nitroxide–nitroxide distances and other geometrical data were calculated using MOLTOOL (Haworth, I.S., unpublished).
Conformer-Search Algorithm
The conformer-search algorithm generates multiple conformers for R5 labels on phosphorothioate linkages at a given position on a DNA duplex, based on input parameters for torsion angles t1, t2, and t3 (Figure 2). This algorithm, which we refer to as NASNOX, is implemented within the NASDAC framework.30 Input structures were built based on the 1CS2 (Model 1) duplex, as described for the MD simulations.
The geometry of R5 in NASNOX is as follows (Figure 2): P—S, 1.99Å,36 Mukherjee and Bhattacharyya give this value as 2.0 Å in their AMBER parameterization of a phosphorothioate33; S —Cs, 1.83 Å, based on a phosphorylated cysteine in PDB ID: 1H9C37; Cs —C3, 1.49 Å 15; C3 —C2, 1.51 Å 38; C2 —Me, 1.52 Å 39; C2 —N, 1.49 Å 15; N —O, 1.27 Å,15 Barone et al.40 give values ranging from 1.26 to 1.28 Å for the N —O bond in the 2,2,5,5-tetramethyl-3-hydroxypyrroline-1-oxyl radical; P —S —Cs, 101.1°15; S —Cs —C3, 109.4°; Cs —C3 —C2, 123.55°(see below); C3 —C2 —N, 99.9°40; C2 —N —C5, 114.4°15; all other angles are of standard geometry. With a planar ring, these geometry values give a ring-closing C3 —C4 bond of 1.33 Å, in good agreement with experimental determination of this bond as 1.322 Å in (N-2,2,5,5-tetramethyl-1-oxo-3-pyrroline-3-carbonyl) (N,N-diisopropyl)urea41 and as 1.35 Å in 2,5-dihydropyrrole.38 The geometry parameters also give closing angles for C2 —C3 —C4 and C3 —C4 —C5 of 112.9°, and based on this angle Cs —C3 —C2 (and Cs —C3 —C4, C3 —C4 —H4, and C5 —C4 —H4) were assumed to be 123.55°; [(360 − 112.9)/2]°. Values for angles C2 —C3 —C4 and C3 —C4 —C5 have been reported as 110.2° in 2,5-dihydropyrrole38; from 103.4° to 110.2° in the 2,2,5,5-tetramethyl-3-hydroxypyrrolidine-1-oxyl radical;41 and as 112.4° by Langen et al.15 The exact values for the C2 —C3 —C4 and C3 —C4 —C5 angles are difficult to determine, since they are dependent on the planarity (as assumed here) or extent of twist of the ring.
Using NASNOX, R5 was constructed at desired positions and with the required chirality at modified phosphorothioate sites on a DNA duplex. Torsion angle C5′—O5′—P—S is set at the value in the original DNA duplex (with S substituted for O and a P—S bond length of 1.99Å ) and torsion angles t1 (O5′—P—S —Cs), t2 (P—S—Cs —C3), and t3 (S—Cs —C3 —C2) (Figure 2) are variable. With the DNA coordinates fixed, the allowable conformational space for R5 attached to Rp and Sp phosphorothioate diastereomers was identified by systematic variation of t1 in increments of 120°(60°, 180°, and − 60°), t2 in increments of 120°(60°, 180°, and −60°), and t3 in increments of 30°(12 positions, starting from 0°). A particular conformer was used in the subsequent distance calculation (see below) if no atoms of the label and the DNA came within a contact distance defined as 75% of the sum of the van der Waals radii of any two interacting atoms. For each conformer that did not meet this requirement, a fine search over the local conformational space was performed, with t1, t2, and t3 varied systematically as the original torsion angle (T) − 0.2 × increment (I); T – 0.1 × I; T; T + 0.1 × I; and T + 0.2 × I. If conformers in the fine search met the above criterion for acceptance, an average of the acceptable conformers was used in the distance calculation (this approach essentially allows some structural flexibility in the prediction).
For a given DNA duplex with R5 modeled at two locations, distances were calculated between the nitroxide nitrogen atoms for all pairs of sterically acceptable conformers for both Rp and Sp diastereomers at each site. The corresponding mean distance and standard deviation were calculated based on the ensemble of distances.
Supplementary Material
This article contains supplementary material available via the Internet at http://www.interscience.wiley.com/jpages/0006-3525/suppmat.
Acknowledgments
We are grateful for support from the USC School of Pharmacy for purchase of computer equipment.
Contract grant sponsor: NIH
Contract grant number: R01 GM59297
Contract grant sponsor: NIGMS
Contract grant number: R01 GM069557
References
- 1.Fanucci GE, Cafiso DS. Curr Opin Struct Biol. 2006;16:644–653. doi: 10.1016/j.sbi.2006.08.008. [DOI] [PubMed] [Google Scholar]
- 2.Borbat PP, Costa-Filho AJ, Earle KA, Moscicki JK, Freed JH. Science. 2001;291:266–269. doi: 10.1126/science.291.5502.266. [DOI] [PubMed] [Google Scholar]
- 3.Hubbell WL, Cafiso DS, Altenbach C. Nat Struct Biol. 2000;7:735–739. doi: 10.1038/78956. [DOI] [PubMed] [Google Scholar]
- 4.Fajer PG. In: In Encyclopedia of Analytical Chemistry. Meyers R, editor. Wiley; Chichester: 2000. pp. 5725–5761. [Google Scholar]
- 5.Cai Q, Kusnetzow AK, Hubbell WL, Haworth IS, Gacho GP, van Eps N, Hideg K, Chambers EJ, Qin PZ. Nucleic Acids Res. 2006;34:4722–4730. doi: 10.1093/nar/gkl546. [DOI] [PMC free article] [PubMed] [Google Scholar]
- 6.Qin PZ, Feigon J, Hubbell WL. J Mol Biol. 2005;351:1–8. doi: 10.1016/j.jmb.2005.06.007. [DOI] [PubMed] [Google Scholar]
- 7.Schiemann O, Weber A, Edwards TE, Prisner TF, Sigurdsson ST. J Am Chem Soc. 2003;125:3334–3335. doi: 10.1021/ja0274610. [DOI] [PubMed] [Google Scholar]
- 8.Schiemann O, Piton N, Mu Y, Stock G, Engels JW, Prisner TF. J Am Chem Soc. 2004;126:5722–5729. doi: 10.1021/ja0393877. [DOI] [PubMed] [Google Scholar]
- 9.Qin PZ, Dieckmann T. Curr Opin Struct Biol. 2004;14:350–359. doi: 10.1016/j.sbi.2004.04.002. [DOI] [PubMed] [Google Scholar]
- 10.Qin PZ, Hideg K, Feigon J, Hubbell WL. Biochemistry. 2003;42:6772–6783. doi: 10.1021/bi027222p. [DOI] [PubMed] [Google Scholar]
- 11.Gannett PM, Darian E, Powell J, Johnson EM, II, Mundoma C, Greenbaum NL, Ramsey CM, Dalal NS, Budil DE. Nucleic Acids Res. 2002;30:5328–5337. doi: 10.1093/nar/gkf634. [DOI] [PMC free article] [PubMed] [Google Scholar]
- 12.Kim NK, Murali A, DeRose VJ. J Am Chem Soc. 2005;127:14134–14135. doi: 10.1021/ja0541027. [DOI] [PMC free article] [PubMed] [Google Scholar]
- 13.Okonogi TM, Alley SC, Reese AW, Hopkins PB, Robinson BH. Biophys J. 2002;83:3446–3459. doi: 10.1016/S0006-3495(02)75344-7. [DOI] [PMC free article] [PubMed] [Google Scholar]
- 14.Jeschke G. Chem Phys Chem. 2002;3:927–932. doi: 10.1002/1439-7641(20021115)3:11<927::AID-CPHC927>3.0.CO;2-Q. [DOI] [PubMed] [Google Scholar]
- 15.Langen R, Oh KJ, Cascio D, Hubbell WL. Biochemistry. 2000;39:8396–8405. doi: 10.1021/bi000604f. [DOI] [PubMed] [Google Scholar]
- 16.Nienaber VL, Berliner LJ. J Protein Chem. 2000;19:129–137. doi: 10.1023/a:1007034700573. [DOI] [PubMed] [Google Scholar]
- 17.Sale K, Sar C, Sharp KA, Hideg K, Fajer PG. J Magn Reson. 2002;156:104–112. doi: 10.1006/jmre.2002.2529. [DOI] [PubMed] [Google Scholar]
- 18.Sale K, Song L, Liu YS, Perozo E, Fajer P. J Am Chem Soc. 2005;127:9334–9335. doi: 10.1021/ja051652w. [DOI] [PubMed] [Google Scholar]
- 19.Stoica I. J Mol Model. 2005;11:210–225. doi: 10.1007/s00894-005-0255-8. [DOI] [PubMed] [Google Scholar]
- 20.Stoica I. J Biomol Struct Dyn. 2004;21:745–760. doi: 10.1080/07391102.2004.10506965. [DOI] [PubMed] [Google Scholar]
- 21.Darian E, Gannett PM. J Biomol Struct Dyn. 2005;22:579–593. doi: 10.1080/07391102.2005.10507028. [DOI] [PubMed] [Google Scholar]
- 22.Altenbach C, Oh KJ, Trabanino RJ, Hideg K, Hubbell WL. Biochemistry. 2001;40:15471–15482. doi: 10.1021/bi011544w. [DOI] [PubMed] [Google Scholar]
- 23.Borbat PP, Davis JH, Butcher SE, Freed JH. J Am Chem Soc. 2004;126:7746–7747. doi: 10.1021/ja049372o. [DOI] [PubMed] [Google Scholar]
- 24.Kim N, Murali A, DeRose VJ. Chem Biol. 2004;11:939–948. doi: 10.1016/j.chembiol.2004.04.013. [DOI] [PubMed] [Google Scholar]
- 25.Piton N, Schiemann O, Mu Y, Stock G, Prisner T, Engels JW. Nucleosides Nucleotides Nucleic Acids. 2005;24:771–775. doi: 10.1081/ncn-200060139. [DOI] [PubMed] [Google Scholar]
- 26.Spaltenstein A, Robinson BH, Hopkins PB. Biochemistry. 1989;28:9484–9495. doi: 10.1021/bi00450a036. [DOI] [PubMed] [Google Scholar]
- 27.Qin PZ, Butcher SE, Feigon J, Hubbell WL. Biochemistry. 2001;40:6929–6936. doi: 10.1021/bi010294g. [DOI] [PubMed] [Google Scholar]
- 28.Cai Q, Kusnetzow AK, Hideg K, Price EA, Haworth IS, Qin PZ. Biophys J. 2007 May 25; doi: 10.1529/biophysj.107.109439. Epub ahead of print. [DOI] [PMC free article] [PubMed] [Google Scholar]
- 29.Leporc S, Mauffret O, Tevanian G, Lescot E, Monnot M, Fermandjian S. Nucleic Acids Res. 1999;27:4759–4767. doi: 10.1093/nar/27.24.4759. [DOI] [PMC free article] [PubMed] [Google Scholar]
- 30.Chambers EJ, Price EA, Bayramyan MZ, Haworth IS. J Biomol Struct Dyn. 2003;306:177–185. doi: 10.1080/07391102.2003.10506909. [DOI] [PubMed] [Google Scholar]
- 31.Cornell WD, Cieplak P, Bayly CI, Gould IR, Merz KM, Jr, Ferguson DM, Spellmeyer DC, Fox T, Caldwell JW, Kollman PA. J Am Chem Soc. 1995;117:5179–5197. [Google Scholar]
- 32.Case DA, Darden TA, Cheatham ITE, Simmerling CL, Wang J, Duke RE, Luo R, Merz KM, Wang B, Pearlman DA, Crowley M, Brozell S, Tsui V, Gohlke H, Mongan J, Hornak V, Cui G, Beroza P, Schafmeister C, Caldwell JW, Ross WS, Kollman PA. AMBER8 Users’ Manual. University of California; San Francisco: 2004. [Google Scholar]
- 33.Mukherjee S, Bhattacharyya D. Biopolymers. 2004;73:269–282. doi: 10.1002/bip.10550. [DOI] [PubMed] [Google Scholar]
- 34.Abraham RJ, Grant GH, Haworth IS, Smith PE. J Comput-Aided Mol Des. 1991;5:21–39. doi: 10.1007/BF00173468. [DOI] [PubMed] [Google Scholar]
- 35.Humphrey W, Dalke A, Schulten K. J Mol Graph. 1996;14:33–38. doi: 10.1016/0263-7855(96)00018-5. [DOI] [PubMed] [Google Scholar]
- 36.Goldstein BM. Disorder in the structure of trisodium phosphorothioate dodecahydrate. Acta Crystallogr Sect B. 1982;38:1116–1120. [Google Scholar]
- 37.Ab E, Schuurman-Wolters GK, Nijlant D, Dijkstra K, Saier MH, Robillard GT, Scheek RM. J Mol Biol. 2001;308:993–1009. doi: 10.1006/jmbi.2001.4623. [DOI] [PubMed] [Google Scholar]
- 38.Aarset K, Page EM, Rice DA. J Phys Chem A. 2005;109:4961–4965. doi: 10.1021/jp0407472. [DOI] [PubMed] [Google Scholar]
- 39.Cygler M. Acta Crystallogr Sect B. 1981;37:1765–1767. [Google Scholar]
- 40.Barone V, Bencini A, Cossi M, Di Matteo A, Mattesini M, Totti F. J Am Chem Soc. 1998;120:7069–7078. (and references therein) [Google Scholar]
- 41.Chen SY, Nie JJ, You JZ, Xu DJ, Chen YZ. J Chem Crystallogr. 2002;31:339–343. [Google Scholar]
Associated Data
This section collects any data citations, data availability statements, or supplementary materials included in this article.
Supplementary Materials
This article contains supplementary material available via the Internet at http://www.interscience.wiley.com/jpages/0006-3525/suppmat.