

Abstract
Prior measures of the blood oxygenation level dependent (BOLD) and cerebral blood flow (CBF) responses to a memory encoding task within the medial temporal lobe have suggested that the coupling between functional changes in CBF and changes in the cerebral metabolic rate of oxgyen (CMRO2) may be tighter in the medial temporal lobe as compared to the primary sensory areas. In this study, we used a calibrated functional magnetic resonance imaging (fMRI) approach to directly estimate memory-encoding-related changes in CMRO2 and to assess the coupling between CBF and CMRO2 in the medial temporal lobe. The CBF-CMRO2 coupling ratio was estimated using a linear fit to the flow and metabolism changes observed across subjects. In addition, we examined the effect of region-of-interest (ROI) selection on the estimates. In response to the memory encoding task, CMRO2 increased by 23.1% ± 8.8 to 25.3% ± 5.7 (depending upon ROI), with an estimated CBF-CMRO2 coupling ratio of 1.66 ± 0.07 to 1.75± 0.16. There was not a significant effect of ROI selection on either the CMRO2 or coupling ratio estimates. The observed coupling ratios were significantly lower than the values (2 to 4.5) that have been reported in previous calibrated fMRI studies of the visual and motor cortices. In addition, the estimated coupling ratio was found to be less sensitive to the calibration procedure for functional responses in the medial temporal lobe as compared to the primary sensory areas.
Keywords: Medial temporal lobe, calibrated-BOLD, functional MRI, arterial spin labeling, neurovascular coupling
Introduction
Functional MRI (fMRI) studies typically measure changes in the blood oxygenation level dependent (BOLD) signal in response to a functional task and use this signal as an indirect measure of neural activity. However, there is increasing evidence to suggest that the BOLD signal may also reflect changes in the cerebrovascular system due to factors such as medication, age, and disease (D'Esposito et al. 2003). As the BOLD signal exhibits a complex dependence on a number of physiological variables, such as cerebral blood flow (CBF) and the cerebral metabolic rate of oxygen (CMRO2), a deeper interpretation of the BOLD signal is possible if these additional variables can also be estimated. In particular, estimates of CMRO2 changes are of great interest, since changes in CMRO2 have been shown to be tightly linked with changes in neural activity (Hyder et al. 2001). Davis and colleagues (Davis et al. 1998) proposed a calibrated fMRI approach for estimating changes in CMRO2 by measuring the BOLD and CBF responses to both a hypercapnic challenge and a functional task. This approach has been used by a number of investigators to examine the neurovascular coupling ratio (denoted as n) between fractional changes in CBF and CMRO2.
The application of the calibrated BOLD approach has been limited primarily to cortical sensory areas employing either visual or motor stimuli, where robust measures of CBF and BOLD changes can be routinely obtained. These previous studies have typically reported values for the neurovascular coupling ratio in the range of 2 to 4.5 (Davis et al. 1998; Hoge et al. 1999; Kastrup et al. 2002; Stefanovic et al. 2004; Stefanovic et al. 2006; Chiarelli et al. 2007; Leontiev and Buxton 2007a; Leontiev et al. 2007b). In addition, a recent study reported different values for the coupling ratio in the motor and visual cortical areas (Chiarelli et al. 2007), indicating that the coupling ratio may vary across the brain. Our group has recently demonstrated the robust measurement of combined BOLD and CBF responses in the medial temporal lobe (MTL) to a memory encoding task in both young and elderly subjects (Restom et al. 2007). The observed BOLD response amplitude in this region (typically only ~0.5%) was smaller than that reported for sensory areas (typically on the order of 2% or more), despite a percent CBF change (roughly 40%) on the order of that typically observed in response to visual stimulation. These prior findings suggest that the changes in CBF and CMRO2 may be more tightly coupled in the MTL as compared to sensory areas. In this study, we use the calibrated fMRI approach to directly estimate the change in CMRO2 in the MTL in response to a memory encoding task. To obtain an estimate of the CBF-CMRO2 coupling ratio, we used a linear fit to the changes in CBF and CMRO2 across the group. In addition, we examine the implications of small BOLD signal changes for CMRO2 estimation when using the calibrated fMRI approach.
Methods
Participants
Nine healthy adults (5 women, mean age 25 ± 3.5) participated in the study. The study was approved by the institutional review board at the University of California San Diego, and written informed consent was obtained from all participants. Participants were selected without regard to ethnicity or race.
CO2 administration
Hypercapnia was induced by a gas mixture consisting of 5% CO2, 21% O2 and 74% N2 delivered through a non-rebreathing face mask (Hans Rudolph 2700 Series, St. Louis, MI). Two seven minute runs were acquired for each subject. During each run, subjects breathed room air for two minutes followed by three minutes of hypercapnia, and then room air for two minutes.
Functional task
The functional stimulus consisted of a picture-encoding task in which subjects viewed novel and familiar landscape images (Stern et al. 1996). Prior to the functional scanning, participants viewed four landscape images (two with horizontal and two with vertical aspect ratio) for approximately 10 minutes during the acquisition of a high-resolution anatomical scan and a baseline CBF scan. These images served as the familiar images. During the functional scanning session, images were displayed in a blocked design with alternating blocks consisting of 10 familiar or 10 novel images. Each image was displayed for a 2 sec duration with a 0.5 sec interval between images. Five blocks of novel and five blocks of familiar scenes were presented per run (250 sec) with three runs per subject. Participants were asked to indicate whether each image had a horizontal or vertical aspect ratio using a two-button response box, and the responses were monitored and recorded to ensure compliance.
Imaging
Imaging was performed on a 3T GE Excite system with a body transmit coil and an 8-channel receive-only head coil. Simultaneous perfusion and BOLD data were acquired with a PICORE QUIPSS II arterial spin labeling (ASL) sequence with a dual-echo spiral readout (Wong et al. 1998). Imaging parameters were: TR=3s, TI1/TI2=700/1400ms, tag thickness 200mm, tag to proximal slice gap 10 mm, TE1=2.8ms, TE2=24 ms, flip angle 90, FOV 240mm, 64×64 matrix. Five 6mm oblique axial slices aligned with the hippocampus were acquired. This sequence was used for data acquisition during the two hypercapnia scans, one baseline CBF scan (4 minutes), and three functional scans.
The high-resolution structural scan (acquired immediately after the hypercapnia scans) used a magnetization prepared 3D fast spoiled gradient acquisition in the steady state (FSPGR) sequence (172 sagittal slices, 1mm slice thickness, TI 450ms, TR 7.9ms, TE 3.1ms, 12 degree flip angle, FOV 25cm, matrix 256×256).
Cardiac pulse and respiratory effort data were monitored using a pulse oximeter (InVivo) and a respiratory effort transducer (BIOPAC), respectively. In addition to the physiological data, scanner TTL pulse data were recorded and used to synchronize the physiological data to the acquired images. Cardiac, respiratory, and TTL data were used to calculate physiological noise regressors as described in (Glover et al. 2000; Restom et al. 2006).
Definition of Anatomical ROIs
A medial temporal lobe (MTL) region of interest (ROI) was determined for each subject, consisting of the bilateral hippocampus and parahippocampus. The hippocampus was delineated using an automatic subcortical segmentation program (Freesurfer ASEG) applied to the anatomical image (Fischl et al. 2002). The parahippocampus was delineated using a MATLAB-based region-growing algorithm previously described in (Restom et al. 2007). Starting from seed voxels within the right and left hippocampi (identified using ASEG), this algorithm identifies cortical gray matter voxels within the gyrus located inferior to each hippocampus. All subsequent analysis was restricted to the MTL ROI, defined as the union of the voxels in the hippocampal and parahippocampal structures.
General Linear Model Analysis
The first four images of each ASL scan were excluded from data analysis to allow the MRI signal to reach steady state. All ASL runs were motion corrected and registered to the first functional run using AFNI software (Cox 1996).
Statistical analysis of the functional data was performed using a general linear model (GLM) approach for the analysis of ASL data (Mumford et al. 2006; Restom et al. 2006). The data from the two echoes were analyzed separately, with the first and second echo data used to analyze CBF and BOLD activity, respectively. The stimulus-related regressor in the GLM was obtained by convolving the block design stimulus pattern with a gamma density function of the form h(t) = (τn!)−1((t − Δt)/τ)n exp(−(t−Δt)/τ) for t≥Δt and 0 otherwise, with τ = 1.2, n = 3, and Δt = 1 (Boynton et al. 1996). The measured cardiac and respiratory fluctuation data were included in the GLM as regressors to model the physiological modulation of the ASL signal. In addition, a constant and a linear term were included as nuisance regressors. Pre-whitening was performed using an autoregressive AR(1) model (Burock and Dale 2000; Woolrich et al. 2001). As described in (Restom et al. 2006), the data from the three functional runs were concatenated for the GLM analysis, with separate physiological and nuisance regressors for each run.
Definition of Functional ROIs
Clusters of voxels exhibiting CBF and BOLD activation within the MTL ROI were detected using an overall significance threshold of P=0.05 applied to the first and second echo data, respectively. Correction for multiple comparisons was performed using the AFNI AlphaSim program (Forman et al. 1995; Cox 1996; Xiong et al. 2005). The active clusters were used to define two functional ROIs, facilitating the assessment of the effect of ROI choice on the parameter estimates. First, a partial overlap ROI was defined in the same way as in a recent study by our group (Restom et al. 2007). For this ROI, we required that the detected CBF and BOLD clusters be partially overlapping or contiguous for inclusion in further analysis. The use of this constraint is consistent with the observations of a prior study showing that activated CBF and BOLD voxels are typically found in neighboring spatial regions with active CBF voxels located primarily on the arterial side of the vasculature and active BOLD voxels arising primarily from the venous side (Luh et al. 2000). For the partial overlap ROI, average CBF and BOLD time series were computed by averaging over the active CBF and BOLD clusters, respectively. This approach is similar to that used by (Stefanovic et al. 2004; Stefanovic et al. 2006). A second ROI was defined as the intersection of the CBF and BOLD clusters, and is therefore a subset of the partial overlap ROI. Average CBF and BOLD time series were determined by averaging over all voxels within this intersection. This intersection approach is similar to that used in previous calibrated fMRI studies by (Davis et al. 1998; Kastrup et al. 2002; Chiarelli et al. 2007). For 2 out of the 9 subjects, the intersection ROI contained only a few isolated voxels (i.e. voxels with no functionally active neighbors). For these subjects, estimates were not computed for the intersection ROI. Further analysis, such as the comparison of estimates obtained with the partial overlap ROI versus the intersection ROI, was therefore restricted to the remaining 7 subjects.
Functional CBF and BOLD Time Series
For each voxel, the physiological noise components estimated with the GLM were removed from the measured data to form corrected first and second echo time series. From these noise-corrected time series, CBF time series were computed by taking the running subtraction of the control and tag image series from the first echo data (TE=2.8ms), while BOLD-weighted time series were computed from the running average of the second echo data (TE=24ms) (Liu and Wong 2005). For each subject and ROI, average CBF and BOLD time courses were obtained by averaging the individual time courses over task cycles and voxels within the ROI. Percent change CBF and BOLD responses were calculated by normalizing each time course to its baseline. The baseline values were calculated by fitting the responses to a model consisting of a constant baseline term and one cycle of the stimulus-related regressor. We defined the mean amplitude of each response as the mean value determined from the last 9 seconds of the stimulus “on” period (novel image presentation).
Determination of M, ΔCMRO2 and n
Estimation of CMRO2 changes with functional stimulation was performed with the approach described by Davis et al. (Davis et al. 1998). In this model, the relation between the fractional BOLD signal change and changes in CBF and CMRO2 is written as:
| [1] |
where the parameter M is a proportionality constant that reflects baseline deoxyhemoglobin content and defines the maximum possible BOLD signal change for a particular region. This parameter depends on baseline blood volume, baseline oxygen extraction fraction, magnetic field strength, and echo time. The parameter α is the exponent of the empirical power law relationship between blood volume and blood flow, and was assumed to be 0.38 (Grubb et al. 1974), while β was taken to be 1.5 (Hoge et al. 1999a; Buxton et al. 2004). The subscript 0 denotes baseline values.
The value of M was calculated using the hypercapnia data on a per subject basis. The data from the two hypercapnia runs were averaged and the resulting voxelwise CBF and BOLD time series were averaged over each ROI. These average time series were then normalized by their baseline value (determined from the first 1.8 minutes of each average response curve). The amplitudes of the CBF and BOLD responses to hypercapnia were determined by averaging the responses over the last two minutes of CO2 administration. An M value for each subject and each ROI was calculated using Eq [1], under the assumption that hypercapnia does not affect CMRO2 (Kety and Schmidt 1948; Novack et al. 1953; Horvath et al. 1994; Yang and Krasny 1995). These M values were then used to calculate an estimate of %ΔCMRO2 for each ROI on a per subject basis.
In addition, for each ROI, we computed the mean value of M over subjects. These mean M values were used to generate a second set of estimates of the CMRO2 changes for each subject. The CBF/CMRO2 coupling, n, was then estimated as the slope of the linear fit to the %ΔCBF vs %ΔCMRO2 data, where the fit was constrained to pass through the point (0,0) (i.e. the baseline condition).
The estimated %ΔCBF, %ΔBOLD, %ΔCMRO2, and M values were compared between the two ROIs using paired t-tests, with significance accepted at p <0.05. Paired t-tests were also used to compare %ΔCMRO2 obtained using group versus individual M values. In addition, the n values obtained with the two ROIs were compared using a t-test to test for differences in the slopes of the fitted CBF/CMRO2 data (Draper and Smith 1981).
In order to assess the effect of variations in M on the estimates of n, the CMRO2 and n values were recalculated for a range of M values for each ROI. To this end, the subject-wise %ΔBOLD and %ΔCBF responses to memory encoding were used to calculate %ΔCMRO2 values with assumed M values ranging from 1–30%. For each assumed M value, n was estimated as the slope of the fit of the %ΔCBF vs %ΔCMRO2 data.
Results
Robust CBF and BOLD responses to memory encoding were measured in all subjects. The top two rows of Figure 1 show the CBF and BOLD activation maps overlaid on anatomical images from a representative subject. The bottom row of Figure 1 shows voxels with significant CBF activation only (red), significant BOLD activation only (blue), or significant CBF and BOLD activation (green). As discussed in the Methods section, the analysis presented here is focused on the seven subjects for which both partial overlap and intersection ROIs could be defined. Figure 2 shows the functional ROIs from a single representative slice for each of the seven subjects. For these subjects, the partial overlap ROI (spanning up to 5 imaging slices) had a mean of 54 voxels in the CBF ROI and 93 voxels in the BOLD ROI. The mean number of voxels in the CBF/BOLD intersection ROI was considerably lower (24 voxels), reflecting the requirement that voxels exhibit both CBF and BOLD activation. For each subject, the degree of intersection was computed as the ratio of the number of voxels in the intersection ROI to the number of voxels in either the CBF or BOLD partial overlap ROIs. The group mean values of these ratios were 0.54±0.24 and 0.30±0.14 when referenced to the number of voxels in the CBF and BOLD ROIs, respectively.
Figure 1.
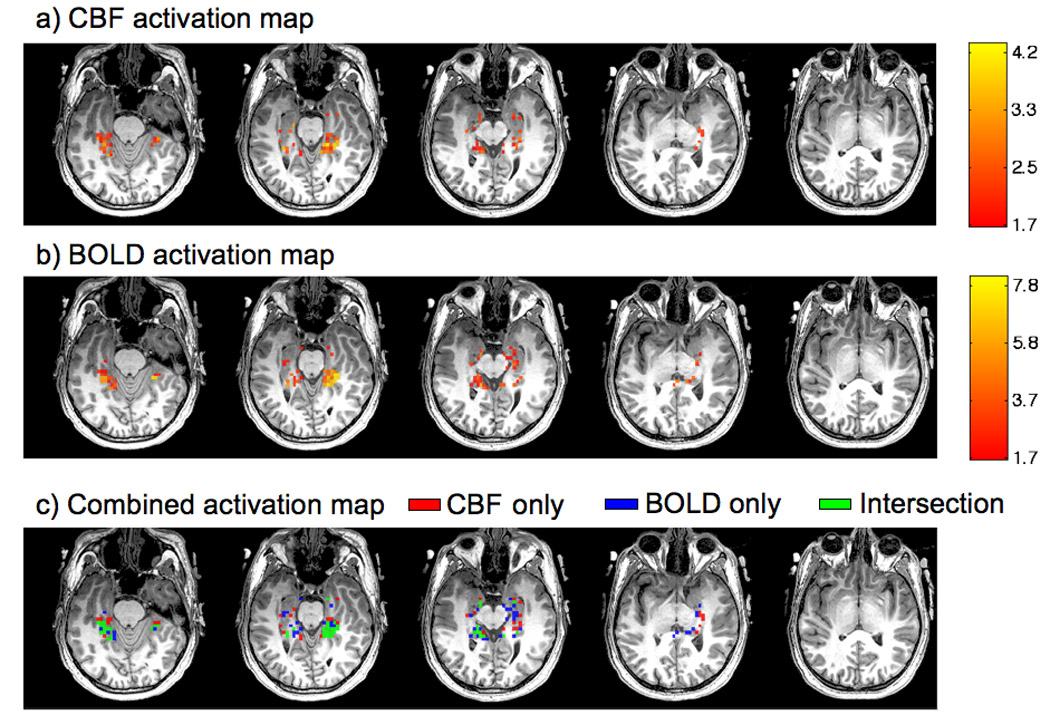
Functional CBF (top row) and BOLD (middle row) activation maps (z-scores) from a representative subject overlaid on hi-resolution anatomical images. The images in the bottom row show voxels that exhibit significant CBF activation only (red), BOLD activation only (blue), and both CBF and BOLD activation (green). Note that since clusters of activation were assessed across slices, voxels appearing to be isolated in any given slice will have a neighbor in an adjacent slice.
Figure 2.

Maps showing CBF activation only (red), BOLD activation only (blue), and intersection of CBF and BOLD activation (green) for a representative slice from each subject. The image in the upper left-hand corner is the same as the leftmost image in Figure 1c. Note that since clusters of activation were assessed across slices, some of the representative slices show isolated voxels that have a neighbor in a slice that is not shown.
Figure 3 shows the group mean time courses with standard error bars for (a) the functional CBF response, (b) the functional BOLD response, (c) the hypercapnic CBF response, and (d) the hypercapnic BOLD response. Measures computed from functional and hypercapnic responses (mean value ± one standard deviation) are summarized in Table 1. The BOLD response in the partial overlap ROI is relatively small (%ΔBOLD=0.55±0.16), despite a fairly robust CBF increase (mean %ΔCBF=42.1± 9.4). These values are in good agreement with our previous study (Restom et al. 2007), which reported %ΔBOLD=0.5% and %ΔCBF=43%. The mean value of M in the CBF/BOLD partial overlap ROI was 10.4± 3.5 , which led to an average CMRO2 percent change of 25.3± 5.7 and an average coupling factor of n=1.66± 0.07.
Figure 3.
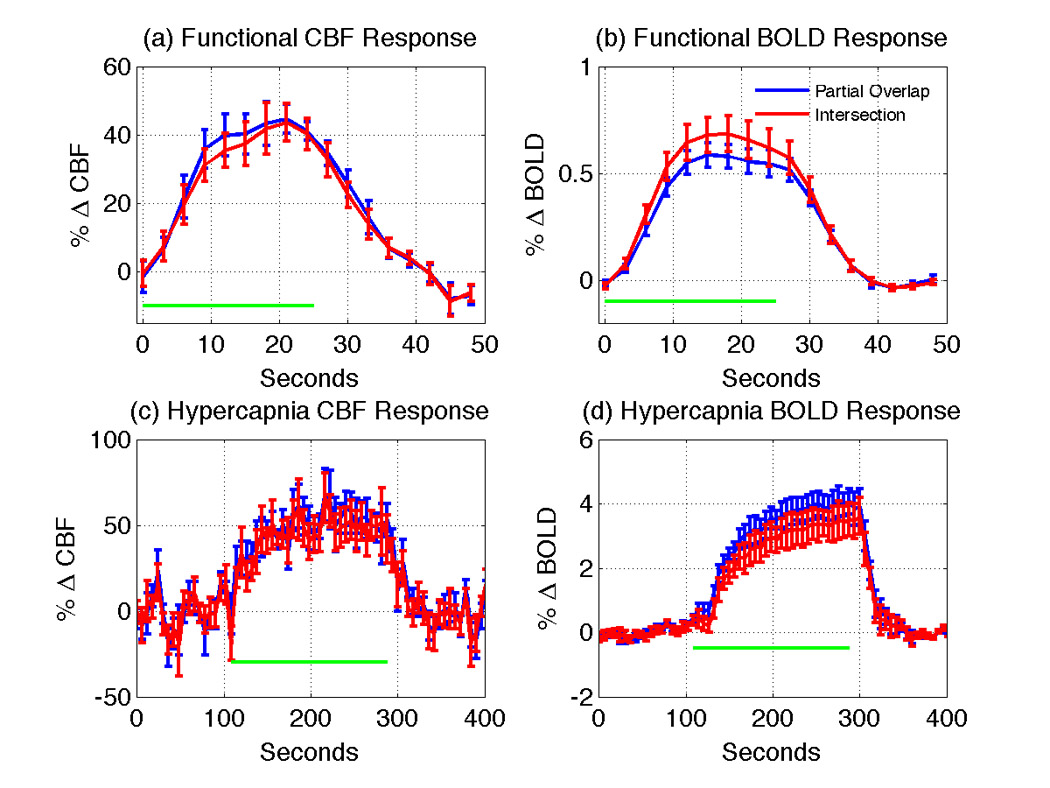
Mean time courses of the subject average (a) functional CBF response, (b) functional BOLD response, (c) hypercapnic CBF response, and (d) hypercapnic BOLD response, with standard error bars shown. Time courses from the partial overlap (blue) and intersection (red) ROIs are shown. To more clearly display the error bars, the hypercapnic responses are downsampled by a factor of two (6 second sampling period). For panels (a) and (b), the horizontal green bars indicate the time during which novel images were displayed. For panels (c) and (d), the horizontal green bars indicate the hypercapnic period.
Table 1.
Mean values (± one standard deviation) for the measured responses and calculated parameters for each ROI type. Note that the standard deviations are provided to give a sense of the inter-subject variability, but should not be used to estimate the statistical significance of differences in values between ROIs as paired t-tests were used for these comparisons. The %ΔCMRO2 values were calculated using Eq [1], using the mean M value over subjects. The n values were calculated as the slope of the linear fit of the %ΔCBF vs %ΔCMRO2 data. Measurements that are significantly different (p<0.05) between ROIs are indicated by an asterisk.
| Partial overlap ROI | CBF/BOLD intersection | |
|---|---|---|
| Response to hypercapnia | ||
| %ΔCBF | 52.8±22.2 | 49.0± 19.4 |
| %ΔBOLD | 3.6 ± 1.0 | 3.1 ± 1.27 * |
| M (%) | 10.4 ± 3.5 | 9.2 ± 4.2 |
| Response to memory encoding | ||
| %ΔCBF | 42.1 ± 9.4 | 41.1 ± 13.6 |
| %ΔBOLD | 0.55± 0.16 | 0.64 ± 0.23* |
| %ΔCMRO2 | 25.3 ± 5.7 | 23.1 ± 8.8 |
| n | 1.66 ± 0.07 | 1.75 ± 0.16 |
In the CBF/BOLD intersection ROI, the %ΔBOLD response (0.64± 0.23) was significantly higher than observed for the partial overlap ROI, but the M value (9.2± 4.2), the CBF response to activation (41.1± 13.6), the CMRO2 response (23.1± 8.8), and the coupling factor (n=1.75± 0.16) were not significantly different from the partial overlap ROI values. For both ROIs, there were no significant differences (p > 0.3) between the %ΔCMRO2 values calculated with the group average or individual M values (for individual M values, average %ΔCMRO2 values were 24.7± 5.6 and 21.8± 8.2 in the partial overlap and intersection ROIs, respectively).
Figure 4 shows the %ΔCBF versus %ΔCMRO2 data (calculated using the group average M) across subjects for the partial overlap and CBF/BOLD intersection ROIs. Although values of %ΔCBF and %ΔCMRO2 showed considerable variation across subjects, there is a strong correlation between these two parameters (R=0.97 for the partial overlap ROI, R=0.94 for the intersection ROI). The lines representing n=1, 2 and 3 are also drawn. The slope of the best fit line through the data is significantly (p <0.01) different to all of these lines, including n=2.
Figure 4.

CBF vs CMRO2 changes in response to memory encoding for (a) partial overlap ROI and (b) CBF/BOLD intersection ROI. The solid lines are the linear fits to the data, constrained to pass through the origin, with correlation coefficients of 0.99 and 0.98 for panels (a) and (b), respectively. The red shaded areas indicate the 95% confidence limits for the fitted slopes. The slope of each line is the coupling ratio, n, of the percent CBF and CMRO2 changes in response to memory encoding. Lines corresponding to n= 1, 2 and 3 are also shown.
Figure 5 shows the dependence of n on variations in the parameter M for both ROIs (red and blue solid lines). Also shown are curves for visual and motor cortices adapted from data in Figure 6 of the paper by Chiarelli et al. (Chiarelli et al. 2007). In all cases, as M increases, the coupling factor n decreases, tending towards a value of approximately 1.4. The mean M values obtained for each region are indicated by the red crosses. At these mean M-values, the slope of the n versus M curves are lower for the MTL curves as compared to the visual and motor cortex curves. As a result, the coupling factor n is less sensitive to variations in M for the MTL data as compared to the sensory data.
Figure 5.

CBF/CMRO2 coupling ratio n as a function of M. The CBF and BOLD responses to memory encoding were used to re-calculate the CMRO2 responses and n values using a range of assumed M values. Curves for the partial overlap ROI (red) and CBF/BOLD intersection (blue) are shown. Included for comparison are curves from the primary visual (black dash-dot), primary motor (solid black) and supplementary motor (black dash) cortices, adapted from (Chiarelli et al. 2007). For each curve, the red cross indicates the mean M value for the associated experimental data.
Discussion
In this study, CBF and BOLD responses to memory encoding in a sample of young adults were found to be consistent with those reported in a previous study by our group (Restom et al. 2007). The average changes in CMRO2 were estimated to be 25.3% and 23.1% for the partial overlap and CBF/BOLD intersection ROIs, respectively. A previous study, published in abstract form (Xu et al. 2006), estimated the metabolic response in the hippocampus to memory encoding in healthy elderly adults and reported a %ΔCMRO2 of 64±219%. These values are larger and much more variable than the results reported here. However, a direct comparison of the two studies is difficult since no hypercapnia data were collected in the prior study.
The values of the BOLD scaling factor, M, in the current study are similar to previously reported values in the visual and motor cortex (typically 6–8% (Davis et al. 1998; Kastrup et al. 2002; Stefanovic et al. 2004)). A recent study from our group reports M=9.7% in a CBF/BOLD intersection ROI in the visual cortex (Perthen et al., in revision). However, it should be noted that it is difficult to compare M values between different studies because M is a function of parameters that may vary between different brain regions, e.g. cerebral blood volume, as well as study specific parameters such as echo time, field strength, and the baseline state of the subject group.
The influence of the value of M on the CBF/CMRO2 coupling ratio was shown in Figure 2 using data from the present study and from a recent study focused on sensory areas (Chiarelli et al. 2007). In comparison to the sensory data, the measured M values are slightly higher on average in the current study and the BOLD responses to activation are considerably lower (mean %ΔBOLD~0.5%, compared to mean %ΔBOLD ranging from ~1.3–2.3% for visual and motor cortices in (Chiarelli et al. 2007)). The lower BOLD response amplitudes in the current study result in a reduced sensitivity of the coupling factor to the exact value of M. This can be better appreciated by re-writing the Davis model (Eq [1]) in the following way:
| [2] |
As the %ΔBOLD signal decreases towards zero, the term in the square bracket above tends towards unity, and the CMRO2 response (and therefore the estimated coupling ratio) is then determined primarily by the CBF response. In this limit, the coupling factor n tends towards a value of approximately 1.4 (Brown et al. 2007; Chiarelli et al. 2007) and a good correlation between CBF and CMRO2 is necessarily observed (Chiarelli et al. 2007), consistent with the data shown in Figure 1.
It is also important to note that our estimation of the coupling ratio n relied upon a linear fit to the changes in CBF and CMRO2 across the group of subjects. As we did not use a graded stimulus in this study, we did not make inferences about the existence of a linear coupling between CBF and CMRO2 for individual subjects and could not rule out the possibility of a nonlinear coupling relation within individual subjects. (Chiarelli et al. 2007) found that for sensory areas the coupling observed within individual subjects was consistent with the coupling observed across the group, and thus used a linear fit to the combined data across stimulus levels and subjects. Taking into account the arguments presented in the previous paragraph and the prior results from (Chiarelli et al. 2007), it is likely that the observation of a linear coupling across the group in the present study is consistent with a similar linear coupling within individual subjects. However, further studies using graded stimuli are necessary to confirm the existence of linear coupling within the MTL for individual subjects.
In the present study, the coupling ratio, n, was estimated to be 1.66 in the partial overlap ROI and 1.75 in the intersection ROI, with no significant difference between the values in the two ROIs. These values are lower than the previously reported values for the motor cortex of 2.0–3.33 (Kastrup et al. 2002; Stefanovic et al. 2004; Stefanovic et al. 2006; Chiarelli et al. 2007), and primary visual cortex of 2.0–4.5 (Davis et al. 1998; Hoge et al. 1999; Stefanovic et al. 2006; Chiarelli et al. 2007; Leontiev and Buxton 2007a; Leontiev et al. 2007b). This finding suggests a tighter coupling between flow and metabolism in the hippocampus than in sensory areas. The tighter coupling results in a lower BOLD change in the MTL as compared to the sensory areas, despite similar CBF changes. In order to obtain a coupling ratio similar to those reported for sensory areas (n>2), we would require an approximate doubling of the observed BOLD response. For example in the partial overlap ROI, we would have had to observe a %ΔBOLD signal of approximately 1% in order to obtain n=2. Further work examining the factors that might contribute to inter-regional and intra-regional differences in the coupling between flow and metabolism would be useful. For example, it would be interesting to determine if the coupling ratio within the MTL varies across experimental paradigms that engage different memory-related functions.
We found that the estimates of %ΔCMRO2 and the coupling factor n were not significantly different between the partial overlap and intersection ROIs. As compared to sensory regions, the definition of an intersection ROI is not always practical in the MTL. Indeed, in this study we found that two out of the nine subjects scanned had only a few isolated voxels for which there were both significant CBF and BOLD activations. In our prior study of MTL activation in young and elderly subjects (Restom et al. 2007), we chose to use a partial overlap ROI because the problem was especially severe in elderly subjects, with some subjects showing no voxels within the intersection ROI. The difficulty in defining an intersection ROI in the MTL reflects a number of factors. Cognitive tasks typically elicit less robust responses than sensory stimuli, leading to a lower contrast-to-noise ratio. This is especially problematic for the arterial spin labeling functional CBF measures, which already exhibit a low inherent contrast-to-noise ratio. For BOLD measures, susceptibility-related signal drop-outs in the anterior portion of the MTL can greatly reduce the number of functionally active BOLD voxels, thus further reducing the region of functional CBF and BOLD overlap. Although this study did not find a significant difference in the estimates obtained with the two types of ROIs in the MTL, further work to determine if the same conclusion applies to other brain regions would be useful. In addition, the development of more advanced statistical analysis and processing methods may lead to improvements in the ability to more robustly define intersection ROIs within the MTL.
In summary, the findings of this study suggest that there is a tighter coupling between CBF changes and CMRO2 changes in the MTL as compared to sensory areas. Interestingly, the coupling was found to be fairly insensitive to the exact values of either M or the BOLD response to activation, due to the relatively small BOLD responses to the cognitive task. The primary driver of the CMRO2 estimates was the CBF response to activation. As a result, obtaining accurate estimates of changes in CMRO2 in this brain region depends critically upon robust measurements of the CBF response to activation, whereas performing a hypercapnic calibration may be less important.
Acknowledgements
This work was supported by grants from the Dana Foundation and the National Institutes of Health (R01 NS051661). We would also like to thank Beau Ances and Joy Liau for their assistance with scanning.
Footnotes
Publisher's Disclaimer: This is a PDF file of an unedited manuscript that has been accepted for publication. As a service to our customers we are providing this early version of the manuscript. The manuscript will undergo copyediting, typesetting, and review of the resulting proof before it is published in its final citable form. Please note that during the production process errors may be discovered which could affect the content, and all legal disclaimers that apply to the journal pertain.
References
- Boynton GM, Engel SA, Glover GH, Heeger DJ. Linear systems analysis of functional magnetic resonance imaging in human V1. J. Neuroscience. 1996;16:4207–4221. doi: 10.1523/JNEUROSCI.16-13-04207.1996. [DOI] [PMC free article] [PubMed] [Google Scholar]
- Brown GG, Perthen JE, Liu TT, Buxton RB. A primer on functional magnetic resonance imaging. Neuropsychol Rev. 2007;17(2):107–125. doi: 10.1007/s11065-007-9028-8. [DOI] [PubMed] [Google Scholar]
- Burock MA, Dale AM. Estimation and detection of event-related fMRI signals with temporally correlated noise: a statistically efficient and unbiased approach. Human Brain Mapping. 2000;11:249–260. doi: 10.1002/1097-0193(200012)11:4<249::AID-HBM20>3.0.CO;2-5. [DOI] [PMC free article] [PubMed] [Google Scholar]
- Buxton RB, Uludag K, Dubowitz DJ, Liu TT. Modeling the hemodynamic response to brain activation. Neuroimage. 2004;23 Suppl 1:S220–S233. doi: 10.1016/j.neuroimage.2004.07.013. [DOI] [PubMed] [Google Scholar]
- Chiarelli PA, Bulte DP, Gallichan D, Piechnik SK, Wise R, Jezzard P. Flow-metabolism coupling in human visual, motor, and supplementary motor areas assessed by magnetic resonance imaging. Magn Reson Med. 2007;57(3):538–547. doi: 10.1002/mrm.21171. [DOI] [PubMed] [Google Scholar]
- Cox RW. AFNI-software for analysis and visualization of functional magnetic resonance neuroimages. Comput. Biomed. Res. 1996;29:162–173. doi: 10.1006/cbmr.1996.0014. [DOI] [PubMed] [Google Scholar]
- D'Esposito M, Deouell LY, Gazzaley A. Alterations in the BOLD fMRI signal with ageing and disease: a challenge for neuroimaging. Nat Rev Neurosci. 2003;4(11):863–872. doi: 10.1038/nrn1246. [DOI] [PubMed] [Google Scholar]
- Davis TL, Kwong KK, Weisskoff RM, Rosen BR. Calibrated functional MRI: mapping the dynamics of oxidative metabolism. Proc. Natl. Acad. Sci. USA. 1998;95:1834–1839. doi: 10.1073/pnas.95.4.1834. [DOI] [PMC free article] [PubMed] [Google Scholar]
- Draper NR, Smith H. Applied Regression Analysis. New York: Wiley; 1981. [Google Scholar]
- Fischl B, et al. Whole brain segmentation: automated labeling of neuroanatomical structures in the human brain. Neuron. 2002;33(3):341–355. doi: 10.1016/s0896-6273(02)00569-x. [DOI] [PubMed] [Google Scholar]
- Forman SD, Cohen JD, Fitzgerald M, Eddy WP, Mintun MA, Noll DC. Improved assessment of significant activation in functional magnetic resonance imaging (fMRI): use of a cluster-size threshold. Magn. Reson. Med. 1995;33:636–647. doi: 10.1002/mrm.1910330508. [DOI] [PubMed] [Google Scholar]
- Glover GH, Li TQ, Ress D. Image-based method for retrospective correction of physiological motion effects in fMRI: RETROICOR. Magn Reson Med. 2000;44(1):162–167. doi: 10.1002/1522-2594(200007)44:1<162::aid-mrm23>3.0.co;2-e. [DOI] [PubMed] [Google Scholar]
- Grubb RL, Raichle ME, Eichling JO, Ter-Pogossian MM. The effects of changes in PaCO2 on cerebral blood volume, blood flow, and vascular mean transit time. Stroke. 1974;5:630–639. doi: 10.1161/01.str.5.5.630. [DOI] [PubMed] [Google Scholar]
- Hoge RD, Atkinson J, Gill B, Crelier GR, Marrett S, Pike GB. Linear coupling between cerebral blood flow and oxygen consumption in activated human cortex. Proc Natl Acad Sci U S A. 1999;96(16):9403–9408. doi: 10.1073/pnas.96.16.9403. [DOI] [PMC free article] [PubMed] [Google Scholar]
- Hoge RD, Atkinson J, Gill B, Crelier GR, Marrett S, Pike GB. Investigation of BOLD signal dependence on cerebral blood flow and oxygen consumption: the deoxyhemoglobin dilution model. Magn. Reson. Med. 1999a;42:849–863. doi: 10.1002/(sici)1522-2594(199911)42:5<849::aid-mrm4>3.0.co;2-z. [DOI] [PubMed] [Google Scholar]
- Horvath I, Sandor NT, Ruttner Z, McLaughlin AC. Role of nitric oxide in regulating cerebrocortical oxygen consumption and blood flow during hypercapnia. J Cereb Blood Flow Metab. 1994;14(3):503–509. doi: 10.1038/jcbfm.1994.62. [DOI] [PubMed] [Google Scholar]
- Hyder F, Kida I, Behar KL, Kennan RP, Maciejewski PK, Rothman DL. Quantitative functional imaging of the brain: towards mapping neuronal activity by BOLD fMRI. NMR Biomed. 2001;14(7–8):413–431. doi: 10.1002/nbm.733. [DOI] [PubMed] [Google Scholar]
- Kastrup A, Kruger G, Neumann-Haefelin T, Glover GH, Moseley ME. Changes of cerebral blood flow, oxygenation, and oxidative metabolism during graded motor activation. Neuroimage. 2002;15(1):74–82. doi: 10.1006/nimg.2001.0916. [DOI] [PubMed] [Google Scholar]
- Kety S, Schmidt C. Nitrous oxide method for the quantitative determination of cerebral blood flow in man: Theory, procedure and normal values. J. Clin. Invest. 1948;27:475–483. doi: 10.1172/JCI101994. [DOI] [PMC free article] [PubMed] [Google Scholar]
- Leontiev O, Buxton RB. Reproducibility of BOLD, perfusion, and CMRO2 measurements with calibrated-BOLD fMRI. Neuroimage. 2007a;35(1):175–184. doi: 10.1016/j.neuroimage.2006.10.044. [DOI] [PMC free article] [PubMed] [Google Scholar]
- Leontiev O, Dubowitz DJ, Buxton RB. CBF/CMRO(2) coupling measured with calibrated BOLD fMRI: Sources of bias. Neuroimage. 2007b doi: 10.1016/j.neuroimage.2006.12.034. [DOI] [PMC free article] [PubMed] [Google Scholar]
- Liu TT, Wong EC. A signal processing model for arterial spin labeling functional MRI. Neuroimage. 2005;24(1):207–215. doi: 10.1016/j.neuroimage.2004.09.047. [DOI] [PubMed] [Google Scholar]
- Luh WM, Wong EC, Bandettini PA, Ward BD, Hyde JS. Comparison of simultaneously measured perfusion and BOLD signal increases during brain activation with T(1)-based tissue identification. Magn Reson Med. 2000;44(1):137–143. doi: 10.1002/1522-2594(200007)44:1<137::aid-mrm20>3.0.co;2-r. [DOI] [PubMed] [Google Scholar]
- Mumford JA, Hernandez-Garcia L, Lee GR, Nichols TE. Estimation efficiency and statistical power in arterial spin labeling fMRI. Neuroimage. 2006;33(1):103–114. doi: 10.1016/j.neuroimage.2006.05.040. [DOI] [PMC free article] [PubMed] [Google Scholar]
- Novack P, Shenkin HA, Bortin L, Goluboff B, Soffe AM. The effects of carbon dioxide inhalation upon the cerebral blood flow and cerebral oxygen consumption in vascular disease. J Clin Invest. 1953;32(8):696–702. doi: 10.1172/JCI102783. [DOI] [PMC free article] [PubMed] [Google Scholar]
- Perthen JE, Lansing AE, Liau J, Liu TT. Caffeine induced uncoupling of cerebral blood flow and oxygen metabolism. Neuroimage. doi: 10.1016/j.neuroimage.2007.10.049. submitted. (In Revision) [DOI] [PMC free article] [PubMed] [Google Scholar]
- Restom K, Bangen KJ, Bondi MW, Perthen JE, Liu TT. Cerebral blood flow and BOLD responses to a memory encoding task: A comparison between healthy young and elderly adults. Neuroimage. 2007:430–439. doi: 10.1016/j.neuroimage.2007.05.024. [DOI] [PMC free article] [PubMed] [Google Scholar]
- Restom K, Behzadi Y, Liu TT. Physiological noise reduction for arterial spin labeling functional MRI. Neuroimage. 2006;31(3):1104–1115. doi: 10.1016/j.neuroimage.2006.01.026. [DOI] [PubMed] [Google Scholar]
- Stefanovic B, Warnking JM, Pike GB. Hemodynamic and metabolic responses to neuronal inhibition. Neuroimage. 2004;22(2):771–778. doi: 10.1016/j.neuroimage.2004.01.036. [DOI] [PubMed] [Google Scholar]
- Stefanovic B, Warnking JM, Rylander KM, Pike GB. The effect of global cerebral vasodilation on focal activation hemodynamics. Neuroimage. 2006;30(3):726–734. doi: 10.1016/j.neuroimage.2005.10.038. [DOI] [PubMed] [Google Scholar]
- Stern CE, Corkin S, Gonzalez RG, Guimares AR, Baker JR, Carr CA, Sugiura RM, Vadantham V, Rosen BR. The hippocampal formation participates in novel picture encoding: Evidence from functional magnetic resonance imaging. Proc. Natl. Acad. Sci. USA. 1996;93:8600–8665. doi: 10.1073/pnas.93.16.8660. [DOI] [PMC free article] [PubMed] [Google Scholar]
- Wong EC, Buxton RB, Frank LR. Quantitative imaging of perfusion using a single subtraction (QUIPSS and QUIPSS II) Magn. Reson. Med. 1998;39(5):702–708. doi: 10.1002/mrm.1910390506. [DOI] [PubMed] [Google Scholar]
- Woolrich MW, Ripley BD, Brady M, Smith SM. Temporal autocorrelation in univariate linear modeling of FMRI data. Neuroimage. 2001;14(6):1370–1386. doi: 10.1006/nimg.2001.0931. [DOI] [PubMed] [Google Scholar]
- Xiong J, Gao J-H, Lancaster JL, Fox PT. Clustered PIxels Analysis for Functional MRI Activation Studies of the Human Brain. Human Brain Mapping. 2005;3:287–301. [Google Scholar]
- Xu G, Wu G, Xu Y, Li S-J. Decrease in CMRO2 for Memory-Encoding Tasks in the Hippocampus of Mild Cognitive Impairment Subjects; Proceedings of the 14th ISMRM Scientific Meeting; Seattle, WA. 2006. p. 1108. [Google Scholar]
- Yang SP, Krasny JA. Cerebral blood flow and metabolic responses to sustained hypercapnia in awake sheep. J. Cereb. Blood Flow and Metabol. 1995;15:115–123. doi: 10.1038/jcbfm.1995.13. [DOI] [PubMed] [Google Scholar]