

Summary
We describe a gain of function mutation in the skeletal muscle glycogen synthase gene that is responsible for a novel myopathy, and is highly prevalent in multiple breeds of horses because it arose before the founding of many modern breeds.
Polysaccharide Storage Myopathy (PSSM) is a novel glycogenosis in horses characterized by abnormal glycogen accumulation in skeletal muscle and muscle damage with exertion. It is unlike glycogen storage diseases resulting from known defects in glycogenolysis, glycolysis and glycogen synthesis that have been described in humans and domestic animals. A genome wide association identified GYS1, encoding skeletal muscle glycogen synthase (GS), as a candidate gene for PSSM. DNA sequence analysis revealed a mutation resulting in an arginine to histidine substitution in a highly conserved region of GS. Functional analysis demonstrated an elevated GS activity in PSSM horses and haplotype analysis and allele age estimation demonstrated that this mutation is identical by descent among horse breeds. This is the first report of a gain of function mutation in GYS1 resulting in a glycogenosis.
Keywords: Genome-wide association, horse, glycogen storage disease, glycogen synthase, gain-of-function mutation, polysaccharide storage myopathy
INTRODUCTION
Horses have been domesticated for thousands of years, and modern breeds have been established by selection for a variety of athletic, physical and behavioral traits. In horses, as in other animal species, line breeding to propagate desirable traits has coincidently also propagated deleterious traits. One such undesirable trait is Polysaccharide Storage Myopathy (PSSM) [1–12], a debilitating and potentially life-threatening glycogen storage disease that occurs in several genetically diverse breeds of horses [2, 6, 12–15] (Fig. 1A). Clinical findings consistent with PSSM were first reported in the early 1900s in working Draft horses that developed exertional rhabdomyolysis when returning to work after several days of rest [16]. However, PSSM was not recognized as a skeletal muscle glycogenosis until 1992 [2]. Today, as many as 36% of Draft horses [12] and 10% of Quarter Horses [17] have PSSM. The phenotypic expression of PSSM ranges from muscle atrophy and progressive weakness in Draft horse breeds to muscle soreness and gait abnormalities in Warmblood breeds, and acute exertional rhabdomyolysis in Quarter Horses. The severity of clinical signs in PSSM ranges from muscle cramping and stretching out (Fig. 1B) to severe muscle pain and myoglobinuria and occasionally the complete inability to rise (Fig. 1C). Although PSSM is clinically well-recognized and common, its metabolic basis has remained a mystery for over a hundred years.
Figure 1. Diversity of phenotypes and clinical signs of horses affected with PSSM.

Panel a: A Quarter horse on left (60” tall at height of shoulder) and a Belgian Draft horse (72” tall at height of shoulder) both with PSSM. Panel b: A Quarter Horse with typical signs of muscle cramping accompanying an episode of exertional rhabdomyolysis. Panel c: A Quarter Horse severely afflicted with exertional rhabdomyolysis that can only stand for a few minutes with assistance from a sling.
All horses with PSSM accumulate excess glycogen as well as abnormal amylase resistant polysaccharide (Fig. 2) in type 2A and type 2B skeletal muscle fibers. [9] The disease has been best characterized in Quarter Horses, where a familial relationship [3], enhanced insulin sensitivity and blood glucose uptake [10], and myofiber energy deficit with sub-maximal exercise [11] have been demonstrated. Although glycogenolytic and glycolytic defects are the most common cause of glycogenoses in humans, PSSM horses have normal glycogenolytic and glycolytic enzyme activities and are able to utilize glycogen and produce lactate with anaerobic exercise [2, 18]. Thus, PSSM appears to be a unique animal model of abnormal muscle glycogen metabolism [18, 19] that may provide insight into myocyte carbohydrate metabolism, and the genetic basis of uncharacterized glycogenoses in humans. The complexity of potentially defective pathways including insulin signaling, skeletal muscle glucose uptake and glycogen metabolism dictated that a positional cloning approach should be utilized to identify positional candidate genes [10, 18, 20].
Figure 2. Photomicrograph of skeletal muscle from a horse with PSSM.

Panel a: Periodic acid Schiff’s (PAS) staining of cross-section of semitendinosus muscle from a normal horse demonstrating the presence of normal glycogen. Panel b: PAS staining of the same muscle from a horse with PSSM showing crystalline PAS positive inclusions of abnormal polysaccharide in multiple fibers. Panel c: Amylase digestion and PAS staining of a serial section of muscle from the PSSM horse in Panel b. Normal glycogen has been digested, whereas the abnormal polysaccharide is amylase-resistant.
RESULTS
Genome-wide association analysis
One hundred and five microsatellite (MS) markers distributed on all 31 equine autosomes were genotyped on an initial population of 48 related PSSM and 48 unrelated control Quarter Horses. The 48 related PSSM Quarter Horse cases were selected from an extended pedigree and all traced back to a single common ancestor within 7 generations, thus increasing the extent of the shared chromosomal segment surrounding the mutation and improving the power to detect association (see supplementary methods and supplementary Fig. 4 for population structure). Chi square tests for association gave a range of p values from 1.9 x10⁻⁵ to 0.97 for the comparison of allele frequencies between the PSSM and control groups (supplementary Fig. 1). Two markers on two different chromosomes had p-values <0.001. The NVEQ018 marker on ECA10p gave a p value of 1.9 x10⁻⁵, and its allele distribution showed that 23/48 of the affected horses possessed an allele that was virtually absent (2/48) in the controls (Fig. 3).
Figure 3. ECA10p p values.

Map of ECA10p and p values association of MS marker alleles with PSSM in the initial and follow-up case and control cohorts. From left to right: idiogram of ECA10p with FISH-anchored loci (21); Radiation hybrid map of ECA10p with comparatively mapped loci to HSA19 (21); p values for chi-squared comparison of MS allele frequencies in the initial population and the follow-up population. The GYS1 gene at the 54.1 Mb position on HSA19 is indicated.
Eight additional ECA10p MS were then genotyped to define an approximately 10 Mb interval that was highly associated with PSSM (p = 2.1x10⁻⁴ to 1.9x10⁻⁷) (Fig. 3). To rule out spurious association due to the relatedness of the affected and control cohorts and thus dependence of the observations in the chi-square analysis, and to narrow the candidate chromosomal region, a follow-up population of 52 PSSM and 44 control Quarter Horses was genotyped. PSSM cases in the follow-up cohort were chosen on the basis of not sharing a common ancestor with the initial case cohort within 5 generations. The two markers with p values < 2.0 x 10⁻⁵ in this follow-up population (COR015 and SCGV030) spanned an approximately 3 Mb region highly associated with PSSM (Fig. 3). The p values for these two markers in the combined population of 100 cases and 92 controls were 1.0x10⁻¹⁴ and 2.0x10⁻⁸.
The horse-human comparative map indicates that the region of ECA10p encompassed by COR015 and SCGV030 is homologous to human chromosome 19 (HSA19), from Mb position 51.9 to 54.6 [21]. Of the positional candidates in this region of HSA19, only the GYS1 gene at 54.1 Mb is known to play a direct role in carbohydrate metabolism. GYS1 encodes the skeletal muscle isoform of glycogen synthase (GS) that is expressed in skeletal muscle and non-hepatic tissues [22]. GS catalyzes the addition of single glucosyl residues from UDP-glucose onto a glycogen polymer using an α 1→4 glycosidic linkage [23] and is the rate-limiting step in glycogen synthesis [24].
Identification of a candidate causal mutation
The GYS1 protein coding, as well as 5’- and 3’-untranslated sequences from a PSSM and a control Quarter Horse, were PCR amplified and sequenced from skeletal muscle cDNA or genomic DNA. The PSSM horse sequenced was selected because it was homozygous at both the Cor015 and SCGV030 loci and was likely to be homozygous for a potential mutation; the control horse was randomly selected from the controls used for the genome scan. A single polymorphism was identified, in which a G to A base substitution changes the normal arginine (R) at codon 309 (CGT) to a histidine (H) (CAT) in PSSM affected Quarter Horses. Sequence analysis of GYS1 exon 6 from genomic DNA was performed in 6 additional severely affected and 6 control horses. Two of the PSSM affected horses were homozygous and four were heterozygous for the histidine mutation while the 6 control horses were all homozygous for the normal arginine allele. Multiple alignment of the amino acid sequence in this region demonstrated that arginine 309, as well as the surrounding amino acids (305-QEFVRGHFYGH-314), are highly conserved in both the GYS1 (muscle) and GYS2 (liver) forms of GS (Fig. 4).
Figure 4. Glycogen Synthase amino acid alignment.

Multiple amino acid alignment of glycogen synthase 1 (skeletal muscle isoform) and glycogen synthase 2 (liver isoform). Residue 309 at the site of the GYS1 PSSM mutation, and the surrounding amino acids, are highly conserved across species and across both GS isoforms.
Glycogen synthase activity in PSSM
Glycogen synthase assays on muscle homogenates were performed. The mean GS activity was higher in PSSM than control muscle in both the presence and absence of the allosteric activator glucose 6-phosphate (G6P) (p = 0.03 and 0.04, respectively) (Fig. 5). The −/+ G6P ratio was not significantly different between PSSM and control horses (p = 0.09; mean = 0.06 and 0.03 in PSSM and control respectively). The low −/+ G6P ratio suggests that the GS present in the skeletal muscle homogenates was highly phosphorylated [25].
Figure 5. Glycogen Synthase Activity.
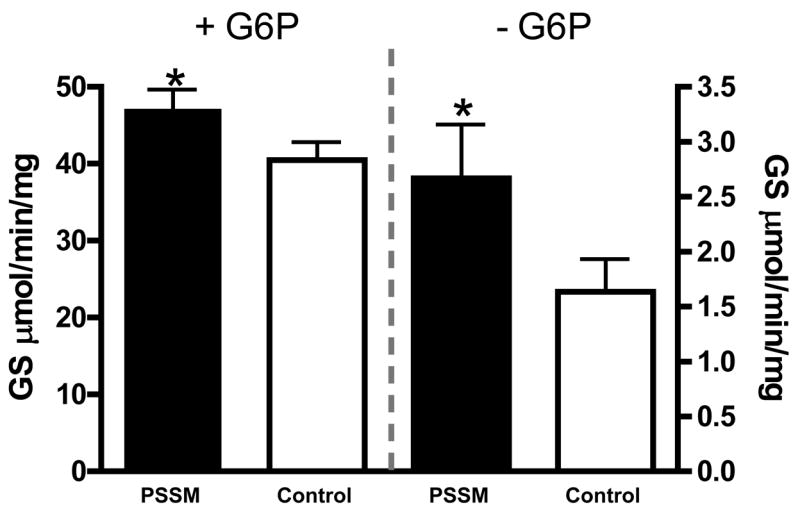
Mean GS activity in the presence and absence of its allosteric activator, glucose 6-phosphate (G6P).
* indicates significant difference between PSSM and controls
GYS1 allele frequency in Quarter Horses
Ninety-nine PSSM Quarter Horses used in the whole genome association analysis were genotyped for the Arg309His mutation; 72 were heterozygous and 5 were homozygous for the H allele. Surprisingly, 22 PSSM horses were homozygous for the normal R allele. Eighty eight of the 92 control Quarter Horses were homozygous normal and 4 were heterozygous for the H allele. Based on these genotypes, penetrances of the H/H and R/H genotype are 1.0 and 0.95, respectively. However, a gluteal muscle biopsy is not a 100% sensitive diagnostic test, and the 4 control horses that were heterozygous for the H allele may have been false negatives and represent phenotypic error [17]. Segregation of the H allele with PSSM was confirmed in a resource pedigree (supplementary Fig. 2).
The population of PSSM horses without the GYS1 H allele suggests either that the G to A substitution is not the causative mutation or that the PSSM affected horses without the G to A substitution are phenocopies. Sequencing from 480 bp upstream of the predicted promoter region through exon 1, the entire coding sequence and the 3’ UTR (301 bp) did not detect any additional sequence differences between affected and control horses. Furthermore, association analysis using the same ECA10p MS markers excluded this chromosomal locus and GYS1 as the cause of abnormal polysaccharide accumulation in GYS1 R/R PSSM Quarter Horses (supplementary Fig. 3) and strongly suggests a second non-GYS1 glycogenosis exists that also produces exertional rhabdomyolysis and skeletal muscle polysaccharide accumulation in Quarter Horses.
GYS1 mutation in diverse horse breeds
Despite similarities in histopathologic findings in different breeds, there is variability in clinical findings in PSSM across breeds [5]. 750 horses from diverse breeds diagnosed with PSSM on the basis of abnormal polysaccharide in skeletal muscle were genotyped for the GYS1 mutation. The His309 allele was found in either heterozygous or homozygous form in 356 horses from 15 different breeds including Quarter Horses, Paint horses, Appaloosa horses, 5 Draft horse breeds, 3 Warmblood breeds, the Morgan, Mustang, Rocky Mountain Horse breeds, as well as mixed breed horses and Warmblood horses of unspecified breed.
Haplotype analysis and allele age
If the G to A GYS1 mutation is identical by descent in multiple horse breeds, it suggests that it was present in the domestic horse population before the establishment of the diverse breeds known today, and it has been passed from established breeds to newer breeds by admixture at the time of new breed creation. 767 horses from the breeds containing the Arg309His mutation were genotyped for 45 SNP markers in the 2 Mb region surrounding GYS1. Missing genotypes and haplotype phase were inferred using fastPHASE 1.2 [26], and minimally conserved haplotype was determined using Haploview 4.0RC2 [27]. All chromosomes with the GYS1 A allele had a single conserved haplotype (Fig. 6). This conserved haplotype suggests that the A allele is identical by descent in all horse breeds. The conserved haplotype was the shortest in Belgian draft horses (357 Kb), consistent with the earlier origin of the Belgian breed and more decay of LD around the mutation. Quarter Horses, Paint horses and Appaloosas shared a larger conserved segment (618 Kb) likely due to the more recent origin of these breeds.
Figure 6. Conserved SNP haplotypes among breeds containing the GYS1 A (PSSM) allele.

Minimally conserved haplotype in all breeds is highlighted and the length in Kb in different breeds indicated on the right. The Kb on the horizontal position is the relative position of each SNP within the 2 Mb contig containing the GYS1 gene. The GYS1 A allele producing the Arg309His GS mutation is indicated at the 819 Kb position as the PSSMSNPEXON6 SNP.
The mean allele age of the GYS1 mutation, estimated with DMLE+ 2.0 [28], was 159 generations, median allele age was 163 generations, and mode was 153 generations. The range of generations with significant frequencies (p < 0.05) was 140 to 189, and 90% of iterations fell between 144 and 178 generations. With the mean generational interval in horses estimated to be approximately 8 years, we conclude that this mutation likely originated between 1200 to 1500 years ago [29], prior to the separation of the modern breeds known today.
DISCUSSION
Our results are consistent with the hypothesis that the PSSM phenotype in horses is due to a dominant gain of function mutation in the GYS1 gene that results in enhanced activity, and/or poor regulation of the mutant His309 enzyme. Support for a gain of function in GS resulting in a glycogenosis in mammals comes from mice over-expressing a rabbit skeletal muscle GS that is not inactivated by protein kinase catalyzed phosphorylation [30]. Similar to PSSM horses, these mice accumulate excessive abnormal polysaccharide in the cytoplasm of skeletal myocytes which disrupts normal myofibrillar ultrastructure [30–32]. The iodine absorption spectra of the abnormal polysaccharide in both GS over-expressing mice and PSSM horses is shifted to higher wavelengths, consistent with decreased branched structure of glycogen [11]. Lastly, when exercised to exhaustion the mice were able to utilize skeletal muscle glycogen and had an exaggerated increase in blood lactate, suggesting an increased rate of anaerobic glycogenolysis and glycolysis similar to PSSM horses [32].
The action of GS is the rate-limiting step in glycogen synthesis; therefore its enzymatic activity is tightly controlled. GS activity is not extensively regulated through GYS1 gene expression in mammals because of the need to rapidly change from glycogen synthesis to degradation [22]. Gain of function mutations are most commonly caused by increased expression of the mutant protein due to mutation in the promoter region of the gene. However, the GYS1 mutation identified in PSSM affected horses occurred in the coding sequence of exon 6, altering codon 309, and sequencing of the promoter and the 5’ UTR of the GS from PSSM affected horses did not demonstrate any sequence polymorphism. Furthermore, overexpression of GS in mammalian in vitro and in vivo systems, or in yeast systems, fails to result in glycogen accumulation, due to phosphorylation and inactivation of the overexpressed GS enzyme [24, 30, 33, 34]. Thus it is more likely that the glycogen accumulation in PSSM horse muscle is due to the Arg309His mutation and results from enhanced activity and/or poor regulation of the mutant enzyme.
The interaction between allosteric activation and covalent modification of GS by protein kinases may be best described by a three state model [25]. In this model, phosphorylated GS in the absence of G6P is in a low activity state (state I) and dephosphorylated GS in the absence of G6P is in an intermediate activity state (state II). Phosphorylated enzyme (state I) requires near saturation with G6P to reach a high activity state (state III), whereas dephosphorylated GS (state II) is converted to a high activity state (state III) by relatively low concentrations of G6P [25]. The increased activity of GS both in the presence and absence of G6P suggests that the Arg309His enzyme may be constitutively active in PSSM horses. However, data obtained from muscle homogenates make it difficult to determine if the increased GS activity is due to higher inherent enzyme activity, decreased response to phosphorylation, or altered sensitivity to allosteric activation by G6P.
The Arg309His mutation in PSSM horses occurs in a highly conserved region of GS. The importance of this residue and the highly conserved surrounding region has been demonstrated in both glycosyltransferase-3 (GT-3, mammalian and yeast) and glycosyltransferase-5 (GT-5, bacterial) families of GS. Mutation of the homologous residue in E. coli (Lys277) results in enzyme inactivation [35], while mutation of the adjacent residue in yeast (Gly310) results in enhanced activity [34]. Despite clear evidence that this region of the GS enzyme is important to overall activity, the mechanism by which an Arg309His mutation results in alteration of GS function in eukaryotes is unclear since the crystal structure has not been solved for any member of the GT-3 family and this region has not been well studied by mutagenesis in GT-3 GS. However, residues 305–314 are not among the homologous highly-conserved mammalian GT-3 residues implicated in glucosyl donor substrate binding [25, 36–43] or catalytic activity [34–36, 40, 44].
Constitutively active GS in PSSM could result from altered regulation by phosphorylation or enhanced sensitivity to allosteric activation by G6P. Residue 309 is distant to the known carboxyl and amino terminal phosphorylation sites in GT-3 GS, making it unlikely that it directly inhibits phosphorylation; however this does not rule out the mutation from causing resistance to negative regulation due to inappropriate response to phosphorylation, as observed in a Gly298Asp yeast mutant (Gly298 in yeast GS is analogous to Gly310 in mammalian GS) [34]. Altered enzyme activity in response to both negative regulation by phosphorylation and positive regulation by G6P could also potentially be due to the interaction of residues 305–314 with the C-terminal Arginine-rich cluster (R578A/R579A/R581A and R585A/R587A/R590A), a critical region of the GS enzyme which may act as a molecular switch allowing GS to toggle between states I, II and III.[25, 45], [46], [36]. The Arg309His mutation could therefore potentially interfere with the metabolic switch resulting in GS being continuously in an active form. Definitive evidence for this mutation altering the regulation of GS would necessitate further in vitro study of Arg309His enzyme kinetics.
GYS1 His309 allele frequencies range from 0.035 to 0.350 in different breeds, which is surprisingly high considering that it is associated with a dominantly inherited neuromuscular disease. The high prevalence of this mutation in modern horse breeds may be due to the inadvertent breeding of affected individuals that were not recognized as having a deleterious genetic disease. Clinical signs of PSSM can readily be ameliorated if horses receive consistent daily exercise and limited starch intake [4]. Thus, over most of the last 1200 years, when horses were used on a daily basis for work and transportation, and feed could be scarce, the GYS1 mutation might not have conferred a selectional disadvantage. However, in recent times horses have increasingly become companions that are exercised less frequently, housed in small spaces and fed high starch concentrates. In this management scenario, horses with the GYS1 His309 allele are more likely to develop muscle pain associated with PSSM [6]. It is conceivable that the GYS1 mutation may have previously conferred a selectional advantage due to promotion of an increased skeletal muscle glycogen content when feed sources were scare.
To date, no other naturally occurring gain of function mutations in GYS1 have been shown to cause a glycogen storage disease in any mammalian species. The related GYS2 gene, expressed in liver, has several known mutations that reduce GS enzyme activity and hepatic glycogen content, leading to fasting hypoglycemia [47]. Recently, a mutation in the human GYS1 gene resulting in a stop codon in exon 11, a recessively inherited cardiac and skeletal muscle glycogen deficiency, hypertrophic cardiomyopathy, and reduced exercise tolerance, has been described [48]. However, the dominantly inherited PSSM GYS1 mutation appears to result in an increased GS activity in skeletal muscle, making it a new form of glycogen storage disease. It may be useful to examine GYS1 as a candidate gene for the significant fraction of human glycogen storage myopathies with as yet undetermined molecular bases [49].
Horses are particularly useful for the study of metabolic myopathies as they are typically superb athletes bred for speed or endurance, and disturbances in any pathway involving energy metabolism or muscle function are readily apparent since they are not provided the option of being sedentary. Further understanding of the mechanism responsible for altered glycogen and glucose metabolism in the GYS1 and non-GYS1 forms of equine PSSM may also provide new insights into normal and abnormal regulation of muscle glycogen metabolism and the development of exertional rhabdomyolysis.
METHODS
Genome-wide association analysis
PSSM positive cases were selected from biopsy submissions to the Neuromuscular Disease Laboratory (NDL) at the University of Minnesota as well as from a population of Quarter Horses identified in a previous prevalence study [50]. Case criteria for a positive diagnosis of PSSM included: 1) the presence of (PAS)-positive, inclusions of polysaccharide in gluteal or semimembranosus muscle fibers that are typically amylase resistant, and 2) 1.5 to 2 times normal muscle glycogen levels, and/or 3) a clinical history of exertional rhabdomyolysis. Control Quarter Horses were also selected from horses biopsied in the prevalence study [50]. Control criteria included: 1) a normal gluteal muscle biopsy that verified the absence of abnormal PAS staining, 2) normal glycogen levels, and 3) no history of neuromuscular disease.
All horses (cases and controls) with registry information were tracked to the original breed founders (10–20 generations) and pedigrees were analyzed to determine the level of relatedness among individuals. Extended family groupings consisting of several individuals tracing back to a common ancestor within a short (2–8) generational interval were identified.
For the initial genome wide association study the goal was to maximize the length of linkage disequilibrium (LD) and minimize locus and genotypic heterogeneity in the study population, thus increasing the power to detect association [51]. This was accomplished by selecting 48 PSSM affected horses from the extended families identified in the pedigree analysis. Because the PSSM horses were closely related LD was maximized; minimal recombination would occur between microsatellite (MS) markers flanking the founder PSSM locus. Forty eight PSSM cases were selected from 3 extended families identified in the pedigree analysis (Supplemental Fig. 4) To avoid false inflation of association due to sampling of closely related individuals we did not include individuals that shared more genetic material than second cousins [52]. Control Quarter Horses were not related to the case cohort and were not more closely related than third cousins.
Sample sizes for the initial genome scan were estimated using a genetic power calculator using the following data [53]. Disease prevalence was set at 0.06 [50]; high risk allele frequency (A) at 0.04 (expected frequency of the PSSM mutation in the population if it is inherited as a dominant disease trait based on a conservative estimate of 6% prevalence in the Quarter Horse population); Aa and AA genotypic relative risks were set at 90 and 95 respectively. To estimate D’ and marker high risk allele frequency for power calculations, previously generated genotype data from forty-two markers across 7 different chromosomes from 96 PSSM and control Quarter Horses was analyzed [20]. The mean D’ value for marker pairs with significant allelic association was 0.47 and the mean allele frequency across all alleles of all markers was 0.15. Therefore, D’ was estimated at 0.47; and high risk allele frequency for the marker allele was set at 0.15. Based on these criteria 41.85 cases and an equal number of controls were required for 85% power with a 5% type I error rate (p=0.05), which is in agreement with other published calculations [54].
The initial 105 MS markers genotyped were selected from a group of markers known to be highly heterozygous in several breeds and were distributed across all 31 autosomes. DNA samples from case and control cohorts were genotyped for each MS marker using a Beckman CEQ8000 automated DNA fragment analyzer. The genotypes for each of the MS were used to compare allele frequencies in the case and control cohorts. The number of alleles of each size detected in each cohort were counted (n horses x 2 alleles/horse = 2n total alleles), and allele frequency in each cohort determined. Minor alleles, defined as any allele with a frequency less than 10 % in the entire study population (cases and controls), were summed for statistical analysis. Case and control cohort allele frequencies were compared with Pearson’s χ2 test of independence to determine if there was a significant difference between the allele distribution in the two cohorts [52].
Identification of a candidate causal mutation
The entire equine GYS1 DNA sequence was assembled from the NCBI trace files derived from the Broad Institute equine whole genome 7 x shotgun sequence. The predicted equine GYS1 sequences were used to design primers for PCR amplification and sequencing. The 5’ untranslated region (UTR) and exon 1 were PCR amplified from genomic DNA with two primer pairs (5’ACA GAG CTG AGG GCC AAT C / 5’CCG GCT CCC TGT TAC TCA AG and 5’AAA GAT CTC TGT GCT CCC TCA / 5’GGC CCT GCA GTG TAA CCT T). Exon 16 and the 3’ UTR were PCR amplified from genomic DNA with two primer pairs (5’GGG ATG TGG CTC AGA GAC TG/ 5’TAG CGG TAG CCC TGG GTC TG and 5’CTC CGC TCA CTC TGC AGT C/ 5’ACC TCT GGC ACC ACA GTA GG). Exons 2–15 were amplified from skeletal muscle cDNA prepared from an affected and control horse. cDNA was amplified using three overlapping primer pairs (5’GCA CTT TGT CCA TGT CCT CA / 5’TTT ATG GGC ACC TGG ACT TC, 5’GAG GCT CAG CAC CTA CTC AAG / 5’CAT CCC CAG TAT CTC CAC CA, and 5’TAT GAG CCT TGG GGC TAC AC / 5’CGA TGA AGA CAG TGA GCG CT).
Glycogen synthase activity in PSSM
Glycogen synthase activity was measured in flash frozen gluteal muscle biopsy samples from 17 PSSM and 15 control Quarter Horses (11 PSSM and 12 control without G6P). GS activity was assayed by measuring the incorporation of glucose from UDP-[U-14C] glucose into glycogen [55]. 20 mg of frozen muscle was added to homogenate solution (50 mM Tris Acetate, 20 mM NaF, 2 mM EDTA, 1 mM mercaptoethanol, pH 7.8) at 2% wt./vol and homogenates were made using a Potter Elvehjem handheld glass homogenizer. Samples were centrifuged at 4ºC and 1000 g for 10 min and supernatant saved for GS assay. GS activity was assayed by measuring the incorporation of glucose from UDP-[U-14C] glucose into glycogen [55] using 6.7 mg/ml de-ionized rabbit liver glycogen and 5 mM UDP-glucose (~ 150 cpm/nmol) [25] both with (maximal activity) and without 7.2 mM glucose-6-phosphate (G6P). 14C-labeled glycogen was spotted onto Whatman® no. 5 filter paper and washed in 66% ethanol for 20 min to remove UDP-[U-14C] glucose. Filters were washed with acetone for 5 min and dried before counting in a liquid scintillation counter. A unit of activity was defined as the amount of enzyme that catalyzed the transfer of 1 μmol glucose from UDP-glucose to glycogen in one minute. Data is expressed as units of GS activity per mg of GS protein. The −/+ glucose-6-phophate ratio was calculated by dividing the activity of GS in the absence of G6P by the activity in the presence of 7.2 mM G6P [25]. Significant differences in GS activity between PSSM and control horses were determined using an unpaired t-test. Significance level was set at p<0.05.
GYS1 allele frequency in Quarter Horses
The G to A base substitution identified in exon 6 was rapidly genotyped in PSSM and control horses using a restriction fragment length polymorphism (RFLP) assay. A 230 bp segment of DNA containing GYS1 exon 6 and the flanking intronic sequence was amplified by PCR (forward/reverse primer 5’TGA AAC ATG GGA CCT TCT CC / 5’AGC TGT CCC CTC CCT TAG AC). In horses without the G to A polymorphism a single restriction site for the enzyme HpyCH4 V is present in this fragment; in horses with the G to A polymorphism a second restriction site is created. Restriction fragments were resolved using 3% agarose gel electrophoresis.
GYS1 mutation in diverse horse breeds
Records from muscle biopsy submissions to the University of Minnesota Neuromuscular Diagnostic Laboratory between January 1996 and January 2007 were reviewed. Submissions from clinical cases and from research horses were included. 812 PSSM horses from 35 different breeds were identified from the Neuromuscular Disease Laboratory database. 750 cases had whole blood or tissue that was available for DNA isolation and genotyping for the GYS1 mutation. Genomic DNA was isolated from whole blood samples using the Genomic DNA Purification Kit (Gentra, Minneapolis, MN) according to the manufacturer’s protocol. When whole blood was not available, genomic DNA was isolated from muscle biopsies (frozen or formalized) using DNeasy Tissue Extraction Kit (Qiagen, Valencia, CA) according to the manufacturer’s protocol. The GYS1 genotype of each horse was obtained using the restriction fragment length polymorphism assay described above.
Haplotype analysis and allele age
43 SNPs were selected for genotyping from a group of 100 well-characterized SNPs in the 2 Mb region surrounding GYS1. SNPs were genotyped using the Sequenom platform. Primers were designed using SpectroDESIGNER software (www.sequenom.com/Seq_genotyping.html). The 43 SNP loci (Supplementary Table 1) were amplified in 4 multiplex PCR reactions with 1 to 28 primer pairs per reaction.
Missing genotypes and haplotype phase were inferred using fastPHASE 1.2 software [26], with the following options included in the algorithm: -H200 to increase the number of haplotypes sampled from the posterior distribution from a particular random start of the EM algorithm to 200 to minimize individual error; -KU30 –KL5 –Ki2 to increase the number of clusters considered (minimum of 5 to maximum of 30 at interval of 2) due to the large number of individuals and the complexity of the dataset due to large number of subpopulations; -u to incorporate subpopulation labels to deal with any deviation from Hardy Weinberg equilibrium (HWE) due to subpopulation differences in allele and haplotypic frequencies; -e to scan for genotype errors across all SNPs. Horses were grouped into subpopulations by breed. Minimally conserved haplotype was determined using Haploview 4.0 CR2 [27]. Data from individuals for a given breed were imported into Haploview as phased haplotypes. Markers were checked with default parameters of HWE p-value cut-off of p=0.001 and a minimum minor allele frequency of 0.001. The GYS1 exon 6 G/A SNP (responsible for the Arg309His mutation) was manually included, despite not achieving HWE cut-off, which was expected based on the cohort selection. Haplotype blocks were manually extended across SNPs on either side of the exon 6 SNP to determine the conserved haplotype around the GYS1 A allele. Haplotypes which occurred in less than 1% of the cohort were assumed to likely be due to genotyping error and were not considered.
GYS1 allele age was estimated using the DMLE+ 2.0 software [28]. Due to the need for an accurate estimation of disease prevalence in the population, only haplotype data from Quarter Horses, Paint Horses, Belgian and Percheron horses were included in the allele age estimation, because these breeds had GYS1 allele frequency data available from genotyping random hair root samples. Population growth rates for each of these breeds were determined using numbers for total registered population and new registries per year obtained from the breed registries. Weighted averages for allele frequency, population growth rate and proportion of disease chromosomes sampled were calculated based on the proportion total chromosomes accounted for by each breed (Supplementary Table 2). Weighted averages were used for parameter estimation in the DMLE+ input. Iterations were performed over ancestral states and mutation age but not mutation location or allele frequency. Mean allele age was calculated from the histogram data for the posterior distribution of the time since the original mutation.
Supplementary Material
Supplementary Figure 1: Range of p values from chi-square test of association for initial 105 microsatellites. Histogram depicting the range of p values from all 105 MS markers. Values included in each bin range from the label value to < the value of the following bin. For example bin 0.0001 includes all MS with a p value of 0.0001 to <0.001.
Supplementary Figure 2: Segregation of GYS1 genotypes with the PSSM phenotype. The pedigree is from a multi-year breeding trial at the University of Minnesota. Filled symbols represent individuals with PSSM based on the presence of abnormal polysaccharide in skeletal muscle fibers and open symbols indicate a normal biopsy result. The Arg309His genotype of each horse is provided beneath its symbol.
Supplementary Figure 3: ECA10p p values R/R PSSM. P values for chi square test of association between MS markers and PSSM phenotype in R/R.
Supplementary Figure 4: Extended PSSM pedigrees. Extended pedigrees from the three PSSM families used for the related case cohort in the whole genome association. Square symbols denote males, circles denote females, filled symbols denote PSSM affected based on histopathology, X through the symbol indicates not tested, N indicates phenotyped normal based on histopathology, arrows at top right of symbol indicate horses that demonstrated signs consistent with PSSM based on owner/breeder interview (not phenotyped by biopsy). Figures S4a, S4b, S4c, and S4d represent a single large extended family. Individuals circled in 2a represent founders of the subsequent pedigrees, S4b, S4c and S4d. Figures S4e and S4f represent 2 additional extended families from which individuals were selected for inclusion in the case cohort.
Figure S4a: 8 phenotyped individuals, 7 with PSSM originating from EC. Individuals circled represent founders of the subsequent pedigrees, 2b, 2c and 2d.
Figure S4b: 37 phenotyped individuals, 22 with PSSM originating from GF a grandson of EC.
Figure S4c: 8 phenotyped individuals, 8 with PSSM originating from GE a grandson of EC.
Figure S4d: 15 phenotyped individuals, 10 with PSSM originating from LBE or EBR, full siblings who are grandsons of EC.
Figure S4e: 17 phenotyped individuals, 15 with PSSM originating from SDB.
Figure S4f: 18 phenotyped individuals, 12 with PSSM originating from PI.
Supplementary Table 1: Sequenom SNPs. Position and relative distance from GYS1 of ECA10p SNPs used in Sequenom assay
Supplementary Table 2: Allele age estimation. Estimations of allele frequency, population growth rate, and proportion of disease chromosomes sampled, and calculation of weighted averages used in allele age approximation.
Acknowledgments
Funding provided by American Quarter Horse Association (Genetic Analysis of Glycogen Storage Disorders in Quarter Horses), the Morris Animal Foundation (DO5EQ-028 Horse Genomics: Linear Mapping and Microarray Development) and the National Institutes of Health (NIH T32 RR018719-02 Comparative Medicine and Pathology Training, M.E. McCue, salary support).
Footnotes
GenBank accession numbers: equine_GYS1_5'_exon1 EU373800, equine_GYS1_cDNA EU373801, equine_GYS1_cDNA_PSSM_variant EU373802, equine_GYS1_exon16_3' EU373803
Publisher's Disclaimer: This is a PDF file of an unedited manuscript that has been accepted for publication. As a service to our customers we are providing this early version of the manuscript. The manuscript will undergo copyediting, typesetting, and review of the resulting proof before it is published in its final citable form. Please note that during the production process errors may be discovered which could affect the content, and all legal disclaimers that apply to the journal pertain.
Reference List
- 1.Valberg SJ, MacLeay JM, Billstrom JA, Hower-Moritz MA, Mickelson JR. Skeletal muscle metabolic response to exercise in horses with 'tying-up' due to polysaccharide storage myopathy. Equine Vet J. 1999;31:43–47. doi: 10.1111/j.2042-3306.1999.tb03789.x. [DOI] [PubMed] [Google Scholar]
- 2.Valberg SJ, Cardinet GH, III, Carlson GP, DiMauro S. Polysaccharide storage myopathy associated with recurrent exertional rhabdomyolysis in horses. Neuromuscul Disord. 1992;2:351–359. doi: 10.1016/s0960-8966(06)80006-4. [DOI] [PubMed] [Google Scholar]
- 3.Valberg SJ, Geyer C, Sorum SA, Cardinet GH., III Familial basis of exertional rhabdomyolysis in quarter horse-related breeds. Am J Vet Res. 1996;57:286–290. [PubMed] [Google Scholar]
- 4.Ribeiro WP, Valberg SJ, Pagan JD, Gustavsson BE. The effect of varying dietary starch and fat content on serum creatine kinase activity and substrate availability in equine polysaccharide storage myopathy. J Vet Intern Med. 2004;18:887–894. doi: 10.1892/0891-6640(2004)18<887:teovds>2.0.co;2. [DOI] [PubMed] [Google Scholar]
- 5.McCue ME, Riberio W, Valberg SJ. Prevalence of polysaccharide storage myopathy in horses with neuromuscular disorders. Equine Veterinary Journal. 2006;36:340–344. doi: 10.1111/j.2042-3306.2006.tb05565.x. [DOI] [PubMed] [Google Scholar]
- 6.Firshman AM, Valberg SJ, Bender JB, Finno CJ. Epidemiologic characteristics and management of polysaccharide storage myopathy in Quarter Horses. Am J Vet Res. 2003;64:1319–1327. doi: 10.2460/ajvr.2003.64.1319. [DOI] [PubMed] [Google Scholar]
- 7.De La Corte FD, Valberg SJ, MacLeay JM, Mickelson JR. Developmental onset of polysaccharide storage myopathy in 4 Quarter Horse foals. J Vet Intern Med. 2002;16:581–587. doi: 10.1892/0891-6640(2002)016<0581:doopsm>2.3.co;2. [DOI] [PubMed] [Google Scholar]
- 8.De La Corte FD, Valberg SJ, Mickelson JR, Hower-Moritz M. Blood glucose clearance after feeding and exercise in polysaccharide storage myopathy. Equine Vet J Suppl. 1999;30:324–328. doi: 10.1111/j.2042-3306.1999.tb05242.x. [DOI] [PubMed] [Google Scholar]
- 9.De La Corte FD, Valberg SJ, MacLeay JM, Williamson SE, Mickelson JR. Glucose uptake in horses with polysaccharide storage myopathy. Am J Vet Res. 1999;60:458–462. [PubMed] [Google Scholar]
- 10.Annandale EJ, Valberg SJ, Mickelson JR, Seaquist ER. Insulin sensitivity and skeletal muscle glucose transport in horses with equine polysaccharide storage myopathy. Neuromuscul Disord. 2004;14:666–674. doi: 10.1016/j.nmd.2004.05.007. [DOI] [PubMed] [Google Scholar]
- 11.Annandale EJ, Valberg SJ, Essen Gustavsson B. The effects of submaximal excercise of adenine nucleotide concentrations in skeletal muscle fibers of horses with polysaccharide storage myopathy. Am J Vet Res. 2005;66:839–845. doi: 10.2460/ajvr.2005.66.839. [DOI] [PubMed] [Google Scholar]
- 12.Firshman AM, Baird JD, Valberg SJ. Prevalences and clinical signs of polysaccharide storage myopathy and shivers in Belgian draft horses. J Am Vet Med Assoc. 2005;227:1958–1964. doi: 10.2460/javma.2005.227.1958. [DOI] [PubMed] [Google Scholar]
- 13.Valentine BA, et al. Incidence of polysaccharide storage myopathy in draft horse-related breeds: a necropsy study of 37 horses and a mule. J Vet Diagn Invest. 2001;13:63–68. doi: 10.1177/104063870101300112. [DOI] [PubMed] [Google Scholar]
- 14.Valentine BA, McDonough SP, Chang YF, Vonderchek AJ. Polysaccharide storage myopathy in Morgan, Arabian, and Standardbred related horses and Welsh-cross ponies. Vet Pathol. 2000;37:193–196. doi: 10.1354/vp.37-2-193. [DOI] [PubMed] [Google Scholar]
- 15.Valentine BA, Cooper BJ. Incidence of polysaccharide storage myopathy: necropsy study of 225 horses. Vet Pathol. 2005;42:823–827. doi: 10.1354/vp.42-6-823. [DOI] [PubMed] [Google Scholar]
- 16.Carlstrom B. Uber die atiologie und pathogenese der kreuzlahme des pferdes (Hemaglobinaemia paralytica) Scandinav Archiv. 1932;62:1–62. [Google Scholar]
- 17.McCue ME, Valberg SJ. Estimated prevalence of polysaccharide storage myopathy among overtly healthy Quarter Horses in the United States. J Am Vet Med Assoc. 2007;231:746–750. doi: 10.2460/javma.231.5.746. [DOI] [PubMed] [Google Scholar]
- 18.Valberg SJ, Townsend D, Mickelson JR. Skeletal muscle glycolytic capacity and phosphofructokinase regulation in horses with polysaccharide storage myopathy. Am J Vet Res. 1998;59:782–785. [PubMed] [Google Scholar]
- 19.Valberg SJ, MacLeay JM, Billstrom JA, Hower-Moritz MA, Mickelson JR. Skeletal muscle metabolic response to exercise in horses with 'tying-up' due to polysaccharide storage myopathy. Equine Vet J. 1999;31:43–47. doi: 10.1111/j.2042-3306.1999.tb03789.x. [DOI] [PubMed] [Google Scholar]
- 20.Dranchak P, et al. Biochemical and genetic evaluation of the role of AMPK in equine polysaccharide storage myopathy. Am J Vet Res. 2007 doi: 10.2460/ajvr.68.10.1079. [DOI] [PubMed] [Google Scholar]
- 21.Candice B, et al. A high-resolution physical map of equine homologs of HSA19 shows divergent evolution compared with other mammals. Mammalian Genome. 2005;V16:631–649. doi: 10.1007/s00335-005-0023-1. [DOI] [PubMed] [Google Scholar]
- 22.Roach PJ. Glycogen and its metabolism. Curr Mol Med. 2002;2:101–120. doi: 10.2174/1566524024605761. [DOI] [PubMed] [Google Scholar]
- 23.McGrane MM. Charbohydrate Metabolism Synthesis and Oxidation. In: Stipanuk MH, editor. Biochemical and Physiological Aspects of Human Nutrition. Saunders, Ithaca: 2000. pp. 158–210. [Google Scholar]
- 24.Skurat AV, Peng HL, Chang HY, Cannon JF, Roach PJ. Rate-Determining Steps in the Biosynthesis of Glycogen in COS Cells. Archives of Biochemistry and Biophysics. 1996;328:283–288. doi: 10.1006/abbi.1996.0174. [DOI] [PubMed] [Google Scholar]
- 25.Pederson BA, Cheng C, Wilson WA, Roach PJ. Regulation of glycogen synthase. Identification of residues involved in regulation by the allosteric ligand glucose-6-P and by phosphorylation. J Biol Chem. 2000;275:27753–27761. doi: 10.1074/jbc.M003342200. [DOI] [PubMed] [Google Scholar]
- 26.Scheet P, Stephens M. A fast and flexible statistical model for large-scale population genotype data: applications to inferring missing genotypes and haplotypic phase. Am J Hum Genet. 2006;78:629–644. doi: 10.1086/502802. [DOI] [PMC free article] [PubMed] [Google Scholar]
- 27.Barrett JC, Fry B, Maller J, Daly MJ. Haploview: analysis and visualization of LD and haplotype maps. Bioinformatics. 2005;21:263–265. doi: 10.1093/bioinformatics/bth457. [DOI] [PubMed] [Google Scholar]
- 28.Rannala B, Reeve JP. Joint Bayesian estimation of mutation location and age using linkage disequilibrium. Pac Symp Biocomput. 2003:526–534. doi: 10.1142/9789812776303_0049. [DOI] [PubMed] [Google Scholar]
- 29.Ollivier L. Situation and justification of the conservation of animal genetics resources in Europe. Naturzale. 1999;14:17–27. [Google Scholar]
- 30.Manchester J, Skurat AV, Roach P, Hauschka SD, Lawrence JC., Jr Increased glycogen accumulation in transgenic mice overexpressing glycogen synthase in skeletalámuscle. PNAS. 1996;93:10707–10711. doi: 10.1073/pnas.93.20.10707. [DOI] [PMC free article] [PubMed] [Google Scholar]
- 31.Raben N, et al. Surprises of genetic engineering: a possible model of polyglucosan body disease. Neurology. 2001;56:1739–1745. doi: 10.1212/wnl.56.12.1739. [DOI] [PubMed] [Google Scholar]
- 32.Pederson BA, et al. Mice with elevated muscle glycogen stores do not have improved exercise performance. Biochemical and Biophysical Research Communications. 2005;331:491–496. doi: 10.1016/j.bbrc.2005.03.206. [DOI] [PubMed] [Google Scholar]
- 33.Skurat AV, Wang Y, Roach PJ. Rabbit skeletal muscle glycogen synthase expressed in COS cells. Identification of regulatory phosphorylation sites. J Biol Chem. 1994;269:25534–25542. [PubMed] [Google Scholar]
- 34.Anderson C, Tatchell K. Hyperactive Glycogen Synthase Mutants of Saccharomyces cerevisiae Suppress the glc7-1 Protein Phosphatase Mutant. J Bacteriol. 2001;183:821–829. doi: 10.1128/JB.183.3.821-829.2001. [DOI] [PMC free article] [PubMed] [Google Scholar]
- 35.Furukawa K, Tagaya M, Tanizawa K, Fukui T. Identification of Lys277 at the active site of Escherichia coli glycogen synthase. Application of affinity labeling combined with site-directed mutagenesis. J Biol Chem. 1994;269:868–871. [PubMed] [Google Scholar]
- 36.Buschiazzo A, et al. Crystal structure of glycogen synthase: homologous enzymes catalyze glycogen synthesis and degradation. EMBO J. 2004;23:3196–3205. doi: 10.1038/sj.emboj.7600324. [DOI] [PMC free article] [PubMed] [Google Scholar]
- 37.Furukawa K, Tagaya M, Inouye M, Preiss J, Fukui T. Identification of lysine 15 at the active site in Escherichia coli glycogen synthase. Conservation of Lys-X-Gly-Gly sequence in the bacterial and mammalian enzymes. J Biol Chem. 1990;265:2086–2090. [PubMed] [Google Scholar]
- 38.Mahrenholz AM, Wang YH, Roach PJ. Catalytic site of rabbit glycogen synthase isozymes. Identification of an active site lysine close to the amino terminus of the subunit. J Biol Chem. 1988;263:10561–10567. [PubMed] [Google Scholar]
- 39.Furukawa K, Tagaya M, Tanizawa K, Fukui T. Role of the conserved Lys-X-Gly-Gly sequence at the ADP-glucose-binding site in Escherichia coli glycogen synthase. J Biol Chem. 1993;268:23837–23842. [PubMed] [Google Scholar]
- 40.Yep A, Ballicora MA, Preiss J. The active site of the Escherichia coli glycogen synthase is similar to the active site of retaining GT-B glycosyltransferases. Biochemical and Biophysical Research Communications. 2004;316:960–966. doi: 10.1016/j.bbrc.2004.02.136. [DOI] [PubMed] [Google Scholar]
- 41.Yep A, Ballicora MA, Sivak MN, Preiss J. Identification and Characterization of a Critical Region in the Glycogen Synthase from Escherichia coli. J Biol Chem. 2004;279:8359–8367. doi: 10.1074/jbc.M312686200. [DOI] [PubMed] [Google Scholar]
- 42.Yep A, Ballicora MA, Preiss J. The ADP-glucose binding site of the Escherichia coli glycogen synthase. Arch Biochem Biophys. 2006;453:188–196. doi: 10.1016/j.abb.2006.07.003. [DOI] [PubMed] [Google Scholar]
- 43.Tagaya M, Nakano K, Fukui T. A new affinity labeling reagent for the active site of glycogen synthase. Uridine diphosphopyridoxal. J Biol Chem. 1985;260:6670–6676. [PubMed] [Google Scholar]
- 44.Cid E, Gomis RR, Geremia RA, Guinovart JJ, Ferrer JC. Identification of Two Essential Glutamic Acid Residues in Glycogen Synthase. J Biol Chem. 2000;275:33614–33621. doi: 10.1074/jbc.M005358200. [DOI] [PubMed] [Google Scholar]
- 45.Pederson BA, Wilson WA, Roach PJ. Glycogen Synthase Sensitivity to Glucose-6-P Is Important for Controlling Glycogen Accumulation in Saccharomyces cerevisiae. J Biol Chem. 2004;279:13764–13768. doi: 10.1074/jbc.M312335200. [DOI] [PubMed] [Google Scholar]
- 46.Hanashiro I, Roach PJ. Mutations of Muscle Glycogen Synthase That Disable Activation by Glucose 6-Phosphate. Archives of Biochemistry and Biophysics. 2002;397:286–292. doi: 10.1006/abbi.2001.2623. [DOI] [PubMed] [Google Scholar]
- 47.DiMauro S, Hayes AP, Tsujino S. Nonlysosmal Glycogenoses. In: Engel AG, Franzini-Armstrong C, editors. Myology. McGraw-Hill; New York: 2004. pp. 1535–1558. [Google Scholar]
- 48.Kollberg G, et al. Cardiomyopathy and exercise intolerance in muscle glycogen storage disease 0. N Engl J Med. 2007;357:1507–1514. doi: 10.1056/NEJMoa066691. [DOI] [PubMed] [Google Scholar]
- 49.DiMauro S, Tsujino S, Shanske S, Rowland LP. Biochemistry and molecular genetics of human glycogenoses: an overview. Muscle Nerve. 1995;3:S10–S17. doi: 10.1002/mus.880181405. [DOI] [PubMed] [Google Scholar]
- 50.McCue ME, Ribeiro WP, Valberg SJ. The prevalence of polysaccharide storage myopathy in Quarter Horses. J Vet Intern Med. 2006;20:710. doi: 10.1111/j.2042-3306.2006.tb05565.x. [DOI] [PubMed] [Google Scholar]
- 51.Heutink P, Oostra BA. Gene finding in genetically isolated populations. Hum Mol Genet. 2002;11:2507–2515. doi: 10.1093/hmg/11.20.2507. [DOI] [PubMed] [Google Scholar]
- 52.Ott J. Nonparametric Methods, Analysis of Human Genetic Linkage. The John Hopkins University Press; Baltimore: 1999. pp. 272–296. [Google Scholar]
- 53.Purcell S, Cherny SS, Sham PC. Genetic Power Calculator: design of linkage and association genetic mapping studies of complex traits. Bioinformatics. 2003;19:149–150. doi: 10.1093/bioinformatics/19.1.149. [DOI] [PubMed] [Google Scholar]
- 54.Chapman NH, Wijsman EM. Genome screens using linkage disequilibrium tests: optimal marker characteristics and feasibility. Am J Hum Genet. 1998;63:1872–1885. doi: 10.1086/302139. [DOI] [PMC free article] [PubMed] [Google Scholar]
- 55.Thomas JA, Schlender KK, Larner J. A rapid filter paper assay for UDPglucose-glycogen glucosyltransferase, including an improved biosynthesis of UDP-14C-glucose. Analytical Biochemistry. 1968;25:486–499. doi: 10.1016/0003-2697(68)90127-9. [DOI] [PubMed] [Google Scholar]
Associated Data
This section collects any data citations, data availability statements, or supplementary materials included in this article.
Supplementary Materials
Supplementary Figure 1: Range of p values from chi-square test of association for initial 105 microsatellites. Histogram depicting the range of p values from all 105 MS markers. Values included in each bin range from the label value to < the value of the following bin. For example bin 0.0001 includes all MS with a p value of 0.0001 to <0.001.
Supplementary Figure 2: Segregation of GYS1 genotypes with the PSSM phenotype. The pedigree is from a multi-year breeding trial at the University of Minnesota. Filled symbols represent individuals with PSSM based on the presence of abnormal polysaccharide in skeletal muscle fibers and open symbols indicate a normal biopsy result. The Arg309His genotype of each horse is provided beneath its symbol.
Supplementary Figure 3: ECA10p p values R/R PSSM. P values for chi square test of association between MS markers and PSSM phenotype in R/R.
Supplementary Figure 4: Extended PSSM pedigrees. Extended pedigrees from the three PSSM families used for the related case cohort in the whole genome association. Square symbols denote males, circles denote females, filled symbols denote PSSM affected based on histopathology, X through the symbol indicates not tested, N indicates phenotyped normal based on histopathology, arrows at top right of symbol indicate horses that demonstrated signs consistent with PSSM based on owner/breeder interview (not phenotyped by biopsy). Figures S4a, S4b, S4c, and S4d represent a single large extended family. Individuals circled in 2a represent founders of the subsequent pedigrees, S4b, S4c and S4d. Figures S4e and S4f represent 2 additional extended families from which individuals were selected for inclusion in the case cohort.
Figure S4a: 8 phenotyped individuals, 7 with PSSM originating from EC. Individuals circled represent founders of the subsequent pedigrees, 2b, 2c and 2d.
Figure S4b: 37 phenotyped individuals, 22 with PSSM originating from GF a grandson of EC.
Figure S4c: 8 phenotyped individuals, 8 with PSSM originating from GE a grandson of EC.
Figure S4d: 15 phenotyped individuals, 10 with PSSM originating from LBE or EBR, full siblings who are grandsons of EC.
Figure S4e: 17 phenotyped individuals, 15 with PSSM originating from SDB.
Figure S4f: 18 phenotyped individuals, 12 with PSSM originating from PI.
Supplementary Table 1: Sequenom SNPs. Position and relative distance from GYS1 of ECA10p SNPs used in Sequenom assay
Supplementary Table 2: Allele age estimation. Estimations of allele frequency, population growth rate, and proportion of disease chromosomes sampled, and calculation of weighted averages used in allele age approximation.