

Abstract
Objective
This longitudinal study used FDG-PET imaging to predict and monitor cognitive decline from normal aging.
Methods
Seventy-seven 50–80 year old normal (NL) elderly received longitudinal clinical examinations over 6–14 years (561 person-years, mean per person 7.2 years). All subjects had a baseline FDG-PET scan and 55 subjects received follow-up PET exams. Glucose metabolic rates (MRglc) in the hippocampus and cortical regions were examined as predictors and correlates of clinical decline.
Results
Eleven NL subjects developed dementia, including 6 with Alzheimer’s disease (AD), and 19 declined to Mild Cognitive Impairment (MCI), on average 8 years after the baseline exam. The baseline hippocampal MRglc predicted decline from NL to AD (81% accuracy), including 2 post-mortem confirmed cases, from NL to other dementias (77% accuracy), and from NL to MCI (71% accuracy). Greater rates of hippocampal and cortical MRglc reductions were found in the declining as compared to the non-declining NL.
Conclusions
Hippocampal MRglc reductions using FDG-PET during normal aging predict cognitive decline years in advance of the clinical diagnosis. Future studies are needed to increase preclinical specificity in differentiating dementing disorders.
Keywords: Alzheimer’s disease, early detection, glucose metabolism, hippocampus, mild cognitive impairment, normal aging
INTRODUCTION
The development of biomarkers for the preclinical detection of neurodegenerative disease is a vital step in developing prevention therapies. Testing a candidate marker for Alzheimer’s disease (AD) or other dementias requires monitoring normal healthy elderly longitudinally until they express the clinical symptoms and receive the ultimate diagnostic confirmation. A suitably sensitive biomarker must accurately predict the clinical endpoint and demonstrate correlated progression with the clinical course of the disease [18]. The low incidence and slow progression of normal elderly to dementia [44] has been a major obstacle in the design of studies to identify brain predictors of future cognitive impairment.
Positron Emission Tomography (PET) imaging with 2-[18F]fluoro-2-Deoxy-D-glucose (FDG) is a candidate modality for detecting the preclinical stages of dementia by measuring reductions in the cerebral metabolic rate for glucose (MRglc). FDG-PET studies show that brain MRglc is consistently reduced in AD and other major neurodegenerative disorders, as well as in Mild Cognitive Impairment (MCI), a condition at high-risk for developing dementia [21, 44], the extent of the metabolic reduction being related to disease severity (see [37, 42] for review). However, very little work has been done with FDG-PET to study the transition from normal aging to AD and other dementing disorders. FDG-PET studies show reduced brain MRglc in normal individuals at genetic risk for late-onset AD [47, 54], but there are no longitudinal follow up studies documenting decline to MCI or AD in these subjects. In a previous FDG-PET study we examined the decline from normal aging to MCI, and reported that baseline hypometabolism in the hippocampal formation, a known early target site for pathology [4], predicts an MCI diagnosis [8]. However, this initial study with a small sample size was limited by a single 3-year follow-up examination and to a clinical endpoint of MCI. Therefore, uncertainty remains as to whether the brain abnormalities detected were due to AD.
The present longitudinal FDG-PET study in normal elderly subjects examines regional brain MRglc as a predictor and correlate of cognitive decline from normal aging over 6 to 14 years (for a total of 561 person-years, mean per person 7.2 years). This study expands on our prior work by expanding the sample size from 23 to 77 longitudinally followed subjects, increasing the number of follow-ups, and observing 11 subjects developing dementia, 6 of whom diagnosed with AD with 2 post-mortem confirmed diagnoses. Using a newly developed automated hippocampal sampling procedure [40], we demonstrate that hippocampal MRglc is a sensitive preclinical predictor of future cognitive impairment, as well as a longitudinal correlate of the decline from normal aging.
METHOD
Subjects screening and diagnostic examinations
In response to public announcements at the Center for Brain Health at the New York University (NYU) School of Medicine, after extensive baseline evaluations which were repeated at each successive follow-up, a longitudinal study in 77 normal (NL) elderly subjects was completed, which included medical (history, physical, and laboratory), neurological, psychiatric, neuropsychological, clinical MRI, and FDG-PET examinations. This study was embedded in an ongoing NYU longitudinal clinical project that has been going on for over 20 years. The baseline examination was obtained at the time of the first PET examination in 1990, and the last clinical examination was performed in 2004, for a maximum follow-up interval of 14 years. Informed consent was obtained from all subjects, and from a caregiver for those patients that were diagnosed with dementia. The study was approved by the NYU and Brookhaven National Laboratory (Upton, NY) institutional review boards.
Exclusion criteria
Subjects were excluded in presence of conditions affecting brain structure or function, e.g., any degenerative brain diseases, stroke, clinically unmanaged diabetes, significant head trauma history, clinical evidence of depression, and use of cognitively active medications.
Inclusion criteria
At baseline, all subjects were 50–80 years of age, had a minimum of 12 years education, Mini Mental Status Examination (MMSE) [15] scores ≥28 and, on a clinical interview based on the Global Deterioration Scale (GDS) [48] received scores of 1 or 2. The GDS is a seven-point rating scale assessing cognitive and functional capacity, where scores of 1 and 2 indicate NL functioning subjects. GDS 1 subjects report no memory complaints. GDS 2 subjects typically complain of occasional memory deficits (i.e., forgetting names or forgetting where one placed objects) in the absence of any clinically recognizable functional changes.
Outcome groups
All diagnoses were made at a consensus meeting reviewing all medical and laboratory findings. The diagnosis of dementia was made on the basis of a clinical interview that included informant corroboration and using standard clinical criteria for dementia [2, 23, 31], which require significant deficits in activities of daily living (ADL) and deficits in two or more cognitive domains, and GDS scores ≥ 4 [48]. A diagnosis of MCI was based on a clinician interview reporting evidence for reduced cognitive capacity from a prior level of functioning, but with normal ADL, normal general intelligence, and no dementia. The MCI diagnosis was supported by the patient’s subjective memory complaints and testimony from a knowledgeable collateral source, resulting in a GDS = 3 [48]. The longitudinal FDG-PET study was completed only for subjects with diagnoses of NL, MCI or AD.
Neuropsychological evaluations
The psychometric battery included the MMSE, immediate and delayed paragraph recall and verbal paired associates, the designs test, the digit-symbol substitution test, and the object-naming test [8, 9]. Neuropsychological evaluations were completed at each examination. Each subject was Z-scored relative to an appropriate age- and education-matched normal control group derived from a normative psychometric database comprised of 207 longitudinally confirmed NL elderly (55–85 years of age, ≥12 years of education; MMSE ≥ 28; and GDS = 1 or 2) that retained the diagnosis of NL for 4±2 years [10].
Brain Imaging
At all time points, the participants completed the clinical, FDG-PET and MRI exams within 3 months. The same PET and MRI scanners and scan protocols were used for all examinations.
FDG-PET study
FDG-PET scans were acquired at BNL on a CTI-931 scanner (Siemens, Knoxville, TN; 10 cm axial FOV, 20 cm transaxial FOV, 6.2 mm FWHM in-plane axial resolution, 6.7 mm cross-slice resolution, 6.75 mm inter-slice distance) as described [8, 9]. Each subject’s head was positioned using two orthogonal laser beams and imaged with the scanner tilted 25° negative to the canthomeatal plane. Subjects received 5–8 mCi of FDG intravenously while laying supine in a dimly lit room. PET images were obtained 35 minutes after injection and acquired over 20 minutes. Arterial blood samples were drawn at standard intervals throughout the study and the absolute glucose consumption rate was calculated using the Sokoloff equation [55] with standard kinetic constants [49]. We obtained and interleaved two 15-slice PET volumes that overlapped by a half-slice thickness (~3.4 mm) to improve the counting statistics and reduce tissue sampling errors [8]. Attenuation correction was obtained using 68Ga/68Ge transmission scans. Images were reconstructed using the Hanning filter with a frequency cut-off of 0.5 cycles/pixel, yielding 128×128 matrix with a pixel size of 1.56 mm.
MRI study
MRI scans were acquired on a 1.5 T GE Signa imager (General Electric, Milwaukee, USA) as previously described [8, 51]. All subjects received clinical and research MRI studies. The clinical MRI consisted of contiguous 3 mm axial T2-weighted images. The research MRI was a 124 sliceT1-weighted Fast-Gradient-Echo acquired in a coronal orientation as 1.3 mm thick sections (FOV=18 cm, NEX=1, matrix=256x128,TR= 35 ms, TE= 9 ms and FA=60°).
Image analysis
All PET scans were coregistered with the corresponding MRI. After MRI-coregistration, the PET scans were corrected for CSF partial volume effects [26] by using a 2-segment (i.e., brain tissue and CSF) partial volume correction (PVC) model [8, 9, 32]. Based on phantom validated threshold techniques, MRI regions are locally sampled to minimize RF coil inhomogeneity [50] and converted to binary images where pixels corresponding to brain are given a value of 1 and those corresponding to non-brain, such as CSF and air spaces, are given a value of 0. This binary image is convolved with the 3D point spread function of the PET camera, resulting in a recovery coefficient (RC) image, and the coregistered PET image is divided by the RC image to yield PET images corrected for the partial volume of CSF. All subsequent PET analyses were done with and without PVC. Statistical Parametric Mapping (SPM’2) [19] routines were used to spatially normalize the MRI scans to a custom-made standard MRI brain template [19, 40]. The spatial normalization process involves estimating the optimum (least squares) 12-parameter affine transformation, followed by an iterative estimate of local alignment based on a family of 7x8x7 discrete cosine functions [19]. The estimated parameters were then applied to spatially normalize the MRI-coregistered PET scans. The spatially normalized PET images were then resampled on a 105x126x91 matrix with a voxel size of 1.5x1.5x1.5 mm.
The HipMask sampling technique [40] was used to sample hippocampal metabolic rate for glucose (MRglc). This technique uses a probabilistic hippocampal masking image (HipMask) that samples only those portions of the hippocampus where the overlap across subjects is maximal after inter-subject averaging. For each PET, the sampling accuracy was verified on the coregistered MRI scans. The procedure has been validated against manual regions-of-interest measurements showing equivalent hippocampal metabolism sampling estimates in NL, MCI and AD [40]. Metabolic means (μmol/g/min) were computed and the hippocampal MRglc values averaged across hemispheres.
Given reports of consistent posterior cingulate cortex (PCC) MRglc abnormalities in MCI and early AD [7, 14, 35, 41], this region was examined using a region of interest (ROI) approach [40]. A masking image of the PCC was created in the space of the template with the SPM-compatible WFU Pick Atlas tool [30] [http://www.fmri.wfubmc.edu/] and was used as a standardized ROI. The PCC ROI sampled the gray matter of the retrosplenial cortex (Brodmann Areas, BA, 29/30) and the dorsal PCC (BA 23) [41]. The PCC ROI was applied to the spatially normalized PET scans to sample PCC MRglc (μmol/g/min).
SPM’2 was used to examine MRglc effects in the whole-brain on a voxel-wise basis. As per accepted methods, the spatially normalized PET scans were smoothed with a 12 mm FWHM Gaussian filter prior to group comparisons [19]. Only voxels with values greater than 80% of the whole brain mean MRglc were included in the analysis and only clusters exceeding an extent threshold of 30 voxels (i.e., >2 times the FWHM) were considered significant. Anatomical location of hypometabolic areas was described using the Talairach and Tournoux coordinates [56].
Statistical analysis
Our first aim was to test the hypothesis that hippocampal MRglc reductions during the normal stages of cognition are predictive of future cognitive decline. Our second aim was to determine whether greater rates of MRglc reduction correlate with the progression from normal aging to AD and MCI.
SPSS (version 12.0; Chicago, IL), SAS (version 8.02; SAS Institute Inc., Cary, NC) and SPM’2 [19] were used for data analyses. MRglc data were residualized for age and pons MRglc. Pons MRglc was sampled at the centre of a mid pontine slice with a 16 x 16 mm box [9, 40] and was used to adjust for variations in global MRglc [34].
The general linear model/univariate analysis (GLM) with post-hoc LSD tests and Chi-square (χ2) tests were used to test for clinical, neuropsychological and baseline MRglc differences across outcome groups in the examination of hypothesis 1. Logistic and Weibull survival regression models [25] were used to examine whether the probability of decline and the time to clinical decline can be predicted by the baseline MRglc measures, after controlling for age, gender, and education. Stepwise forward logistic regressions were used to examine the combined and incremental accuracy of the baseline MRglc measures as predictors of outcome. The reliability of the prediction models was assessed by cross-validation, using the leave-one-out classification method.
Hierarchical mixed (random) effects models were used in the examination of hypothesis 2 to calculate individual longitudinal trajectories of MRglc reductions over time after adjusting for subject-specific effects [12, 20] (Appendix, A). The individual trajectories were used to estimate the regional MRglc for each subject at the time of decline [12, 20] (Appendix, B). The GLM with post-hoc LSD tests was used to test for MRglc differences across outcome groups at the time of decline.
Linear regressions were applied to the baseline and longitudinal MRglc of the brain regions showing significant baseline and longitudinal group effects to estimate the average age of disease origin and the average number of years prior to diagnosis when statistical differentiation was possible across outcome groups [12]. This was accomplished by estimating the mean MRglc measures for each group every 0.5 years prior to the baseline after accounting for pons MRglc. For each time point the mean MRglc values were compared between groups using independent-sample t-tests.
In additional analyses, we compared MRglc in the hippocampus and PCC at baseline and at the time of decline between amnestic and non-amnestic NL-MCI subgroups [44], and between NL-MCI subgroups and NL-NL using the GLM/univariate analysis accounting for the same confounds as above.
Results were considered significant at p<.05. For the SPM analyses, the reporting criterion was p<.05, after correction for family-wise errors (FWE). As the FWE correction may be overly conservative in neuroimaging studies, results were also assessed at p<.001, uncorrected for multiple comparisons [19].
PET analyses were done with and without PVC. Results are first presented without PVC, and with PVC in a subsequent section.
RESULTS
CLINICAL AND NEUROPSYCHOLOGICAL STUDY
All 77 NL subjects received a baseline FDG-PET scan and at least 2 follow-up clinical evaluations during a total of 561 person-years of follow-up (mean per person 7.2 years). During this interval, 11/77 (14%) of the baseline NL subjects developed dementia, of whom 6 fulfilled criteria for probable AD (NL-AD). Of the other 5 decliners (NL-non AD), 3 subjects developed vascular dementia, 1 subject Parkinson’s disease and 1 subject Fronto-temporal dementia. Decline to MCI was observed in 19/77 (25%) subjects (NL-MCI). All NL-MCI subjects showed objective evidence for mild cognitive impairment on psychometric examination. This included 6 amnestic MCI subjects (memory scores ≥1.5 SD below the NL reference values [44]), 6 MCI with memory scores 1 SD below NL, and 7 with scores on attention or language tests 1 SD below NL without memory deficits. A total of 47/77 (61%) subjects remained normal (NL-NL). Clinical characteristics of these subjects are found in Table 1.
Table 1.
Baseline subjects characteristics by outcome groups.
| NL-NL | NL-MCI | NL-Dementia
|
||
|---|---|---|---|---|
| NL-AD | NL-non AD | |||
| N | 47 | 19 | 6 | 5 |
| Age (years) | 65(8) | 70(6)* | 72(5)* | 68(9) |
| [50–80] | [56–80] | [55–80] | [53–80] | |
| % Female | 61 | 68 | 67 | 67 |
| Education (years) | 16(2) | 16(2) | 16(3) | 16(1) |
| Neuropsychological measures | ||||
| MMSE | 29.4(1.1) | 29.4(0.7) | 29.3(0.8) | 29.5(0.4) |
| Designs | 6.8(2.7) | 7.2(2.5) | 5.8(3.4) | 6.4(3.8) |
| DSST | 56(12) | 54(8) | 52(7) | 52(10) |
| Naming | 57(3) | 57(3) | 53(7) | 55(4) |
| Paired associate-D | 5.6(2.7) | 5.5(2.5) | 4.2(3.9) | 4.2(2.9) |
| Paragraph recall-D | 9.7(2.9) | 9.5(3.0) | 8.1(2.5) | 8.8(4.2) |
| Vis Recog | 23(3) | 23(2) | 21(5) | 21(3) |
| FDG-PET MRglc measures (μmol/g/min) | ||||
| Hip | ||||
| Baseline | 30.8(5.3) | 26.3(5.5)** | 22.8(3.4)** « | 26.8(4.2)* |
| {31.3(4.4)} | {28.0(5.4)}* | {25.1(5.6)}** « | {27.4(4.2)}* | |
| Last examination a | 27.8(3.6) | 23.5(3.2)** | 17.3(3.4) ** ° | n.a. |
| {29.4(3.2)} | {24.7(3.3)} ** | {19.5(4.4)}** ° | ||
| PCC | ||||
| Baseline | 51.2(9.6) | 47.8(8.2) | 46.8(7.5) | 50.3(9.2) |
| {53.0(6.8)} | {51.5(7.4)} | {47.9(6.7)} | {52.4(6.9)} | |
| Last examination a | 42.9(6.9) | 36.1(5.9) | 24.8(6.2)**° | n.a. |
| {44.4(8.1)} | {40.2(6.9)} | {30.2(7.6)}**° | ||
| Pons | ||||
| Baseline | 28.3(4.9) | 27.9(4.8) | 26.4(4.3) | 30.0(5.2) |
| {28.4(3.7)} | {28.4(4.6)} | {27.9(3.2)} | {30.5(4.4)} | |
| Last examination a | 28.6(3.8) | 27.7(4.9) | 25.9(4.2) | n.a. |
| {29.2(4.7)} | {29.7(3.7)} | {27.5(3.6)} | ||
Values are means (SD) [range].
Abbreviations: D = delayed recall; DSST = digit symbol substitution test; Hip = hippocampus; MMSE = Mini Mental State Examination; MRglc = metabolic rate of glucose; n.a. = not administered; Naming = object naming; PCC = posterior cingulate cortex; Vis Recog = visual recognition.
MRglc values {partial-volume corrected} for Hip and PCC are pons-adjusted.
Significantly lower than NL-NL, p≤.05
Significantly lower than NL-NL, p≤.01
Significantly lower than NL-MCI, p<.01
Significantly lower than NL-non AD, p<.05
Longitudinal FDG PET examinations were performed in 55 subjects, including all 6 NL-AD, 19 NL-MCI, and 30 NL-NL.
The 5 subjects who developed other dementias were not enrolled in the longitudinal PET study but received at least one clinical follow-up visit. Of the remaining 72 subjects that were enrolled in the longitudinal PET study, 8 did not return for the follow-up PET but all 72 did return for at least 2 clinical follow-up visits. Nine NL-NL subjects completed the follow-up PET but were excluded from the longitudinal PET analysis due to technical reasons related to the scans (i.e., artifacts or incomplete head coverage which precluded image coregistration and size normalization of the PET scans, see below). Overall, all 77 subjects had a baseline FDG PET scan and follow-up clinical exams, and a total of 55/77 subjects (baseline age 67±6 years, 64% female, 17 subjects with GDS=1 and 38 with GDS=2) also received longitudinal PET scans. Of these 55 subjects, all had one follow-up PET study after 3±1 (range 2–4) years from the baseline, and 30/55 subjects also had a second follow-up PET study 9±2 (range 6–11) years from the baseline. The 30 subjects with the second follow-up PET included all the 6 NL-AD subjects, 9 NL-MCI, and 15 NL-NL.
With respect to the baseline, decline to AD was observed after 8±3 (range 6–14) years, decline to another dementia after 3±1 (range 2–5) years, and decline to MCI after 8±2 (range 4–12) years from baseline. All 6 NL-AD received a diagnosis of MCI before declining to AD, on average 3±1 (range 2–5) years after the baseline. This transition occurred in 5 subjects by the time of the second follow-up PET scan, and in 1 subject after the second follow-up PET. When the NL-AD patients were at the MCI stage, 5/6 fulfilled criteria for amnestic MCI [44]. Of the 19 NL-MCI subjects, 7 declined by the time of their first follow-up PET, 8 by the time of the second follow-up PET, and 4 after the second follow-up PET.
At baseline, when all subjects were clinically normal, those NL subjects that subsequently developed AD or MCI were on average 5 years older than the NL-NL (p’s=.05) (Table 1). There was no age difference between NL-NL and NL subjects that developed non-AD dementia. Age was included as a covariate in further analyses. The groups were otherwise comparable for educational level, gender, MMSE, and baseline neuropsychological measures (Table 1). All subjects showed baseline Z-scores <1 with respect to their age- and education-matched NL reference group on all neuropsychological tests administered. No differences were found in the time to last follow-up between NL-NL (7±3 years, range 6–14 years), NL-MCI (9±2 years, range 6–12 years) and NL-AD (8±3 years, range 6–14 years) (p>1) (Table 1). The subjects who developed other dementias were followed over a shorter time interval of 5±2 years (range 2–8).
FDG-PET STUDY
Differences between outcome groups at baseline
The baseline hippocampal MRglc was reduced for all declining groups as compared to NL-NL [F(3,75)=5.23, p=.002], with 20% reductions in the NL subjects that developed dementia (i.e., 26% reduced in NL-AD, p=.002, and 13% reduced in NL-non AD, p=.04), and 15% reductions in NL-MCI (p=.01) (Table 1 and Figure 1). Moreover, hippocampal MRglc was 15% lower in NL-AD as compared to NL-non AD (p=.01) (Table 1 and Figure 1). No significant differences were found between NL-AD and NL-MCI and between NL-non AD and NL-MCI (p’s>.1, n.s.)
Figure 1.
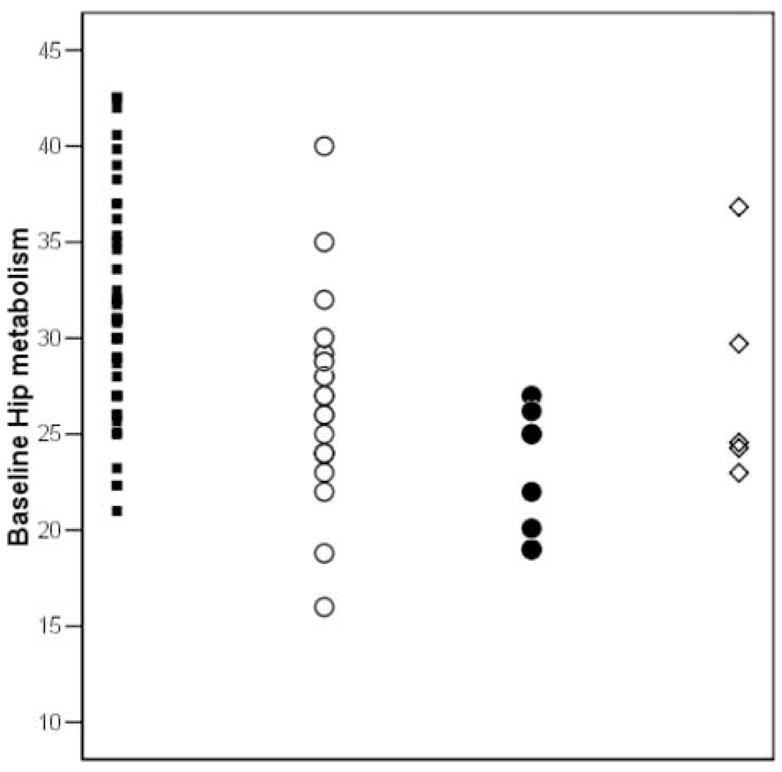
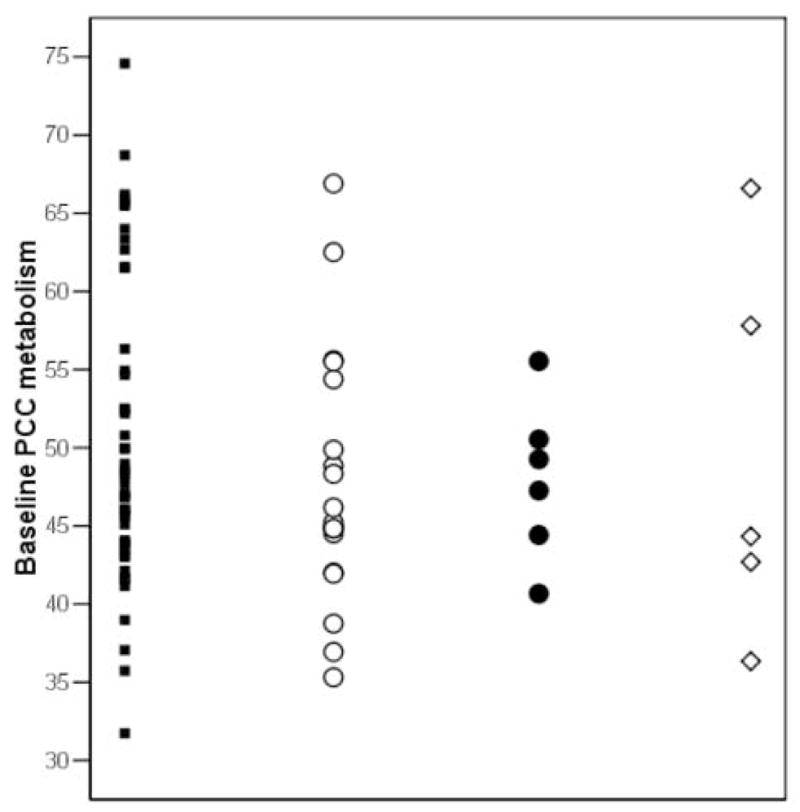
Pons-adjusted baseline hippocampal (Hip) and posterior cingulate cortex (PCC) glucose metabolism (μmol/g/min) by outcome group. Symbols: NL-NL (black squares), NL-MCI (white circles), NL-AD (black circles), and NL-non AD (white diamonds).
No baseline group differences were found for PCC MRglc (p=.34, n.s.) (Table 1). The baseline PCC MRglc in NL-AD was 9% reduced as compared to NL-NL, and 7% reduced as compared to NL-non AD, which did not reach statistical significance (p=.15, and p=.23, respectively, n.s.) (Table 1).
Using SPM, no cortical MRglc differences between groups were found at baseline, with or without correction for multiple comparisons.
Predicting who will decline
After accounting for age, education, and gender, the baseline hippocampal MRglc predicted future dementia with 82% sensitivity (9/11 decliners correctly identified) and 79% specificity (37/47 NL-NL) [79% accuracy, χ2(1)=6.2, p=.01, odds ratio (OR)=2.3, 95% CI=2.0–2.7]. Specifically, hippocampal MRglc correctly predicted decline from NL to AD with 83% sensitivity (5/6 NL-AD) and 81% specificity (38/47 NL-NL) [81% accuracy, χ2(1)=6.57, p<.01, OR=2.3, 95% CI=2.0–2.6], and predicted decline from NL to non-AD dementia with 80% sensitivity (4/5 NL-non AD) and 77% specificity (36/47 NL-NL) [77% accuracy, χ2(1)=6.71, p=.023, OR=2.1, 95% CI=1.4–2.4]. Hippocampal MRglc predicted decline from NL to MCI with 74% sensitivity (14/19 NL-MCI) and 70% specificity (33/47 NL-NL) [71% accuracy, χ2(1)=9.94, p=.01, OR=2.1, 95% CI=1.8–2.6].
Although both NL-AD and NL-non AD showed reduced baseline hippocampal MRglc as compared to NL-NL, the reduction was more severe in NL-AD as compared to NL-non AD (see above). As a result, the baseline hippocampal MRglc distinguished NL-AD from NL-non AD with 83% sensitivity (4/5 NL-AD) and 60% specificity (3/5 NL-non AD) [73% accuracy, χ2(1)=6.03, p=.014, OR=1.5, 95% CI=0.7–2.1]. The baseline hippocampal MRglc did not distinguish NL-AD from NL-MCI [χ2(1)=1.92, p=.19, n.s.], nor NL-non AD from NL-MCI [χ2(1)=1.86, p=.12, n.s.].
The baseline PCC MRglc did not significantly predict future cognitive decline from NL. Baseline PCC MRglc yielded 55% accuracy in predicting decline from NL to AD [67% sensitivity and 53% specificity, χ2(1)=1.26, p=.26, n.s.], 57% accuracy in predicting decline from NL to non-AD dementia [60% sensitivity and 57% specificity, χ2(1)=0.95, p=.33, n.s.], and 56% accuracy in predicting decline from NL to MCI [63% sensitivity and 53% specificity, χ2(1)=1.56, p=.21, n.s.]. The baseline PCC MRglc did not distinguish between NL-AD and NL-non AD [χ2(1)=2.15, p=.12, n.s], between NL-AD and NL-MCI [χ2(1)=1.84, p=.18, n.s]., and between NL-MCI and NL-non AD [χ2(1)=1.26, p=.23, n.s].
Combining the baseline hippocampal and PCC MRglc measures in the logistic regression model predicted decline from NL to AD with 83% sensitivity and 85% specificity [85% accuracy, χ2(2)=9.71, p=.008], from NL to non-AD dementia with 60% sensitivity and 81% specificity [79% accuracy, χ2(2)=4.12, p=.045], and from NL to MCI with 74% sensitivity and 70% specificity [71% accuracy, χ2(2)=6.56, p=.038]. Therefore, the prediction accuracy of the combined baseline hippocampal and PCC MRglc was not significantly higher than that of the baseline hippocampus alone, and adding the baseline PCC to the hippocampal MRglc did not significantly improve the prediction accuracy of the hippocampal MRglc measures for any comparisons [χ2 increment (1) range: 0.81–1.14, p’s>.1, n.s.].
Likewise, adding the baseline PCC to the hippocampal MRglc in the logistic regression model did not significantly improve the accuracy of the hippocampal MRglc measures in the discrimination between outcome groups [χ2 increment (1) range: 1.12–1.29, p’s>.1, n.s.]. It is worth noticing that, although the increment was not significant [χ2increment(1)=1.49, p=.22, n.s.], the combination of baseline hippocampal and PCC MRglc distinguished NL-AD from NL-non AD with 83% sensitivity and 80% specificity [82% accuracy, χ2(2)=7.52, p=.023]. The gain in specificity from 60%, as obtained by using the hippocampus alone, to 80% by using the combined hippocampus and PCC, derives from correctly classifying one additional NL-non AD subject that was misclassified as NL-AD by using the hippocampal MRglc alone.
Predicting the time to decline
Weibull regression models showed that baseline hippocampal MRglc is a statistically significant predictor of the time to cognitive decline [χ2(1)=4.5, p=.03]. For every unit decrease in baseline hippocampal MRglc, the time to decline to AD is decreased by 8.7% (95% CI: 3.0%–14.1%) [χ2(1)=8.6, p=.003], which corresponds to a time ratio (TR) of 1.1 (95% CI: 1.0–1.4) years; the time to decline to other dementias is decreased by 4.7% (95% CI: .3% – 8.9%) [χ2(1)=4.6, p<.05], for a TR of 1.0 (95% CI: 0.8–1.2) years; and the time to decline to MCI is decreased by 7.2% (95% CI: 2.8%–11.5%) [χ2(1)=9.93, p<.01], for a TR of 1.08 years (95% CI: 1.03–1.11). As shown in Figure 2, the prediction model shows that a baseline hippocampal MRglc ≤24 μpmol/g/min (corresponding to the average of the NL-AD group) predicts the median time to decline to be 7 years. For comparison, for baseline hippocampal MRglc 25–29 μpmol/g/min (corresponding to the average of the NL-MCI group) the predicted time to decline is about 9.5 years, while for baseline hippocampal MRglc ≥30 μpmol/g/min (corresponding to the average of the NL-NL group) the predicted time to decline is greater than 14 years and beyond the follow-up interval in our study.
Figure 2.
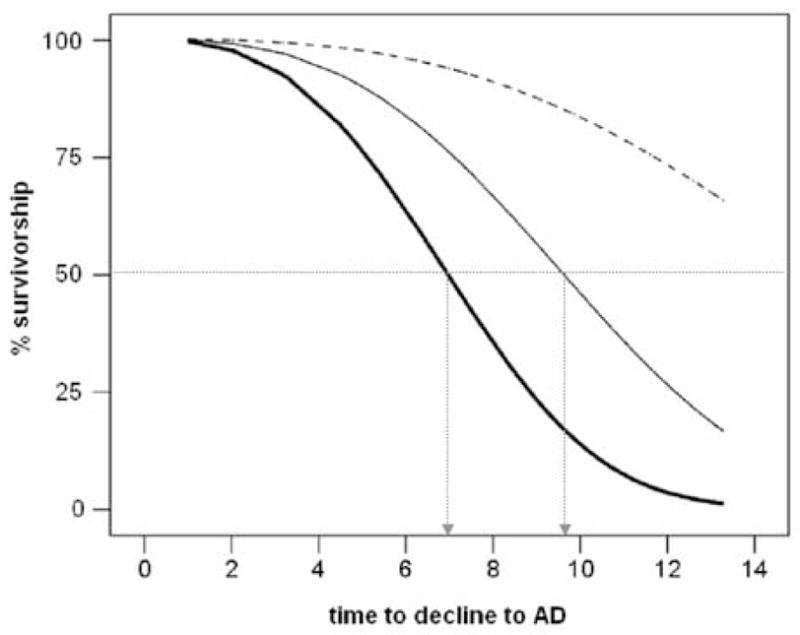
Hippocampal glucose metabolism and the risk for Alzheimer’s disease (AD). Weibull survival regression curves of normal subjects whose hippocampal (Hip) metabolism (MRglc, μmol/g/min) at baseline was ≤24 (bold line), 25–29 (plain line), and ≥30 (dashed line). The prediction model shows that for baseline Hip MRglc ≤24 μmol/g/min the median predicted time to decline to AD is 7 years, for baseline Hip MRglc 25–29 μmol/g/min the median predicted time to decline to AD is 9.5 years, and for baseline Hip MRglc ≥30 μmol/g/min the median predicted time to decline to AD is greater than 14 years. The median estimated time to decline to AD for each tertile of Hip MRglc is indicated with dashed arrows.
Since the baseline PCC MRglc was not a significant predictor of future decline, this ROI was not examined as a predictor of the time to cognitive decline.
Longitudinal differences between outcome groups
The annual rate of hippocampal MRglc reduction was greater for the NL-AD (−4.4±0.7%, p<.001) and the NL-MCI (−2.3±0.2%, p.<01) relative to the NL-NL (−0.8±0.3%) (Figure 3).
Figure 3.
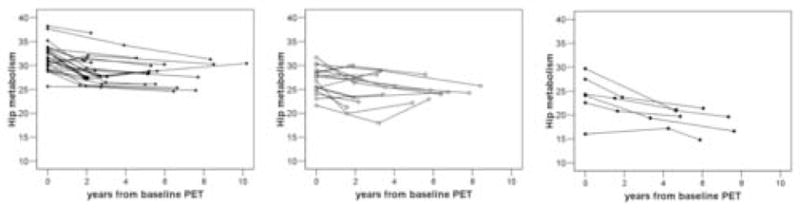
Individual trajectories of Hip glucose metabolism (μmol/g/min, pons-adjusted, atrophy corrected values) derived from the mixed effects model are plotted relative to the time of the first PET examination for NL-NL (black squares), NL-MCI (white circles), and NL-AD (black circles).
The annual rate of PCC MRglc reduction was higher for the NL-AD (−4.1±0.8%) relative to the NL-NL (−1.3±0.8%, p=.005) and to the NL-MCI (−1.8±0.9%, p=.034). The rate of PCC MRglc reduction was not different between NL-NL and NL-MCI (p=.50, n.s.). SPM analyses showed group by time MRglc interaction effects in the left middle temporal gyrus (MiTG, Brodmann Area 21, cluster extent= 120 voxels; Talairach coordinates [56]: x=−61, y=−44, z=−8, Z score=4.09, p<.05 cluster-level corrected). The annual rate of MiTG MRglc reduction was higher for the NL-AD (−1.5±0.3%) relative to the NL-NL (0.3±0.6%) and to the NL-MCI (−0.4±0.5%) (p’s<.05), and was higher for the NL-MCI relative to the NL-NL (p=.02). No other cortical regions showed longitudinal effects by examining the SPM results at p<.001, uncorrected.
Differences between outcome groups at the time of decline
At the time of decline, hippocampal MRglc was reduced in both NL-AD (38%, p<.001) and NL-MCI (16%, p<.001) as compared to NL-NL, and was reduced in NL-AD as compared to NL-MCI (26%, p=.001) (Table 1).
At the time of decline, PCC MRglc was reduced in NL-AD as compared to NL-NL (42%, p=.002) and to NL-MCI (31%, p=.014) (Table 1). No differences in PCC MRglc were found between NL-MCI and NL-NL (p=.11, n.s.) (Table 1).
SPM analyses at the time of decline showed MRglc reductions in the PCC and parieto-temporal cortices in NL-AD as compared to both NL-NL and NL-MCI (Table 2 and Figure 4). The NL-MCI patients showed MRglc reductions in the left superior temporal cortex as compared to NL-NL (Table 2 and Figure 4). No other regions showed significant group effects after removing the correction for multiple comparisons in the SPM analysis.
Table 2.
Results from SPM study: cross-sectional group differences at the time of decline.
| Cluster size | Coordinates* |
Z† | Functional area | Brodmann Area | ||
|---|---|---|---|---|---|---|
| x | y | z | ||||
| Reduced MRglc for NL-MCI relative to NL-NL | ||||||
| 124 | −47 | −34 | 6 | 2.78 | Superior temporal gyrus | 22 |
| Reduced MRglc for NL-AD relative to NL-NL | ||||||
| 1952 | 60 | −48 | 32 | 4.57 | Inferior parietal lobule | 40 |
| 58 | −54 | 35 | 4.32 | 40 | ||
| 614 | −48 | −55 | 38 | 3.68 | Inferior parietal lobule | 40 |
| −41 | −53 | 44 | 3.39 | 40 | ||
| 237 | −3 | −64 | 18 | 3.23 | Posterior cingulate gyrus | 31 |
| 177 | −63 | −36 | 1 | 3.42 | Middle temporal gyrus | 21 |
| Reduced MRglc for NL-AD relative to NL-MCI | ||||||
| 1043 | 53 | −52 | 32 | 4.12 | Inferior parietal lobule | 40 |
| 326 | −53 | −56 | 40 | 4.07 | Inferior parietal lobule | 40 |
| 323 | −4 | −67 | 20 | 3.25 | Posterior cingulate gyrus | 31 |
Coordinates from the atlas of Talairach and Tournoux [56]. x is the distance in mm to the right (+) or left (−) of midline; y is the distance anterior (+) or posterior (−) to the anterior commissure, and z is the distance superior (+) or inferior (−) to a horizontal plane through the anterior and posterior commissures.
Z values at p<.05, corrected for multiple comparisons.
Figure 4.
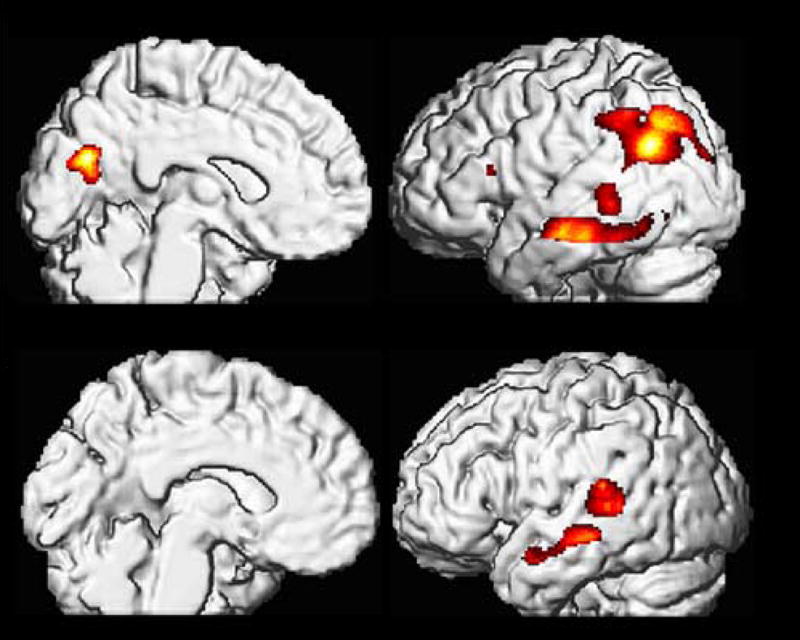
Cortical MRglc reductions in NL-AD (Upper half) and NL-MCI (Lower half) at the time of decline relative to NL-NL. Areas of hypometabolism relative to NL-NL (represented on a red to yellow color coded scale) are displayed onto the left medial and left lateral views of a volume-rendered spatially normalized MRI image.
Partial volume correction
PVC had the general effect of increasing the hippocampal MRglc values in all clinical groups at all time points (range 0–25%), which left the cross-sectional baseline and the longitudinal hippocampal MRglc effects essentially unchanged (Table 1). PVC hippocampal MRglc predicted future dementia with 82% sensitivity (9/11 decliners correctly identified) and 70% specificity (33/47 NL-NL) [72% accuracy, χ2(1)=6.1, p=.013, odds ratio (OR)=1.9, 95% CI=1.7–2.2]. Specifically, PVC hippocampal MRglc predicted decline from NL to AD with 83% sensitivity (5/6 NL-AD) and 79% specificity (37/47 NL-NL) [79% accuracy, χ2(1)=6.42, p=.01, OR=2.0, 95% CI=1.85–2.2], decline from NL to non-AD dementia with 80% sensitivity (4/5 NL-non AD) and 77% specificity (36/47 NL-NL) [77% accuracy, χ2(1)=6.1, p=.01, OR=2.0, 95% CI=1.2–2.4]. PVC hippocampal MRglc predicted decline from NL to MCI with 74% sensitivity (14/19 NL-MCI) and 70% specificity (31/47 NL-NL) [68% accuracy, χ2(1)=8.7, p=.012, OR=1.9, 95% CI=1.8–2.2].
With respect to the PCC ROI, the slight reduction in the baseline MRglc in NL-AD as compared to NL-NL was no longer evident after PVC (p=.23, n.s., Table 1). The annual rate of PCC MRglc reduction remained higher for the NL-AD (−2.3±0.9%) relative to the NL-NL (−0.2±0.2%) and to the NL-MCI (−0.5±0.5%) (p’s<.05).
Likewise, SPM results remained unchanged after PVC. The results continued to show no MRglc group differences at baseline, with MRglc reductions found at the time of decline to AD or to MCI for the same parieto-temporal and PCC regions (p’s≤.001).
MCI subtypes
Hippocampal and PCC MRglc measures of the 3 NL-MCI subgroups and NL-NL are presented in Table 3.
Table 3.
Hippocampal and posterior cingulate cortex MRglc measures by MCI subgroups.
| Hip (μmol/g/min) | PCC (μmol/g/min) | |||||
|---|---|---|---|---|---|---|
| Baseline | Last exam a | Annual rate (%) | Baseline | Last exam a | Annual rate (%) | |
| NL-NL | 30.8(5.3) | 27.8(3.6) | −0.8(0.3) | 51.2(9.6) | 42.9(6.9) | −1.3(0.8) |
| NL-MCI | ||||||
| Non-amnestic | 27.1(4.1)* | 24.3(4.6)** | −1.99(0.5)** | 51.3(9.3) | 38.7(5.6) | −0.78(0.9) |
| Memory deficits 1SD<NL | 25.0(4.9)* | 23.9(2.1)** | −2.28(0.4)** | 47.4(6.8) | 38.5(6.5) | −2.21(0.8) |
| Amnestic | 26.6(3.6)* | 22.01(3.3)** | −2.46(0.5)** | 47.9(7.8) | 32.9(2.8)* + º | −2.37(0.8) |
Values are mean MRglc (SD). Abbreviations: Hip = hippocampus; PCC = posterior cingulate cortex.
Significantly lower than NL-NL, p≤.05
Significantly lower than NL-NL, p≤.01
Significantly lower than non-amnestic MCI, p≤.05
Significantly lower than MCI with memory deficits 1SD<NL, p≤.05
Longitudinal FDG PET examinations were performed in all 19 NL-MCI and 30 NL-NL.
All NL-MCI subgroups had hippocampal MRglc reductions as compared to NL-NL at the baseline, over time and at the time of decline (p’s≤.001). We did not find differences across MCI subgroups at the baseline [F(2,16)=0.28, p=.69, n.s.], over time [F(2,16)=0.29, p=.29, n.s.] or at the time of decline [F(2,16)=0.78, p=.48, n.s.] in the hippocampal MRglc. None of the NL-MCI subgroups had PCC MRglc reductions as compared to NL-NL at the baseline [F(3,61)=1.15, p=.34, n.s.], or over time [F(3,45)=1.46, p=.24, n.s.]. We did not find differences across MCI subgroups at the baseline [F(2,16)=1.22, p=.32, n.s.], or over time [F(2,16)=1.07, p=.26, n.s.] in the PCC MRglc (Table 3).
At the time of decline, we found significantly reduced PCC MRglc in the amnestic MCI subgroup as compared to NL-NL (p=.013) and as compared to the other 2 MCI subgroups (p’s≤.05). The two non-amnestic MCI subgroups did not show PCC MRglc reductions as compared to NL-NL (p’s≥1, n.s.).
Post Mortem examinations
Two NL-AD subjects came to post mortem examination 5 and 8 years after the last PET scan and both received a primary pathological diagnosis of AD. At baseline, when both subjects were normal, their hippocampal MRglc was reduced relative to the mean of the NL-NL group by 15% and 35%, which correctly classified both these subjects as future AD. When both subjects were AD, the last PET scans demonstrated significant hippocampal as well as neocortical hypometabolism consistent with AD (Figure 5).
Figure 5.
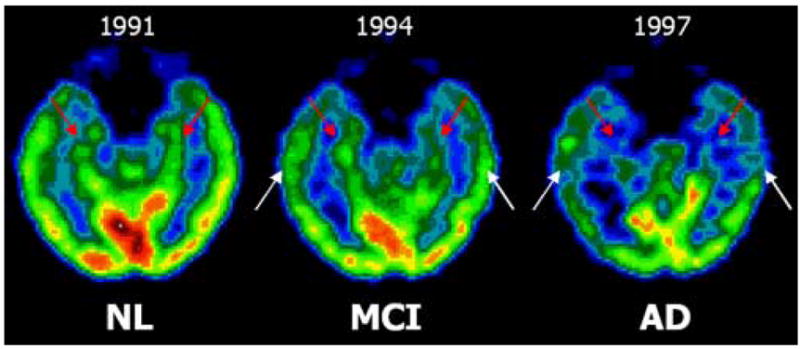
Longitudinal FDG-PET scans of one subject (female, baseline age: 73 years, education: 12 years, baseline MMSE: 30/30) that declined from NL (in 1991) to MCI (1994), and then to AD (1997), and had the AD diagnosis confirmed at post-mortem (2000). Axial mages are displayed in a negative-angulation running parallel to the hippocampal plane. The scans show progressive hippocampal (red arrows) and temporal cortex (white arrows) metabolic reductions.
Estimating the age at which differentiation begins
By using the baseline and longitudinal hippocampal MRglc data we estimated the age of divergence [12] for the averaged hippocampal MRglc measurements. Figure 6 shows the estimation of the point of group divergences for the hippocampal MRglc. At baseline, hippocampal MRglc in NL-AD was on average 26% below that in NL-NL, with a rate of decline of 4.4%/year, and in NL-MCI was on average 15% below NL-NL, with a rate of decline of 2.4%/year. The rate of hippocampal MRglc decline in NL-NL was 0.8%/year. Making the assumption that the rates of MRglc decline were constant before the baseline examination, the estimated time of divergence in hippocampal MRglc between clinical groups was 9±5 years (95% C.I.=7–13.5 years) before the start of the study (Figure 6). Group differences in hippocampal MRglc between NL-NL and NL-AD reached statistical significance 6 years before the baseline, when the estimated mean hippocampal MRglc was 9% lower in NL-AD (29.9±3.1 μpmol/g/min) as compared to NL-NL (32.7±2.5 μpmol/g/min, p=.041, one-sided). At that time the mean age for the NL-AD group was 66±5 years. Group differences between NL-MCI and NL-NL reached statistical significance 5 years before the baseline, when the estimated mean hippocampal MRglc was 8% lower in NL-MCI (30.4±2.1 μpmol/g/min) as compared to NL-NL (32.9±2.5 μpmol/g/min, p=.026, one-sided). At that time the mean age for the NL-MCI group was 65±6 years.
Figure 6.
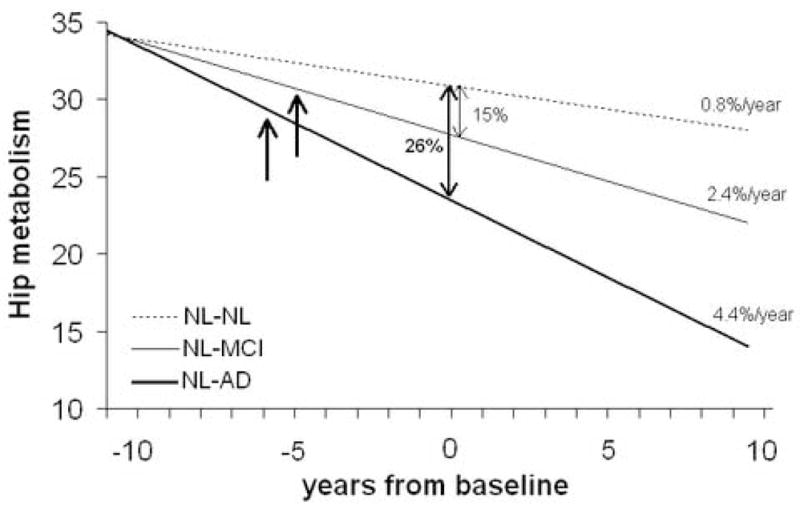
Predicted origin of divergence and differentiation in hippocampal (Hip) glucose metabolism between clinical outcome groups. Bold arrows indicate the estimated time of the first significant reductions in Hip metabolism in the decliners as compared to NL-NL, which was 6 years before the baseline PET for NL-AD and 5 years before the baseline PET for NL-MCI.
Although PCC MRglc was not different across groups at the baseline, we estimated the age of statistical differentiation for the PCC MRglc in NL-AD as compared to NL-NL after the baseline exam. Group differences in PCC MRglc between NL-NL and NL-AD reached statistical significance 3.5 years after the baseline, when the estimated mean PCC MRglc was 16% lower in NL-AD (41.1±7.5 μpmol/g/min) as compared to NL-NL (49.2±9.6 μpmol/g/min, p=.05, one-sided). At that time, 5/6 NL-AD subjects were at the MCI stage, and the mean age for the NL-AD group was 76±5 years.
The annual change in PCC MRglc was not different between NL-MCI and NL-NL, and therefore the model was not estimated.
DISCUSSION
This FDG-PET study shows that reductions in hippocampal MRglc during normal aging predict future cognitive decline and that grater rates of hippocampal MRglc reductions correlate with the progression to late-onset AD and MCI. Our findings also show that reduced hippocampal MRglc is associated with a shorter duration of survival time as normal. These results suggest that reduced hippocampal MRglc in normal aging is a risk factor for cognitive decline, and suggest that this measure may serve as a preclinical marker for future cognitive deterioration.
Although it has been suggested that reduced brain MRglc may predispose individuals to develop AD in old age [8, 47, 54], very little work has been done with FDG-PET to study the transition from normal aging to AD and other dementias. To date, the only information about preclinical brain MRglc changes derives from our previous longitudinal FDG-PET study that examined the decline from normal to MCI [8]. The prior study showed that baseline MRglc reductions in the entorhinal cortex (EC), which is part of the hippocampal formation, predicted 3 years in advance the decline to MCI [8]. This study also showed that the prediction accuracy significantly improved by combining the hippocampal and entorhinal cortex MRglc measures.
The present study expands on the previous work by increasing the subject sample size from 23 to 77, and the follow-up interval from 3 to up to 14 years. This enabled us to follow NL elderly individuals through the expression of the clinical symptoms of dementia in addition to MCI, and in two probable AD cases to autopsy confirmation. The data shows that hippocampal hypometabolism among normal elderly subjects predicts future cognitive decline and greater rates of MRglc reduction correlate with disease progression. A unique contribution of the present study is the application of automated procedures to sample the hippocampus on PET [40]. To date, EC and hippocampal MRglc measures could be obtained only with the labor intensive manual outlining of the structure on the PET-coregistered MRI scans. This is not feasible in routine clinical examinations or with large data sets. In contrast, the automated technique used in the present study for the measurement of hippocampal MRglc does not require an MRI, which makes the method operator-independent and suitable for high-throughput examination of PET data and clinical screening. Automated techniques for sampling the EC are not available at the moment. Although the EC and the hippocampus are both involved in learning and memory and are affected early by AD pathology, the accumulation of AD lesions in the EC may precede that in the hippocampus [4, 6]. Future longitudinal studies are needed to compare the MRglc reductions in these structures in the hope of staging brain abnormalities during normal aging.
Hippocampal metabolism and the risk for cognitive decline
We demonstrate that reduced hippocampal MRglc on FDG-PET among normal elderly subjects increases the risk for developing cognitive impairment and dementia. Hippocampal MRglc reductions during the normal stages of cognition predict future dementia and MCI, with lower MRglc being associated with a shorter time to the expression of cognitive symptoms. Overall, the risk for future cognitive decline was 2-fold increased and the time of survival as normal was 2-fold decreased per 1 unit reduction in hippocampal MRglc. Hippocampal MRglc abnormalities at the baseline predicted decline from NL to AD with 81% accuracy, decline from NL to non-AD dementia with 77% accuracy, and decline from NL to MCI with 71% accuracy.
The finding of an early role for the hippocampus in the detection of future dementia is in agreement with a recent MRI prediction study in cognitively normal individuals that reported an association between reduced baseline hippocampal volumes and shorter time until onset of dementia 6 years later [11]. Our data shows that hippocampal hypometabolism is also detectable years prior to the onset of cognitive symptoms. Moreover, by using the baseline and longitudinal hippocampal MRglc measures, the prediction model shows that the first detectable reductions in hippocampal MRglc in the future decliners to AD and MCI may have occurred 5–6 years before our study began, suggesting that we might be able to further anticipate the preclinical detection of future cognitive decline.
However, we observed substantial overlap across declining groups. Reduced baseline hippocampal MRglc was found in NL subjects who developed both AD and non-AD dementia, as well as MCI. These data indicate that the hippocampal MRglc reduction is a sensitive marker for future cognitive impairment but lacks intrinsic disease specificity. In our study, 5 NL subjects progressed to non-AD dementia, of whom 3 subjects with vascular dementia (VaD), 1 with Parkinson’s disease (PD) and 1 with frontotemporal dementia (FTD). As a group, these subjects showed reduced baseline hippocampal MRglc as compared to NL-NL. On an individual basis, the baseline hippocampal MRglc was reduced as compared to NL-NL in 4/5 NL-non AD subjects, and comparable to NL-NL in the NL subject who developed VaD.
Although both NL-AD and NL-non AD groups showed baseline hippocampal hypometabolism as compared to NL-NL, hippocampal MRglc was further 15% reduced in NL-AD as compared to NL-non AD. These baseline differences yielded a preclinical accuracy of 73% in differentiating AD from other dementias, with 5/6 (83%) NL-AD and 3/5 (60%) NL-non AD correctly classified. The combination of the baseline hippocampal and PCC MRglc resulted in an overall accuracy of 82% in differentiating AD from other dementias, thanks to the re-classification of one NL-non AD subject that was misclassified as NL-AD using the hippocampal MRglc measures alone. Although this is a small gain in specificity in light of the limited number of subjects available per outcome group and of the heterogeneity of the NL-non AD group, this data suggests that FDG PET measures have a potential for being used as biomarkers in the early detection of dementing disorders.
We offer that, despite the sensitivity of FDG-PET imaging in detecting brain damage prior to clinical diagnosis, hippocampal MRglc reductions per se are not diagnostically specific for AD or other dementias. Hypometabolism on FDG PET is found in several neurodegenerative diseases, and there is evidence that patterns of MRglc reduction, instead of specific regions alone, have differential diagnostic value in the major dementing disorders, such as AD, FTD, Lewy body dementia and VaD (see [37] for review). Distinctive combinations of hypometabolic regions have been identified that are useful in the differential diagnosis of AD from normal aging and other dementias [53]. However, there are no studies examining whether MRglc abnormalities can be used to differentiate among these neurodegenerative disorders prior to overt symptom onset.
Our results indicate that hippocampal FDG PET measures are sufficiently sensitive to identify normal elderly at risk for cognitive decline. A means for early detection of at risk individuals is the aim of much research, as treatment interventions would be most likely to benefit patients in the earliest disease stages. In order to confer specificity to the preclinical diagnosis, other studies are warranted to examine whether the risk for developing a specific type of dementia can be predicted based on the detection of individual FDG PET patterns of MRglc abnormalities, as well as whether the combination of the disease-sensitive MRglc measures with pathology-specific biomarkers, such as CSF measures of amyloid beta and tau proteins [18] or amyloid PET imaging [29].
FDG PET as a correlate of cognitive decline
In addition to the advance prediction capacity demonstrated by both PET and MRI measures, our study shows for the first time that grater rates of MRglc reductions, as measured with longitudinal PET examinations, correlate with the transition from normal aging to an impaired state. Specifically for AD, significantly greater rates of hippocampal, PCC and temporal cortex MRglc reductions were found in normal subjects that declined to AD as compared to the non-decliners. The fact that the progressive MRglc reductions parallel the decline to AD is of interest, as an ideal biomarker for AD should correlate with disease progression [18]. Greater rates of hippocampal and temporal cortex MRglc were also found in the declining MCI patients, although to a lesser extent than in AD (discussed below).
There are no longitudinal MRI studies that specifically examined the decline from normal aging to late-onset sporadic AD. However, longitudinal MRI studies in normal elderly demonstrated increased hippocampal atrophy during the decline from normal to MCI [27], and one study showed greater medial temporal lobe atrophy rates in a group of normal subjects declining to MCI or AD as compared to controls [51]. Likewise, serial MRI studies in individuals with early-onset familial AD as determined by autosomal dominant genetic mutations [16, 17] showed that the rate of hippocampal atrophy increases as a function of time, with a quadratic model being the best fit. In the present PET study in late-onset AD, adding the quadratic to the linear term did not improve the data fit (χ2(1)=2.8, p=.92, n.s.). Longitudinal FDG-PET studies in familial AD would be of interest to assess whether the rate of MRglc reductions also accelerates close to conversion. However, there is evidence that clinical presentation and histopathological findings are comparable between familial and sporadic AD [33] despite the fact that familial AD patients typically develop dementia at an early age (typically 30s to 50s) than in the sporadic form, suggesting a faster and more aggressive progression of brain damage than in sporadic AD.
The longitudinal PET study was not completed in the subjects that declined to non-AD dementia, so it remains to be established whether greater rates of MRglc reductions would also be found along with clinical progression in neurodegenerative disorders other than AD.
Hypometabolism remains significant after partial volume correction
In our PET study, all the effects remained significant after partial volume correction (PVC) from the coregistered MRI scans. Particularly, the sensitivity of the baseline hippocampal measures in predicting future decline remained substantially unchanged in all outcome groups. These results suggest that a true reduction in brain MRglc occurs early in the course of dementing disorders that is relatively independent of the partial volume effects of the increasing CSF pool. This finding is consistent with previous PET studies showing that MRglc reductions in clinical MCI and AD patients remain significant after PVC [8, 9, 26, 32, 38, 40]. In the present study, PVC increased the baseline MRglc values in all groups, leaving the group differences substantially unchanged, with an average increase of 6%, a relatively minor adjustment. The knowledge that MRglc reductions in dementia represent intrinsic reductions in MRglc per gram brain tissue (as measured after PVC) is valuable from a biological point of view. From a clinical point of view, the fact that unadjusted FDG PET measures alone represent a reliable estimate of the underlying pathology suggests a diagnostically useful role for PET in the examination of normal subjects at risk for future cognitive decline.
Metabolic reductions in AD and MCI patients at the time of decline
At the time of clinical decline, the normal subjects that declined to AD showed hippocampal, parieto-temporal and PCC hypometabolism as compared to controls. When NL-MCI patients were at the MCI stage, hypometabolism in this group was restricted to the hippocampus and the left temporal cortex. This data is consistent with the idea of a progressive pathological spreading in AD from the hippocampal formation to the association cortex [4], as well as with prior FDG-PET reports of more severe and widespread cortical hypometabolism in AD relative to MCI [7, 9, 14, 35, 39, 41]. Moreover, FDG-PET prediction studies in MCI showed that PCC and parieto-temporal cortex hypometabolism is consistently found in those MCI patients within 3 years of decline to AD as compared to stable MCI [3, 7, 13, 14, 35, 39]. Our results for the NL-AD subjects, who went through an MCI stage before declining to AD, are consistent with the observation that MRglc reductions within PCC and parieto-temporal regions at the MCI stage are involved with the decline to AD [3, 7, 14, 35, 39], and provide evidence that hippocampal abnormalities are also implicated.
While parieto-temporal and PCC hypometabolism is consensually recognized as the metabolic feature of AD, and there are increasing reports of medial temporal lobe deficits, there is currently no specific pattern of cortical hypometabolism considered to be a hallmark for MCI (see [37, 42] for recent reviews). It is well known that regional patterns of MRglc reductions in individual AD and MCI patients are variable, and correspond to patterns of cognitive and behavioral abnormalities in individual patients [3, 24]. Most of the FDG PET research on MCI has been done with amnestic patients. FDG-PET studies in amnestic MCI patients report cortical hypometabolism, mainly involving the PCC and temporal cortices [7, 14, 35, 39, 41]. Some studies in non-amnestic MCI patients show either relative absence of cortical hypometabolism or hypometabolism in diverse brain regions [5, 8, 9, 38, 46]. At present there is no universal agreement on the categorization of patients with suspected MCI into clinical subgroups [21, 44]. In our study, the diagnosis of MCI was based on clinical criteria with subsequent stratification into amnestic and non-amnestic subtypes based on cognitive performance. By comparing the FDG PET measures in our three NL-MCI subgroups, we found that all NL-MCI subgroups had hippocampal MRglc reductions as compared to controls at baseline and at the last examination. As such, we conclude that hippocampal hypometabolism is evident in clinically detected MCI regardless of the neuropsychological profile. This observation is in keeping with our previous cross-sectional FDG PET results in an independent sample of MCI patients [38]. In addition, at the time of decline to MCI, the amnestic MCI subgroup showed hypometabolism in the PCC as compared to controls, which was not evident in the other MCI subgroups. According to previous FDG PET findings [3, 7, 14, 35, 39], this data suggests that the additional cortical MRglc reductions detected in the currently amnestic MCI subjects may predispose them to develop AD in the near future.
In our study, the baseline and longitudinal regional hypometabolism in the NL-MCI group was less severe and the standard deviations larger than in the NL-AD group, indicating heterogeneity in the metabolic deficits in this group. Further follow-up examinations of our currently MCI patients are needed to assess whether those MCI subjects with lower MRglc will eventually develop AD or other dementias [44], and possibly show a more extended or diversified topography of MRglc reductions, while those with higher MRglc will remain stable or develop other outcomes. The small sample sizes of our NL-MCI subgroups precluded meaningful examination of regional MRglc differences across subtypes. The prediction of individual clinical outcome in MCI patients is very important and more studies are needed to examine whether distinctive patterns of hypometabolism can be discerned in MCI patients prior to decline to AD or other outcomes.
Likewise, there remains the possibility that some of the NL-NL subjects are at risk for future decline. In our study, even though the follow-up times were comparable across clinical outcome groups, the NL-NL subjects were studied over a slightly shorter interval as compared to both NL-MCI and NL-AD. It is possible that as a consequence, some of the NL-NL subjects may be close to decline. We offer that the effect of this would be to conservatively misclassify these subjects as NL and so reduce the diagnostic accuracy.
Methodological considerations
The present study shows that, while hippocampal MRglc reductions were significant prior to cognitive decline, significant cortical hypometabolism was not observed. Significant MRglc reductions in the PCC in the NL-AD group as compared to NL-NL were estimated to reach statistical significance 3.5 years after the baseline PET, and at that time 5/6 NL-AD subjects were diagnosed as MCI, including 4 amnestic MCI patients. Our findings of MRglc deficits beginning in the hippocampus during the normal stages of cognition that progressively involve the cortical regions during decline to AD are consistent with pathology and MRI studies in both topography and timing [11, 27, 36, 51]. However, we cannot exclude the possibility that other brain regions besides the hippocampus might show preclinical effects that were not detectable in our study using currently available image analysis tools, for example the EC, as mentioned above. In the present study, two image analysis approaches were used, i.e., automated regions of interest (ROI) and whole-brain voxel-based analysis (VBA) [19]. Based on previous postmortem, MRI and FDG-PET results, we stated the a priori hypothesis that the hippocampus is the brain structure most likely to show preclinical effects. The hippocampus was therefore examined using a region of interest (ROI) approach [40]. For methodological comparability, an ROI analysis was also performed for the PCC, the cortical region most consistently hypometabolic in MCI and early AD [7, 14, 35, 41]. VBA was performed to test for statistical effects for the whole brain, first with a correction for multiple comparisons, and then at a more liberal probability value of p<.001, uncorrected for multiple comparisons [19].
In our study, the ROI and the VBA approaches showed similar results with respect to the PCC. Both ROI and VBA analyses showed no baseline group differences in the PCC, and significant PCC hypometabolism in the NL-AD patients at the time of decline as compared to NL-NL. However, only the ROI analysis revealed greater rates of PCC MRglc reductions in NL-AD as compared to both NL-NL and NL-MCI groups, which were significant at p=.005 and p=.034, respectively. Likewise, the hippocampal effects found with the ROI approach were not found with VBA.
We previously showed that the pre-processing steps involved with VBA (i.e., spatial normalization and smoothing) and particularly the need for more conservative statistical thresholds, which are necessary in a whole-brain analysis where hundreds of voxels are examined at the same time, may compromise detection of MRglc abnormalities in small brain regions such as the hippocampus, which is particularly subject to anatomical distortions in aging and AD [40]. The ROI approach proved more accurate than VBA in detecting hippocampal MRglc abnormalities in AD and MCI [40]. The use of ROIs offers increased statistical power because selecting ROIs for a priori hypothesis testing reduces the number of multiple statistical comparisons, and also provides a quantitative estimation of signal change in each ROI that can be used to compare across neuroanatomical regions. On the other hand, the advantage of VBA is that effects in every region of the brain, as well as effects within an anatomical region, can be tested. VBA was performed on spatially smoothed images, and spatial smoothing has the effect of improving alignment across subjects by reducing anatomical inter-individual variability, as well as increasing the signal-to-noise ratio by clustering together functionally related voxels and averaging out uncorrelated noise across voxels [19]. This is similar to what the ROI technique accomplishes by averaging metabolic counts within a functionally homogenous anatomical region. In fact, PET VBA studies in MCI and AD showed consistency with ROI data with respect to the cortical regions, which are larger than the hippocampus and less prone to substantial anatomical sampling errors (see [37] for review). However, detection of a significant cluster or voxel in VBA depends critically on setting a probability threshold, and this might hinder detection of statistical effects in a region containing mildly hypometabolic voxels. Therefore, it is possible that the lack of baseline cortical effects found with VBA may be due to the more conservative probability threshold used, and caution should be used in the interpretation of the absence of cortical effects at baseline. It is possible that other image analysis techniques may be able to detect additional regions of MRglc abnormalities in the future decliners.
According to much of the PET literature, the PCC is the cortical region most likely to show early MRglc abnormalities [7, 14, 35, 41]. The absence of baseline MRglc reductions in the PCC with both the ROI and the VBA methods suggests that the absence of baseline cortical hypometabolism in the future decliners may not be related to the sensitivity of the analytic method but rather to the presymptomatic state of the subjects enrolled in this study. In the present study, the baseline PCC MRglc did not significantly predict future cognitive decline from NL and adding this measure in the logistic regression model with the hippocampal MRglc did not significantly improve the prediction accuracy of the hippocampal measures for any comparisons. However, we do not exclude that MRglc abnormalities in other brain regions, or the multivariate combination of different regions, may significantly contribute to the preclinical detection of individuals at risk for future cognitive impairment.
Memory performance and subjective memory complaints
At the time of the first examination, when all subjects were clinically and cognitively normal, there were no statistical differences between decliners and non-decliners with respect to cognitive performance. Although the subjects who eventually developed dementia scored slightly lower on the delayed recall of paired associates test than both stable normal and future MCI patients (on average 1.3 points, Table 1), this measure did not significantly predict future dementia, with only 47% accuracy for decline from NL to AD [50% sensitivity and 47% specificity, χ2(1)=0.12, n.s.], and 49% accuracy for decline from NL to non-AD [60% sensitivity and 49% specificity, χ2(1)=0.33, n.s.], nor did it add to the prediction accuracy of the hippocampal MRglc. Our findings do not exclude that psychometric tests other than those examined in our study might predict decline from normal aging to dementia or MCI.
At baseline, some subjects reported age-related subjective memory changes in the absence of objective findings for cognitive change resulting in a GDS score of 2 [48]. Some studies suggest that memory complaints may be more frequent in subjects with incipient dementia [22]. However, subjective memory complaints are very common in the elderly with prevalence estimates of 25–50% [28] and the validity of these complaints in predicting future decline is controversial [22, 45]. While experiencing memory decline is often one of the first reasons for elderly individuals to seek clinical attention, several points indicate that our subjects were in fact normal at baseline. First, none of the subjects showed any objective or measurable evidence for functional or cognitive impairment, and none would meet criteria for MCI. Second, there was no difference in the proportion of decliners as a function of the presence (or absence) of subjective memory complaints at baseline. Cognitive decline to dementia or MCI was found in 11/29 GDS=1 subjects and 19/49 GDS=2 subjects (χ2(1)=0.02, n.s.). Both groups declined on average 8 years later, and there was no difference in the time to decline between GDS 1 and GDS 2 groups [F(1,29)=0.1, ns]. Moreover, there were no differences between GDS 1 and GDS 2 groups in hippocampal MRglc at baseline [F(1,76)=.02, ns]. We then repeated the analyses for the subjects within the GDS 1 group and found that baseline hippocampal MRglc was 18% reduced in the decliners to MCI or AD (n=11, 26.5±7.2 μmol/g/min) as compared to the non-decliners (n=18, 32.3±6.4 μmol/g/min) [F(1,27)=8.58, p=.007], which resulted in 82% sensitivity and 78% specificity in predicting cognitive decline in NL subjects without subjective memory complaints [79% accuracy, χ2(1)=7.81, p<.01, OR=2.2, 95% CI=1.9–2.6].
Lastly, 30/77 (39%) of our baseline NL subjects declined to dementia or MCI over the course of the study. Of these NL subjects, 6/77 (0.8%) declined to AD after an average of 8 years, for an average annual rate of decline from NL to AD of less than 1%/year, 5/77 (6.5%) declined to non-AD dementia after an average of 3 years, for an average rate of decline from NL to non-AD of 2%/year, and 19/77 (24.6%) declined to MCI, for an average rate of decline from NL to MCI of 3%/year. These estimates are consistent with those from other imaging studies following progression from NL to MCI or AD in research settings [8, 27, 51]. Future studies are needed to replicate these preliminary research findings in community-based samples.
Selection of the reference region
In the present study, pons was used as the reference region to adjust for individual differences in global MRglc. Most neurodegenerative disorders are characterized on FDG PET by regional hypometabolism in the parieto-temporal, posterior cingulate, frontal and occipital cortices associated with relatively preserved metabolism in the pons, sensorimotor cortex, thalamus, putamen, and cerebellum (see [37] for review). The choice of a reference region is particularly important in PET studies in dementia since, in addition to regional abnormalities, there is global reduction of MRglc [37]. The ideal reference region for FDG PET studies should show both pathological and metabolic preservation. As such, the pons is reportedly the least metabolically affected region in mild to severe AD and other dementias [1, 34, 57]. There is evidence that pons MRglc shows the lowest coefficients of variation (CV [%] = standard deviation/mean * 100) as compared to the other possible reference regions, indicating stable metabolic activity [34]. To our knowledge, there are no reports of reduced pons MRglc in other dementias. However, attenuation correction may be thought to have a negative impact on the determination of radioactivity in this structure because of its anatomical position, introducing noise and therefore increasing inter-subject variability. Consistent with previous reports, in the present study, the CVs for pons MRglc were also low, ranging between 11% and 17% across the groups (Table 1). Moreover, our data shows no group differences in pons MRglc at baseline, over time or at the last examination (Table 1), further suggesting the suitability of this structure as a reference region for FDG PET studies in dementia.
Conclusions
Overall, these data indicate that FDG-PET imaging has the potential for contributing to clinical diagnosis at preclinical dementia stages, when clinical symptoms are not yet expressed. As disease-modifying and prevention treatments become available, such as recent amyloid beta-peptide immunization for AD [43, 52], evaluations of brain MRglc in combination with other more disease-specific measures may help to identify suitable candidates for treatment as well as to assess the efficacy of such treatments. Our results demonstrate that the first signs of decline to dementia and MCI can be detected in a progressively reduced hippocampal MRglc, making the recognition of normal subjects at risk for future cognitive deterioration a realistic goal. Future studies are needed to prospectively examine these and other regional MRglc measures as predictors of future impairment on an individual basis, as well as to improve specificity in the preclinical differential diagnosis of dementing disorders.
Acknowledgments
This work was supported by the NIH-NIA grants AG12101, AG13616, AG08051and AG022374, and NIH NCRR MO1RR0096. We thank Joanna Fowler, David Schlyer and Gene-Jack Wang at Brookhaven National Laboratory, Upton, NY, for their support of the PET studies, Schantel Williams and Ronit Notkin at NYU for study coordination and psychometric testing.
Appendix
Results from hierarchical random (mixed) effects model were derived as follows:
A) Individual trajectories of MRglc reductions over time after adjusting for subject-specific effects were derived by fitting the following equations [12, 20]:
For subject i at visit j:
where
so that
Where tij = time of j-th scan for subject i belonging to group x, where [tij = 0, 1, … tij(dec), …T] with tij(dec) = time of j-th scan for subject i at the time of clinical decline, and (eij, ui, vi) ~ N(0,σ2); Ai = predicted intercept (i.e., predicted MRglc values at baseline); Bi tij = predicted regression slope (i.e., predicted rate of MRglc change).
B) Regional MRglc for each subject at the time of decline was estimated by using the above individual trajectories and fitting the following equations [12, 20]:
For subject i at visit j:
Where tij(dec) = time of j-th scan for subject i at the time of clinical decline, and Ai = predicted intercept (i.e., predicted MRglc values at baseline).
These equations were applied to the coregistered and spatially normalized whole-brain PET scans of each subject i to create:
A slope (Bi tij) PET image, where each voxel in the slope image contains the estimated rate of MRglc change in that voxel. The slope images were then compared between clinical groups to examine differences in the rate of MRglc reduction in the whole-brain on a voxel-by-voxel basis.
A PET image at the time of decline (Yij(dec)), where each voxel in the image contains the estimated MRglc activity at the time of decline. The time of the last clinical exam was used for the NL-NL subjects. These images were then compared between clinical groups to examine MRglc differences at the time of decline in the whole-brain on a voxel-by-voxel basis.
Footnotes
Conflicts of interest. None.
Publisher's Disclaimer: This is a PDF file of an unedited manuscript that has been accepted for publication. As a service to our customers we are providing this early version of the manuscript. The manuscript will undergo copyediting, typesetting, and review of the resulting proof before it is published in its final citable form. Please note that during the production process errors may be discovered which could affect the content, and all legal disclaimers that apply to the journal pertain.
References
- 1.Albin RL, Minoshima S, DAmato CJ, Frey KA, Kuhl DE, Sima AAF. Fluoro-deoxyglucose positron emission tomography in diffuse lewy body disease. Neurology. 1996;47:462–6. doi: 10.1212/wnl.47.2.462. [DOI] [PubMed] [Google Scholar]
- 2.American Psychiatric Association. Diagnostic and Statistical Manual of Mental Disorders. 4. Washington, D.C: American Psychiatric Association; 1994. [Google Scholar]
- 3.Anchisi D, Borroni B, Franceschi M, Kerrouche N, Kalbe E, Beuthien-Beumann B, Cappa S, Lenz O, Ludecke S, Marcone A, Mielke R, Ortelli P, Padovani A, Pelati O, Pupi A, Scarpini E, Weisenbach S, Herholz K, Salmon E, Holthoff V, Sorbi S, Fazio F, Perani D. Heterogeneity of brain glucose metaboism in mild cognitive impairment and clinical progression to Alzheimer disease. Arch Neurol. 2005;62:1728–33. doi: 10.1001/archneur.62.11.1728. [DOI] [PubMed] [Google Scholar]
- 4.Ball MJ, Hachinski V, Fox A, Kirshen AJ, Fisman M, Blume W, Kral VA, Fox H. A new definition of Alzheimer’s disease: A hippocampal dementia. Lancet. 1985;1:14–6. doi: 10.1016/s0140-6736(85)90965-1. [DOI] [PubMed] [Google Scholar]
- 5.Berent S, Giordani B, Foster N, Minoshima S, Lajiness-O’Neill R, Koeppe R, Kuhl DE. Neuropsychological function and cerebral glucose utilization in isolated memory impairment and Alzheimer’s disease. J Psychiat Res. 1999;33:7–16. doi: 10.1016/s0022-3956(98)90048-6. [DOI] [PubMed] [Google Scholar]
- 6.Braak H, Braak E. Neuropathological stageing of Alzheimer-related changes. Acta Neuropathologica. 1991;82:239–59. doi: 10.1007/BF00308809. [DOI] [PubMed] [Google Scholar]
- 7.Chetelat G, Desgranges B, De La Sayette V, Viader F, Eustache F, Baron JC. Mild cognitive impairment: Can FDG-PET predict who is to rapidly convert to Alzheimer’s disease? Neurology. 2003;60:1374–7. doi: 10.1212/01.wnl.0000055847.17752.e6. [DOI] [PubMed] [Google Scholar]
- 8.de Leon MJ, Convit A, Wolf OT, Tarshish CY, De Santi S, Rusinek H, Tsui W, Kandil E, Scherer AJ, Roche A, Imossi A, Thorn E, Bobinski M, Caraos C, Lesbre P, Schlyer D, Poirier J, Reisberg B, Fowler J. Prediction of cognitive decline in normal elderly subjects with 2-[18F]fluoro-2-deoxy-D-glucose/positron-emission tomography (FDG/PET) Proc Natl Acad Sci USA. 2001;98:10966–71. doi: 10.1073/pnas.191044198. [DOI] [PMC free article] [PubMed] [Google Scholar]
- 9.De Santi S, de Leon MJ, Rusinek H, Convit A, Tarshish CY, Boppana M, Tsui WH, Daisley K, Wang GJ, Schlyer D. Hippocampal formation glucose metabolism and volume losses in MCI and AD. Neurobiol Aging. 2001;22:529–39. doi: 10.1016/s0197-4580(01)00230-5. [DOI] [PubMed] [Google Scholar]
- 10.De Santi S, Li J, Reisberg B, Notkin-Schwab R, Rogers K, Williams S, Tierney M, Ferris S, de Leon MJ. How Good are Single Amnestic and Multiple Domains for Characterizing MCI Patients at Risk for AD? Alzh Dementia. 2005;1:S81. [Google Scholar]
- 11.den Heijer T, Geerlings MI, Hoebeek FE, Hofman A, Koudstaal PJ, Breteler M. Use of Hippocampal and Amygdalar Volumes on Magnetic Resonance Imaging to Predict Dementia in Cognitively Intact Elderly People. Arch Gen Psychiat. 2006;63:57–62. doi: 10.1001/archpsyc.63.1.57. [DOI] [PubMed] [Google Scholar]
- 12.Diggle PJ, Heagerty P, Liang K-Y, Zeger SC. Analysis of Longitudinal Data. New York: Oxford University Press; 2002. [Google Scholar]
- 13.Drzezga A, Grimmer T, Riemenschneider M, Lautenschlager N, Siebner H, Alexopoulus P, Minoshima S, Schwaiger M, Kurz A. Prediction of individual outcome in MCI by means of genetic assessment and 18F-FDG PET. J Nucl Med. 2005;46:1625–32. [PubMed] [Google Scholar]
- 14.Drzezga A, Lautenschlager N, Siebner H, Riemenschneider M, Willoch F, Minoshima S, Schwaiger M, Kurz A. Cerebral metabolic changes accompanying conversion of mild cognitive impairment into Alzheimer’s disease: a PET follow-up study. Eur J Nucl Med. 2003;30:1104–13. doi: 10.1007/s00259-003-1194-1. [DOI] [PubMed] [Google Scholar]
- 15.Folstein M. The Mini-Mental State Examination. In: Crook T, Ferris SH, Bartus R, editors. Assessment in Geriatric Psychopharmacology. New Canaan: Mark Powley Associates; 1983. pp. 47–51. [Google Scholar]
- 16.Fox NC, Crum WR, Scahill RI, Stevens JM, Janssen JC, Rossor MN. Imaging of onset and progression of Alzheimer’s disease with voxel-compression mapping of serial magnetic resonance images. Lancet. 2001;358:201–5. doi: 10.1016/S0140-6736(01)05408-3. [DOI] [PubMed] [Google Scholar]
- 17.Fox NC, Warrington EK, Rossor MN. Serial magnetic resonance imaging of cerebral atrophy in preclinical Alzheimer’s disease. Lancet. 1999;353:2125. doi: 10.1016/S0140-6736(99)00496-1. [DOI] [PubMed] [Google Scholar]
- 18.Frank RA, Galasko D, Hampel H, Hardy J, de Leon MJ, Mehta PD, Rogers J, Siemers E, Trojanowski JQ. Biological markers for therapeutic trials in Alzheimer’s disease: Proceedings of the biological markers working group; NIA initiative on neuroimaging in Alzheimer’s disease. Neurobiol Aging. 2003;24:521–36. doi: 10.1016/s0197-4580(03)00002-2. [DOI] [PubMed] [Google Scholar]
- 19.Friston KJ, Holmes AP, Worsley KJ, Poline J-P, Frith CD, Frackowiak RSJ. Statistical parametric maps in functional imaging: A general linear approach. Hum Brain Mapping. 1995;2:189–210. [Google Scholar]
- 20.Friston KJ, Stephan KE, Lund TE, Morcom A, Kiebel SJ. Mixed-effects and fMRI studies. Neuroimage. 2004;24:244–52. doi: 10.1016/j.neuroimage.2004.08.055. [DOI] [PubMed] [Google Scholar]
- 21.Gauthier S, Reisberg B, Zaudig M, Petersen RC, Ritchie K, Broich K, Belleville S, Brodaty H, Bennett D, Cummings J, de Leon MJ, Feldman H, Ganguli M, Hampel H, Scheltens P, Tierney M, Whitehouse P, Winblad B. Mild cognitive impairment. Lancet. 2006;367:1262–70. doi: 10.1016/S0140-6736(06)68542-5. [DOI] [PubMed] [Google Scholar]
- 22.Geerlings MI, Jonker C, Bouter LM, Ader HJ, Schmand B. Association between memory complaints and incident Alzheimer’s disease in elderly people with normal baseline cognition. Am J Psychiat. 1999;156:531–7. doi: 10.1176/ajp.156.4.531. [DOI] [PubMed] [Google Scholar]
- 23.Hachinski VC, Lassen NA, Marshall J. Multi-infarct dementia, a cause of mental deterioration in the elderly. Lancet. 1974;2:207–10. doi: 10.1016/s0140-6736(74)91496-2. [DOI] [PubMed] [Google Scholar]
- 24.Haxby JV, Grady CL, Koss E, Horwitz B, Heston L, Schapiro M, Friedland RP, Rapoport SI. Longitudinal study of cerebral metabolic asymmetries and associated neuropsychological patterns in early dementia of the Alzheimer type. Arch Neurol. 1990;47:753–60. doi: 10.1001/archneur.1990.00530070043010. [DOI] [PubMed] [Google Scholar]
- 25.Hosmer DW, Jr, Lemeshow S. In: Parametric regression models. Hosmer DW Jr, Lemeshow S, editors. New York, NY: Wiley; 1999. pp. 289–99. [Google Scholar]
- 26.Ibanez V, Pietrini P, Alexander GE, Furey ML, Teichberg D, Rajapakse JC, Rapoport SI, Schapiro M, Horwitz B. Regional gluose metabolic abnormalities are not the result of atrophy in Alzheimer’s disease. Neurology. 1999;50:1585–93. doi: 10.1212/wnl.50.6.1585. [DOI] [PubMed] [Google Scholar]
- 27.Jack CR, Shiung MM, Gunter JL, O’Brien PC, Weigand SD, Knopman DS, Boeve BF, Ivnik RJ, Smith GE, Cha RH, Tangalos EG, Petersen RC. Comparison of different MRI brain atrophy rate measures with clinical disease progression in AD. Neurology. 2004;62:591–600. doi: 10.1212/01.wnl.0000110315.26026.ef. [DOI] [PMC free article] [PubMed] [Google Scholar]
- 28.Jonker C, Geerlings MI, Schmand B. Are memory complaints predictive for dementia? A review of clinical and population-based studies. Int J Geriatr Psych. 2000;15:983–91. doi: 10.1002/1099-1166(200011)15:11<983::aid-gps238>3.0.co;2-5. [DOI] [PubMed] [Google Scholar]
- 29.Klunk WE, Engler H, Nordberg A, Yanming W, Blomqvist G, Holt DP, Bergstrom M, Savitcheva I, Huang GF, Estrada S, Ausen B, Debnath ML, Barletta J, Price JC, Sandell J, Lopresti BJ, Wall A, Koivisto P, Antoni Mathis CA, Langstrom B. Imaging brain amyloid in Alzheimer’s disease with Pittsburgh Compound-B. Ann Neurol. 2004;55:306–19. doi: 10.1002/ana.20009. [DOI] [PubMed] [Google Scholar]
- 30.Maldjian JA, Laurienti PJ, Kraft RA, Burdette JH. An automated method for neuroanatomic and cytoarchitectonic atlas-based interrogation of fMRI data sets. Neuroimage. 2003;19:1233–9. doi: 10.1016/s1053-8119(03)00169-1. [DOI] [PubMed] [Google Scholar]
- 31.McKhann G, Drachman D, Folstein M, Katzman R, Price D, Stadlan EM. Clinical diagnosis of Alzheimer’s disease: Report of the NINCDS-ADRDA work group under the auspices of Department of Health & Human Services Task Force on Alzheimer’s disease. Neurology. 1984;34:939–44. doi: 10.1212/wnl.34.7.939. [DOI] [PubMed] [Google Scholar]
- 32.Meltzer CC, Leal JP, Mayberg HS, Wagner HN, Jr, Frost JJ. Correction of PET data for partial volume effects in human cerebral cortex by MR imaging. J Comp Assist Tomography. 1990;14:561–70. doi: 10.1097/00004728-199007000-00011. [DOI] [PubMed] [Google Scholar]
- 33.Mesulam MM. Neuroplasticity failure in Alzheimer’s disease: bridging the gap between plaques and tangles. Neuron. 1999;24:521–9. doi: 10.1016/s0896-6273(00)81109-5. [DOI] [PubMed] [Google Scholar]
- 34.Minoshima S, Frey KA, Foster NL, Kuhl DE. Preserved pontine glucose metabolism in Alzheimer’s Disease: a reference region for functional brain image (PET) analysis. J Comp Assist Tomography. 1995;19:541–7. doi: 10.1097/00004728-199507000-00006. [DOI] [PubMed] [Google Scholar]
- 35.Minoshima S, Giordani B, Berent S, Frey KA, Foster NL, Kuhl DE. Metabolic reduction in the posterior cingulate cortex in very early Alzheimer’s Disease. Ann Neurol. 1997;42:85–94. doi: 10.1002/ana.410420114. [DOI] [PubMed] [Google Scholar]
- 36.Morrison JH, Hof PR. Life and death of neurons in the aging brain. Science. 1997;278:412–9. doi: 10.1126/science.278.5337.412. [DOI] [PubMed] [Google Scholar]
- 37.Mosconi L. Brain glucose metabolism in the early and specific diagnosis of Alzheimer’s disease. Eur J Nucl Med. 2005;32:486–510. doi: 10.1007/s00259-005-1762-7. [DOI] [PubMed] [Google Scholar]
- 38.Mosconi L, De Santi S, Li Y, Li J, Zhan J, Tsui WH, Boppana M, Pupi A, de Leon MJ. Visual rating of medial temporal lobe metabolism in mild cognitive impairment and Alzheimer’s disease using FDG-PET. Eur J Nucl Med. 2006;33:210–21. doi: 10.1007/s00259-005-1956-z. [DOI] [PubMed] [Google Scholar]
- 39.Mosconi L, Perani D, Sorbi S, Herholz K, Nacmias B, Holthoff V, Salmon E, Baron J-C, De Cristofaro MTR, Padovani A, Borroni B, Franceschi M, Bracco L, Pupi A. MCI conversion to dementia and the APOE genotype: a prediction study with FDG-PET. Neurology. 2004;63:2332–40. doi: 10.1212/01.wnl.0000147469.18313.3b. [DOI] [PubMed] [Google Scholar]
- 40.Mosconi L, Tsui WH, De Santi S, Rusinek H, Li J, Convit A, Li Y, de Leon MJ. Reduced Hippocampal metabolism in Mild Cognitive Impairment and Alzheimer’s disease: automated FDG-PET Image Analysis. Neurology. 2005;64:1860–7. doi: 10.1212/01.WNL.0000163856.13524.08. [DOI] [PubMed] [Google Scholar]
- 41.Nestor PJ, Fryer TD, Smielewski P, Hodges JR. Limbic hypometabolism in Alzheimer’s disease and mild cognitive impairment. Ann Neurol. 2003;54:343–51. doi: 10.1002/ana.10669. [DOI] [PubMed] [Google Scholar]
- 42.Nestor PJ, Scheltens P, Hodges JR. Advances in the early detection of Alzheimer’s disease. Nat Med. 2004;10:S34–41. doi: 10.1038/nrn1433. [DOI] [PubMed] [Google Scholar]
- 43.Nicoll JAR, Wilkinson D, Holmes C, Steart P, Markham H, Weller RO. Neuropathology of human Alzheimer disease after immunization with amyloid-[beta] peptide: a case report. Nat Med. 2003;9:448–52. doi: 10.1038/nm840. [DOI] [PubMed] [Google Scholar]
- 44.Petersen RC, Smith GE, Waring SC, Ivnik RJ, Tangalos EG, Kokmen E. Mild cognitive impairment: clinical characterization and outcome. Arch Neurol. 1999;56:303–8. doi: 10.1001/archneur.56.3.303. [DOI] [PubMed] [Google Scholar]
- 45.Purser JL, Fillenbaum GG, Wallace RB. Memory Complaint Is Not Necessary for Diagnosis of Mild Cognitive Impairment and Does Not Predict 10-Year Trajectories of Functional Disability, Word Recall, or Short Portable Mental Status Questionnaire Limitations. J Am Geriatr Soc. 2006;54:335–8. doi: 10.1111/j.1532-5415.2005.00589.x. [DOI] [PubMed] [Google Scholar]
- 46.Reed BR, Jagust WJ, Seab JP, Ober BA. Memory and regional cerebral blood flow in mildly symptomatic Alzheimer’s disease. Neurology. 1989;39:1537–9. doi: 10.1212/wnl.39.11.1537. [DOI] [PubMed] [Google Scholar]
- 47.Reiman EM, Chen K, Alexander GE, Caselli RJ, Bandy D, Osborne D, Saunders AM, Hardy J. Functional brain abnormalities in young adults at genetic risk for late-onset Alzheimer’s dementia. Proc Natl Acad Sci USA. 2004;101:284–9. doi: 10.1073/pnas.2635903100. [DOI] [PMC free article] [PubMed] [Google Scholar]
- 48.Reisberg B, Ferris SH, de Leon MJ, Crook T. The global deterioration scale for assessment of primary degenerative dementia. Am J Psychiat. 1982;139:1136–9. doi: 10.1176/ajp.139.9.1136. [DOI] [PubMed] [Google Scholar]
- 49.Reivich M, Alavi A, Wolf A, Fowler J, Russell J, Arnett C, MacGregor RR, Shiue CY, Atkins H, Anand A, Dann R, Greenberg J. Glucose metabolic rate kinetic model parameter determination in humans: The lumped constants and rate constants for [18F]fluorodeoxyglucose and [11C]deoxyglucose. J Cereb Blood Flow Metab. 1985;5:179–92. doi: 10.1038/jcbfm.1985.24. [DOI] [PubMed] [Google Scholar]
- 50.Rusinek H, Chandra R. Accuracy of tissue volume determination from MRI: A phantom study. Invest Radiology. 1993;28:890–5. doi: 10.1097/00004424-199310000-00004. [DOI] [PubMed] [Google Scholar]
- 51.Rusinek H, De Santi S, Frid D, Tsui W, Tarshish C, Convit A, de Leon MJ. Regional brain atrophy rate predicts future cognitive decline: 6-year longitudinal MR imaging study of normal aging. Radiology. 2003;229:691–6. doi: 10.1148/radiol.2293021299. [DOI] [PubMed] [Google Scholar]
- 52.Schenk D, Barbour R, Dunn W, Gordon G, Grajeda H, Guido T, Hu K, Huang J, Johnson-Wood K, Khan K, Kholodenko D, Lee M, Liao Z, Lieberburg I, Motter R, Mutter L, Soriano F, Shopp G, et al. Immunization with amyloid-beta attenuates Alzheimer-disease-like pathology in the PDAPP mouse. Nature. 1999;400:173–7. doi: 10.1038/22124. [DOI] [PubMed] [Google Scholar]
- 53.Silverman DHS, Small GW, Chang CY, Lu CS, Kung de Aburto MA, Chen W, Czernin J, Rapoport SI, Pietrini P, Alexander GE, Schapiro MB, Jagust WJ, Hoffman JH, Welsh-Bohmer KA, Alavi A, Clark CM, Salmon E, de Leon MJ, Mielke R, Cummings JL, Kowell AP, Gambhir SS, Hoh CK, Phelps ME. Positron emission tomography in evaluation of dementia: Regional brain metabolism and long-term outcome. JAMA. 2001;286:2120–7. doi: 10.1001/jama.286.17.2120. [DOI] [PubMed] [Google Scholar]
- 54.Small GW, Mazziotta JC, Collins MT, Baxter LR, Phelps ME, Mandelkern MA, Kaplan A, LaRue A, Adamson CF, Chang L, Guze BH, Corder EH, Saunders AM, Haines JL, Pericak-Vance MA, Roses AD. Apolipoprotein E type 4 allele and cerebral glucose metabolism in relatives at risk for familial Alzheimer’s disease. JAMA. 1995;273:942–7. [PubMed] [Google Scholar]
- 55.Sokoloff L, Reivich M, Kennedy C, Des Rosiers MH, Patlak CS, Pettigrew KD, Sakurada O, Shinohara M. The [14C]deoxyglucose method for the measurement of local cerebral glucose utilization: theory, procedure, and normal values in the conscious and anesthetized albino rat. J Neurochem. 1977;28:897–916. doi: 10.1111/j.1471-4159.1977.tb10649.x. [DOI] [PubMed] [Google Scholar]
- 56.Talairach J, Tournoux P. Co-Planar stereotaxic atlas of the human brain. Stuttgart: Thieme; 1988. [Google Scholar]
- 57.Vander Borght T, Minoshima S, Giordani B, Foster NL, Frey KA, Berent S, Albin RL, Koeppe RA, Kuhl DE. Cerebral metabolic differences in Parkinson’s and Alzheimer’s disease matched for dementia severity. J Nucl Med. 1997;38:797–802. [PubMed] [Google Scholar]