

Abstract
Almost all diseases affect blood vessel attributes (vessel number, radius, tortuosity, and branching pattern). Quantitative measurement of vessel attributes over relevant vessel populations could thus provide an important means of diagnosing and staging disease. Unfortunately, little is known about the statistical properties of vessel attributes. In particular, it is unclear whether vessel attributes fit a Gaussian distribution, how dependent these values are upon anatomical location, and how best to represent the attribute values of the multiple vessels comprising a population of interest in a single patient.
The purpose of this report is to explore the distributions of several vessel attributes over vessel populations located in different parts of the head. In thirteen healthy subjects, we extract vessels from MRA data, define vessel trees comprising the anterior cerebral, right and left middle cerebral, and posterior cerebral circulations, and, for each of these four populations, analyze the vessel number, average radius, branching frequency, and tortuosity. For the parameters analyzed, we conclude that statistical methods employing summary measures for each attribute within each region of interest for each patient are preferable to methods that deal with individual vessels, that the distributions of the summary measures are indeed Gaussian, and that attribute values may differ by anatomical location. These results should be useful in designing studies that compare patients with suspected disease to a database of healthy subjects and are relevant to groups interested in atlas formation and in the statistics of tubular objects.
Keywords: magnetic resonance angiography, cerebral blood vessels, tortuosity, segmentation, morphology, vessel trees
1. Introduction
Blood vessels surround and permeate the organs of the human body. Almost every disease from cancer to the common cold affects vessel attributes (vessel number, radius, branching frequency, and tortuosity). Cancer, for example, induces ingrowth of abnormal clusters of abnormally tortuous vessels (Folkman, 2000; Baish et al., 2000), and successful treatment normalizes vessel shape (Jain, 2001). Hypertension, diabetes, and many automimmune diseases produce narrowing of major arteries and an increase in vascular tortuosity (Hiroki et. al, 2002; Spangler et al.,1994). Chronic inflammation induces neoangeogenesis (McDonald, 2001). Even the common cold affects vessel morphology by inducing vasodilation (Ferguson, 1997)! An automated, quantitative measurement of three-dimensional (3D) vessel attributes as defined from high resolution, magnetic resonance (MR) images could thus provide a new method of diagnosing and staging disease. A requirement of this type of analysis is the statistical evaluation of populations of vessels in both diseased and healthy subjects.
Our group has begun to investigate changes in vessel morphology induced by various disease states using methods that compare vessel attributes of patients with known disease to the vessel attributes of a healthy patient database. Preliminary results suggest the ability to detect the abnormal vessel tortuosity associated with hypertension (Bullitt et. al., 2003a), the abnormal vessel density and tortuosity associated with arteriovenous malformations (Bullitt et. al., 2003a), and vessel morphological changes associated with malignancy (Bullitt et. al., 2003a, 2003b, 2004). However, to date, our analyses have operated under the assumptions that the variables of interest have a Gaussian distribution, that vessel morphology is likely to change from location to location within the head, and that it is desirable to employ summary measures for each relevant cluster of vessels in each patient. In fact, almost nothing is known about the attribute distribution of 3D intracranial vessel populations. The assumptions made during our initial analyses thus might or might not be correct.
The purpose of this paper is to explore some of the statistical properties of blood vessel populations within the healthy intracerebral circulation. For thirteen healthy subjects, we examine vessel attributes of the anterior cerebral, the left and right middle cerebral, and the posterior cerebral circulations. Attributes analyzed for each vessel group include the number of segmented vessels, tortuosity as calculated by four metrics, average radius, and branching frequency. Questions asked are whether these variables fit a Gaussian distribution, whether analysis by individual vessel or by averaging results over multiple vessels for each person is more effective, and whether vessel attributes vary by anatomical location. We conclude that, for the parameters analyzed, 1) the use of summary measures within each region of interest for each patient is preferable to a vessel-by-vessel analysis, 2) that the summary parameters analyzed do indeed fit a Gaussian distribution, and 3) that the values of parameters of interest may vary from location to location within the head. These results both validate the assumptions made during our earlier analyses and should be helpful to any group interested in exploring the morphological properties of vessel populations in health and disease.
2. Background
2.1 Measurement of vessel attributes
The concept of using vascular morphology to diagnose or quantitate disease is not new. Frangi et. al. (1999a, 1999b), for example, are attempting to quantitate carotid stenosis, and De Bruijne et. al. (2002) aim to characterize aortic aneurysms.
One of the most interesting vessel attributes is “tortuosity”, or the extent to which a vessel twists and turns. We are particularly interested in tortuosity because the vessels associated with malignant tumors exhibit “…a profound sort of tortuosity, with many smaller bends upon each larger bend” (Baish et al., 2000). This abnormality may be related to increases in nitrous oxide induced by VegF (Folkman, 2000), and is present in malignant tumors of the lung (Helmlinger et. al., 2002), colon (Siemann, 2002), breast (Lau et. al., 1999), and brain (Burger et.al., 1991).
The majority of literature on determining vessel tortuosity within medical images has focused upon 2D retinal images and the diagnosis and staging of retinopathy of prematurity. The most common measure is the “Distance Metric” (DM), or the total path length of a vessel divided by the linear distance between its endpoints (Smedby et. al., 1993; Bracher, 1982; Zhou et. al., 1994; Goldbaum et. al, 1994; Hart et. al.,1999). Brey et. al. (2002) extended this metric to 3D for analysis of vessels in histological section. A problem with the DM when analyzing the usually tortuous intracerebral circulation, however, is that the DM often assigns a higher tortuosity value to a healthy, long, “S” or “U” shaped vessel than to a shorter, abnormal vessel possessing tight coils or high frequency oscillations. Baish et. al. (2000) and Sabo et. al. (2001) are each attempting to characterize tumor malignancy on the basis of vessel tortuosity by using microvessel fractal dimensions as seen within histological sections.
One difficulty in detecting and analyzing abnormal vessel tortuosity on medical images is that what the clinician defines as an “abnormally tortuous” pattern actually includes several different shapes. We have previously classified abnormal tortuosity into three types (Bullitt et. al., 2003a). Type 1 occurs when a vessel elongates and becomes sinuous, as may occur with retinopathy of prematurity (Hart et. al., 1999), with hypertension and aging (Spangler et. al., 1994), and with a variety of other disease processes. Type 2 is characterized by vessels that make frequent changes of direction and may appear as a “bag of worms”, as occurs within the nidus of arteriovenous malformations (Burger et. al., 1991) and in milder form within hypervascular tumors. Type 3 is characterized by high-frequency, low-amplitude oscillations or coils, and is associated with the neovascularity produced by malignant tumors (Baish et. al., 2000).
We have also reported two tortuosity metrics capable of detecting abnormal tortuosity within the intracranial vasculature (Bullitt et. al., 2003a). The “Inflection Count Metric” (ICM) multiplies the number of inflections (plus one) present in a 3D space curve by the DM. The ICM is excellent in defining tortuosity types 1 and 2, but fails with type 3. The “Sum of Angles Metric” (SOAM) sums curvatures along a sampled space curve and normalizes by path length. This metric can be implemented either to provide in-plane curvature alone (SOAM1) or to also incorporate torsion (SOAM2), with the latter providing more information but also introducing noise. By either approach, the SOAM handles tortuosity type 3 well but can fail with types 1 and 2. Additional detail is available in (Bullitt et. al., 2003a).
The current report includes analysis of regional, healthy vessel tortuosity by the DM, by the ICM, and by both variants of the SOAM. We also evaluate vessel number, average radius, and branching frequency in each anatomical location. Whether the distribution of any or all of these parameters is Gaussian is unknown. Whether it is preferable to examine each parameter using a group summary value or to perform the analysis on a vessel by vessel basis is also unknown. Whether variables such as tortuosity vary by anatomical location is also unknown. All three questions are examined under the work described in this report.
2.2 Human intracerebral vascular anatomy
When possible, it is preferable to perform vessel attribute comparisons using single vessels that can be unequivocally mapped from patient to patient. However, human intracerebral vascular anatomy is both plethoric and variable, making it impossible to provide a one-to-one vessel mapping between patients for more than a few, large, named vessels. The automated detection of abnormal vessel attributes for vessel clusters therefore must make one of two assumptions: 1) that a single definition of a “healthy vessel” can be defined that applies to ALL intracerebral vessels, or 2) that the standard may vary from location to location, thus requiring evaluation of any test subject against the values obtained from healthy vessels located in similar regions.
On anatomical grounds, it seems reasonable to assume that at least some vessel attributes may vary according to location, and our earlier work has proceeded under this assumption. For attributes such as vessel radius, for example, it is certain that anatomical location will make a difference, since the region of the skull base contains large arteries entering the brain whereas peripheral cortical regions contain only small, terminal arteries. Similarly, vessel density as seen by MRA is very high in regions such as the Sylvian fissure, and low in regions such as the thalamus. It is less obvious, however, if and how other attributes, such as tortuosity, vary by anatomical location.
Under the current report, we analyze and compare vessel attributes of the anterior cerebral circulation (a connected set of vessels that supplies the front and top of the head), the two middle cerebral circulations (each comprising a connected set of vessels that supplies one side of the head), and the posterior cerebral circulation (a connected set of vessels that supplies the back of the head). These four vessel clusters represent natural subdivisions of the intracerebral circulation and consist of vessel trees whose roots are large, named vessels readily recognized from patient to patient. Other methods of subdividing the intracranial circulation are obviously possible, but this tree-based approach has the advantage of mapping similar anatomical regions between patients without requiring a deformable registration that might itself affect vessel attribute values. The goal in comparing these 4 vascular groups is to determine if vessel attributes such as tortuosity are likely to vary by general anatomical location.
2.3. Vessel segmentation and graph description
The methods described in this report require the extraction of vessels from 3D image data, the recognition of anatomically meaningful branchpoints, and data structures providing graph descriptions of connected vasculature. Many groups have described methods of segmenting vessels from MRA, with some investigators also proposing graph formation (Chung et. al., 1999; Feldmar et. al., 1997; Masutani et. al., 1995; Tek et. al., 1995; Lorenz et. al., 1997; Wilson et. al., 1999; Gerig et. al., 1993; Sato et. al., 1998; Frangi et. al., 1999b; Niessen et. al., 1999; Lorigo et. al, 2001; Lei et. al., 2001; Krissian 2002). Aylward et. al. (2002) review a number of vessel segmentation approaches.
The approach employed in this report is not dependent upon any specific method of vessel extraction, graph description, or tree editing. However, our methods require vessel segmentations that produce ordered sets of 3D points describing each vessel’s skeleton curve with a radius at each skeleton point, a meaningful method of recognizing branch points, and a set of editing tools that can both change parent-child connections around the Circle of Willis and allow clipping of subtrees so as to standardize anatomical circulatory patterns from patient to patient.
3. Methods
3.1 Image acquisition, vessel segmentation, and tree definition
This study employed thirteen healthy, right-handed volunteers, aged 22 – 54. Ten subjects were male and three were female. All subjects were imaged by 3D, time-of-flight MRA on a Siemens head-only 3T system (Allegra, Siemens Medical Systems Inc., Germany) with a gradient strength of 40 mT/m and a slew rate of 400 mT/m/msec. Velocity compensation along both frequency and phase encoding directions was used to minimize signal dephasing induced by the flowing spins. In addition, a magnetization transfer pulse was employed to suppress signal from brain parenchyma while maintaining signal from flowing spins and thus improving the visibility of brain vasculature. The spatial volume included the top of the head through the skull base. Each MRA comprised 512 x 512 x (approximately) 120 voxels. The first eleven cases were obtained at 0.4 x 0.4 x 1.25 mm3 voxel spacing; later cases were obtained at 0.5 x 0.5 x 0.8 mm3.
Vessel extraction was performed by the method of Aylward et. al. (2002). Segmentation of each vessel begins from a seed point. The method then automatically tracks the image intensity ridge representing the vessel skeleton in 3D, using dynamic scaling and automated calculation of vessel width at each skeleton point. Since the method extracts only objects approximately circular in cross-section, it resists inclusion of non-vessel objects. An advantage of the approach is that it is capable of defining even very small vessels. Aylward et. al. (2002) provide results of tests in synthetic data with added Gaussian noise. The output of the program is a set of directed, 4-dimensional points indicating the (x,y,z) spatial position of each sequential vessel skeleton point with an associated radius at each point. It takes approximately ½ hour to process an MRA of 512 x 512 x 120 voxels.
The output of the vessel segmentation program provides a detailed but disconnected set of vessels, each of whose directions (from the first point to the last) may or may not correctly indicate the direction of flow within that vessel. We therefore post-process the initial segmentation to produce a set of connected vessel trees. The method requires the user to define one or more roots (for the head, roots are usually defined as the two carotid arteries and the basilar artery). The program then automatically calculates parent-child relationships on the basis of distance and the existence of supporting image intensity information using a modified minimum spanning tree algorithm (Bullitt et. al., 2001). If the connection distance is too large or if the image intensity data does not support the connection, a potential child vessel is discarded. This process automatically discards most venous structures. It takes about a minute to perform this post-processing step.
Once vessel trees are established, it then becomes possible, if desired, to manually manipulate individual vessels, trees of vessels, or subtrees of vessels within a 3D display. By a single “point and click” one can delete either an individual vessel or a connected subtree of vessels. By a pair of “point and clicks” one can also disconnect an entire subtree from its parent and reassign parentage to a different vessel. A single point and click can also be used to clip a vessel and its appropriately associated subtrees either proximally or distally. These editing abilities are important to the current project, in which we aim to standardize major circulatory subtrees across patients under conditions in which there is considerable variability in the healthy intracerebral circulation.
More specifically, there is large variability in the usual flow pattern around the Circle of Willis. In order to standardize the vessel subtrees (and thus the anatomical regions) analyzed from patient to patient, we used the editing tools available in the tree-formation program to redirect flow around the Circle of Willis when needed and to clip feeding vessels at points recognizable in all subjects. Even more specifically, the anterior and both middle cerebral circulatory groups were isolated in each patient, and the posterior circulation was defined as the tip of the basilar, both posterior cerebral arteries, and all vessels receiving flow from these arteries. For each analysis of each part of the circulation, all irrelevant trees/subtrees were manually identified and “turned off”.
Figure 1 illustrates AP, lateral, and axial views of the vessel trees segmented from one of the healthy subjects. Vessel trees have been color-coded to indicate the four circulatory regions analyzed in each patient.
Figure 1.
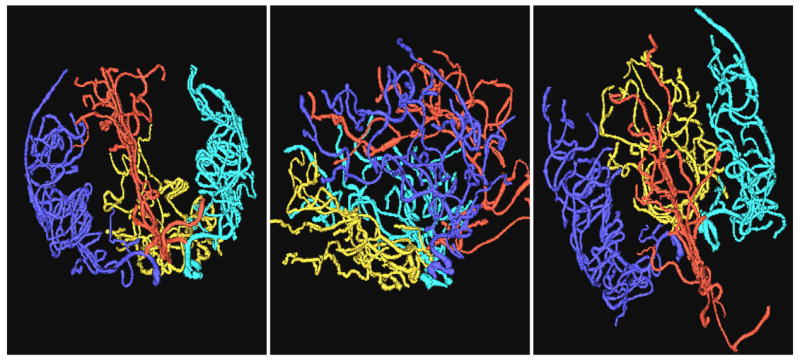
Vessel trees color-coded to show the anterior cerebral group (red), left middle cerebral group (cyan), right middle cerebral group (blue) and posterior cerebral group (gold).
One additional post-processing step was performed to help standardize vessel trees across patients. The vessel segmentation program generally extracts long vessels that proceed past multiple branchpoints, but will sometimes break at branchpoints or at places of high curvature. Such sites of breakage will not be consistent from patient to patient, and might complicate any analysis that employs vessel length or number. Following tree formation, these situations are represented as a parent vessel with one or two child branches arising from the parent’s final point. We therefore added an automatic post-processing step that concatenates a parent-child pair into a single vessel when one or more child branches arise from the last point of the original parent. If two child branches are present, the child of larger radius is taken to be the continuation of the parent. Following concatenation, each of the four circulatory groups contained, on average, between 40 and 50 vessels.
It takes about thirty minutes to extract vessels and to define the three primary intracerebral vessel trees. As this project requires additional manual editing to standardize circulatory flow around the Circle of Willis and to “turn off” each set of extraneous trees/subtrees for each group analysis, however, the process takes an additional 15 minutes, with an additional 15 minutes required to run four subtrees against the healthy database. The total processing time is therefore about an hour for each case.
This paper examines only arterial vessel trees. The MRA acquisition parameters exclude all but the largest veins, although portions of the sagittal sinus and a few large cortical veins are often included in the initial vessel segmentation. Since these veins are not directly connected to arterial trees, however, almost all extraneous veins are automatically excluded during the tree formation process. If a residual vein does remain, it can be manually deleted using the editing tools in the tree formation program.
3.2 Attribute determination
We use the term “group” to refer to a single set of connected vessels within a single patient (anterior cerebral group, middle cerebral group, etc). This report analyzes thirteen patients, in each of whom we have defined four vessel groups, as described earlier. For each group, we calculate seven vessel attributes.
The first attribute, vessel number, is applicable only to a group. The remaining six attributes can be calculated for individual vessels or can be composited to provide six group summary values for that group. As outlined in the following section, results were analyzed by both approaches. The present section outlines attribute determination for individual vessels, followed by the methods used to provide summary values for a vessel group.
For individual vessels, attributes examined include
Average radius for that vessel, as calculated by the sum of radii of all vessel points with division by the number of vessel points.
Tortuosity as measured by DM (total path length divided by the distance between endpoints).
Tortuosity as measured by ICM (DM multiplied by [inflection count + 1]).
Tortuosity as measured by SOAM1 (the sum of positive angles between each successive trio of equally spaced vessel points with division by the total path length).
Tortuosity as measured by SOAM2 (similar to the metric above, but operates on successive quartets of vessel points and includes torsion).
Distance to child (DTC), as measured by the number of a vessel’s children divided by the vessel’s total length. This measure provides an estimate of branching frequency, with a higher number indicating a higher branching frequency per unit length.
Providing a summary value for a group attribute is straightforward for many of the metrics employed. The average radius for a vessel group, for example, is calculated by summing the radii of all vessel points within the group and then dividing by the total number of points. A similar approach is used for the two SOAM metrics, although the divisor is the sum of total path lengths rather than the number of points, thus providing an average angle per unit distance. A similar metric is also used for DTC by summing the total number of children and dividing by the sum of path lengths, so as to provide an average number of child branches per unit distance.
It is less obvious how to provide an “average” value for the DM and the ICM. These metrics each provide ratios in which, for an individual vessel, an increase in the number of points considered does not necessarily provide monotonic increases in both the numerator and denominator. In our past analyses [Bullitt 2003a,b] and in this paper as well, we therefore provide a group summary value for the DM by summing the numerators reported by the DM for each vessel and then dividing by the sum of the denominators. We take the same approach with the ICM. This approach provides a weighted average with longer and more tortuous curves assigned a higher weight, and is equivalent to defining the ratio of average numerator and average denominator.
3.3 Statistical analysis
Four different measures of tortuosity were considered (DM, ICM, SOAM1, SOAM2), as well as two other vessel attributes (average radius and DTC). For all variables, the data from each of the four circulatory groups were analyzed separately. Each of the six variables was available as both a summary value for a vessel group and an individual value for a single vessel. For all variables, we evaluated whether the distributions could be assumed to be Gaussian. In addition to the obvious preference for a Gaussian distribution, we also felt it important to decide whether it is preferable to examine each parameter using vessel group summary values or individual vessel values. Once the results on Gaussian distribution were available, the preferred forms of the variables were analyzed with the multivariate approach to repeated measures Analysis of Variance (Timm, 2002). Additionally, for each variable including the number of vessels, we inspected correlations between regions within variable, and also correlations across variables within each region. Both Pearson (linear) and Spearman (rank order) correlations (SAS 1999) were examined.
3.3.1 Determination of Gaussian distribution
We followed the recommendations of Muller and Fetterman (2002) in evaluating whether a particular variable follows a Gaussian distribution. For the six vessel attributes, we computed standardized measures of skewness, excess kurtosis, and a statistical test of Gaussian distribution for both group summary values and individual values within each anatomical region. We also visually examined boxplots for each variable, with plots for the four regions side by side for comparison. Skewness is a measure of the lack of symmetry of a distribution, having a value of zero for a symmetric distribution like a Gaussian distribution. Kurtosis measures the heaviness of tails of a distribution. It is reported here as excess kurtosis, (kurtosis – 3), with 3 being the kurtosis of the standard Gaussian distribution. After adjustment, the standard Gaussian distribution has an excess kurtosis of zero. Excess skewness or kurtosis indicate that a distribution is NOT Gaussian. P-values for a test of Gaussian distribution were produced based on the Shapiro-Wilks test statistic (SAS 1999). The Shapiro-Wilks statistic reflects discrepancies from a Gaussian distribution for particular values of the variable (via "order statistic" properties), while skewnewss and kurtosis look at imbalance for the whole set of values.
The second step was to evaluate whether a simple (smooth and monotone) transformation of a variable would help make the distributions more Gaussian. The transformation can be chosen based on skewness, excess kurtosis, and the test from original variables (Muller et. al.,, 2002). We applied square root, log, and reciprocal of square root transformations and computed the same criterion measures for Gaussian distribution. Heavy right tails (large positive values of skewness and excess kurtosis), for example, may be reduced by such transformations. We began by comparing the diagnostic statistics for the original and transformed summary measures. We chose a transformation as the best compromise in a global sense, by considering results across regions. In some cases, a different transformation might be preferred if considering a variable for a particular region by itself.
We then repeated the process with the single vessel variables. Observations were initially pooled by group across the eleven subjects, resulting in four pools each containing 450–500 vessels, following which each observation was treated invididually within each pooled group. Pooling correlated observations may have created some bias toward making the data appear more homogeneous. However, as reported below, the observed heterogeneity led us to choose the summary variables over the individual vessel variables.
3.3.2. Vessel attribute dependence upon anatomical location
For each of the six attributes separately, we fitted a multivariate linear model to test for differences in vessel attributes between the four vessel groups, each of which represents a different anatomical region. Each individual’s data is assumed independent of the others, but the model incorporates the correlations between regions within an individual. The following steps were conducted (separately for each attribute).
We fitted a GLMM (General Linear Multivariate Model) and conducted a multivariate test for any differences anywhere in mean among the four regions.
We then performed a pairwise t-test for the difference in means for each pair of regions. Bonferroni correction was used to correct for multiple comparisons, with results for an overall F-test considered significant of p<0.0083 and for pairwise t-tests considered significant for p<0.00069.
3.3.3. Correlation analysis
For each variable, we inspected correlations between regions within variable, and also correlations between variables within each region. The generalized intraclass correlation (Kistner et. al., 2004) was calculated for each variable across regions. The (generalized) intraclass correlation may be interpreted as an index of reliability or similarity between regions. It equals the average covariance divided by the average variance, and hence summarizes the entire correlation matrix. Both Pearson (linear) and Spearman (rank order) correlations (SAS 1999) were examined for the correlations across variables within each region.
4. Results
4.1 Tests for Gaussian distribution: summary measures
As outlined earlier, initial evaluations were performed by computing skewness, excess kurtosis, and a test of deviation from Gaussian distribution for all six attributes within each of the four anatomical regions. Despite the small number of patients (13), almost all summary measures appeared to follow a Gaussian distribution, with small skewness and excess kurtosis, and large p-value for deviation from Gaussian. Small p-values were observed for average radius in posterior cerebral region (p-value=.0045), DTC in right middle cerebral region (p-value=.0052), and DM in the anterior cerebral region (p-value=.024). The distributions were deemed to be plausibly Gaussian for two reasons. First, conducting 24 tests of Gaussian distribution greatly increases the chance of a false positive. Second, the three small p-values are scattered across region and variable. It would be more bothersome if the small p-values were concentrated in a region or variable. Hence we chose not to transform any measures.
Table 1 provides an example by showing the mean, standard deviation, skewness, excess kurtosis, and p-value for deviation from Gaussian distribution for SOAM1 by region. For each region, the small skewness and excess kurtosis values, as well as the large p-values, provide evidence that the distribution of SOAM1 (as a summary value) is not far from Gaussian. From the side-by-side boxplot (Figure 2), we can see that the distributions are symmetric and that there are few outliers. Obviously the plots suggest difference in SOAM1 between regions. This question is addressed more precisely in section 4.3 below.
Table 1.
Evaluation of Gaussian distribution for summary measure SOAM1 (radian/cm). AntCer=Anterior Cerebral group. LMidCer and RMidCer = left and right middle cerebral groups. PostCer = posterior cerebral group. Results indicate that the distribution is Gaussian.
| Region | Mean | STD | Skewness | Kurtosis | p-value |
|---|---|---|---|---|---|
| AntCer | 2.86 | 0.289 | 0.80 | 0.43 | 0.4979 |
| LMidCer | 3.12 | 0.232 | −0.01 | −1.15 | 0.5756 |
| PostCer | 3.49 | 0.210 | −0.26 | −1.32 | 0.2227 |
| RMidCer | 3.17 | 0.269 | 1.16 | 1.05 | 0.1160 |
Figure 2.
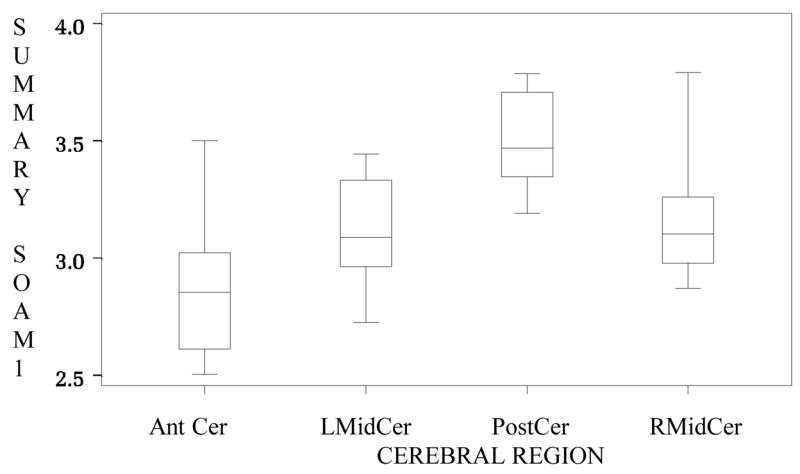
Boxplot of summary SOAM1 values by region. AntCer=anterior cerebral group. LMidCer and RMidCer = left and right middle cerebral groups. PostCer=posterior cerebral group. The distributions are symmetric and there are no outliers. Different groups appear to possess different tortuosity values.
In retrospect, the good behavior of the data likely reflects the fact that large numbers of vessels contributed to each summary measure. Each person had over 20 vessels, and most commonly 40–50, contributing to each summary measure for each region. Averaging 20 or more values minimizes the impact of outliers. Although we suspect that a version of the central limit theorem was in operation for the pure error part of the observations, which would help make the results Gaussian in appearance, the summary measures, overall, were considered as variables following a Gaussian distribution.
4.2 Tests for Gaussian distribution: individual measures
Evaluation of the individual vessel data for Gaussian distribution indicated that many of the attribute distributions were not Gaussian and possessed large positive values of skewness and excess kurtosis. Table 2 provides an example by providing the mean, standard deviation, skewness, excess kurtosis, and p-value for SOAM1 computed for individual vessels. The results are quite different from the results in Table 1, which illustrates results calculated by the same metric using summary values. Results in Table 2 are typical in that very large values of skewness and excess kurtosis occur, especially in tortuosity measures. The extremely small p-values also indicate that the distribution is not Gaussian.
Table 2.
Evaluation of Gaussian distribution for individual vessel SOAM1 (radian/cm). AntCer=Anterior Cerebral group. LMidCer and RMidCer = left and right middle cerebral groups. PostCer = posterior cerebral group. Results indicate that the distribution is NOT Gaussian.
| Region | Mean | STD | Skewness | Kurtosis | p-value |
|---|---|---|---|---|---|
| AntCer | 5.66 | 34.3 | 18.11 | 329.59 | < .0001 |
| LMidCer | 4.28 | 9.2 | 22.93 | 566.92 | < .0001 |
| PostCer | 4.30 | 2.3 | 3.67 | 30.43 | < .0001 |
| RMidCer | 4.51 | 16.5 | 25.76 | 674.09 | < .0001 |
Particular difficulty was encountered with some of the tortuosity measures, in which an occasional vessel would possess a seemingly outrageously large attribute value. Figure 3 provides an example of such a vessel from one of our healthy subjects. This vessel has an endpoint extremely close to its startpoint. Since both the DM and the ICM employ a ratio of total path distance to the distance between endpoints, the division of a large number by a tiny number will result in an enormously large value. Note that if this vessel had continued onward in almost any arbitrary direction, the start and endpoints would have become more separated and the tortuosity estimation would have been lower. The summary method smooths values, and so is less subject to this kind of outlier.
Figure 3.
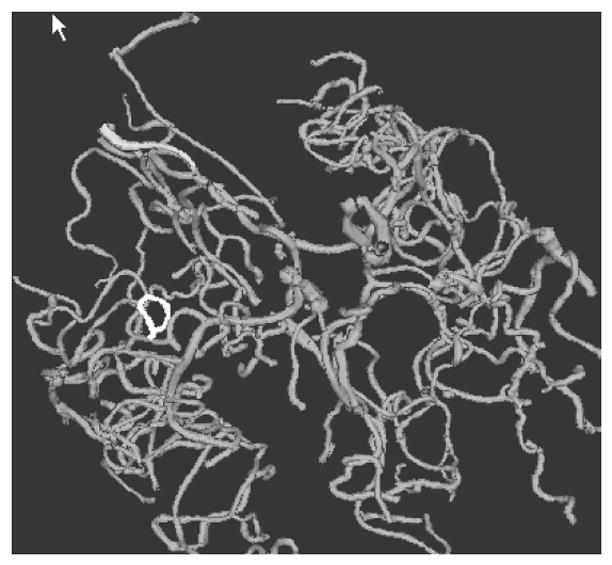
Single vessel with very large tortuosity as measured by both the DM and the ICM. The unusual vessel is shown in white and the remaining vessels in grey. This individual vessel is located in the Sylvian fissure, where a vessel may course over a gyrus and then return close to its starting point. If only this portion of a vessel is available for analysis, the long course of the vessel and the short distance between start and endpoints will provide a huge value by both the DM and ICM when vessels are analyzed individually.
In order to reduce heavy right tails (large positive skewness and excess kurtosis) we applied power transformations with power less than 1 (square root, log, and reciprocal of square root). However, this usually gave only modest improvements. Therefore we concluded that the distributions of individual values ware not Gaussian and that any transformations we tried did not make them Gaussian either.
Comparing results for summary measures and individual vessel measures made clear that summary measures were preferable because they can be treated as following Gaussian distributions. It seems indisputable that the large number of vessels underlying each summary measure induced a form of the central limit theorem (averages of independent and identically distributed random variables test to be Gaussian as the sample size increases). Gaussian distributions occurred despite the fact that measures on individual vessels are not independent (at least unconditionally), and that the summary process is nonlinear for a wide range of inputs. Summary measures also have much higher reliability than measures on single vessels. Hence only summary measures are considered in subsequent discussions
4.3 Vessel attributes and anatomical location
Knowing whether or not vessel attributes differ by anatomical location is important to the formulation of any analysis that attempts to compare populations of vessels in a test subject to a database of healthy anatomy. This report analyzes vessel attributes in four different anatomical regions, as defined by four vessel trees each supplying one region. Findings in two of these regions (the left and right middle cerebral distributions) might be reasonably expected to be similar, as these two regions represent approximately mirror locations. The remaining two anatomical regions, the anterior cerebral and posterior cerebral distributions, might or might not be different from each other or from the middle cerebral groups.
As shown by Table 3, overall tests using a General Linear Multivariate Model indicate significant differences in mean between anatomical regions for all four tortuosity measures and distance to child, but not for radius. Most importantly, as indicated by the pairwise t-tests and as obviously suggested by Figure 1, the posterior cerebral group is more tortuous, as measured by SOAM1, than any of the three other groups (Table 4). Both middle cerebral regions are also more tortuous than the anterior cerebral region by SOAM1. Similarly, the posterior cerebral group is more tortuous than the anterior and the right middle cerebral groups, as measured by SOAM2. The SOAM metrics detect high-frequency, low amplitude coils and sinusoidal curves, suggesting that vessels in the posterior circulation are more likely to display this pattern than are vessels in other regions of the circulation.
Table 3.
Test for attribute differences between groups for average radius, distance to child, both SOAM tortuosity metrics, the distance metric, and the inflection count metric as calculated by general linear multivariate modeling. CAN RSQ=canonical r-square, APPROX F=approximate F-value, NUM DF=numerator degrees of freedom, DENOM DF=denominator DF. In the final column, a p-value of less than 0.0083 is viewed as indicating significant differences between groups and is marked by a star.
| Measure | Can R2 | APPROX F | NUM DF | DENOM DF | P VALUE |
|---|---|---|---|---|---|
| RADIUS | 0.20 | 0.84 | 3 | 10 | 0.5017 |
| DISTCHLD | 0.71 | 8.00 | 3 | 10 | 0.0052 * |
| TORTANGL | 0.89 | 27.94 | 3 | 10 | <0.0001 * |
| TORTAWTO | 0.89 | 26.35 | 3 | 10 | <0.0001 * |
| TORTDIST | 0.90 | 29.02 | 3 | 10 | <0.0001 * |
| TORTINFL | 0.95 | 58.05 | 3 | 10 | <0.0001 * |
Table 4.
Pairwise t-test for differences between groups for SOAM1. AntCer= anterior cerebtral group, LMidCer and RMidCer=left and right middle cerebral groups, PostCer= posterior cerebral group. A p-value of less than 0.00069 is considered as indicative of difference, and is marked with a star.
| AntCer | LmidCer | PostCer | RMidCer | |
|---|---|---|---|---|
| AntCer | . | . | . | . |
| LMidCer | 4.86( .0004)* | . | . | . |
| PostCer | 9.66(<.0001)* | 7.58(<.0001)* | . | . |
| RMidCer | 5.15( .0002)* | 0.86( .5445) | −5.87(<.0001)* | . |
Since abnormal tortuosity as recognized by the SOAM measures is one of our criteria for detecting tumor vessels (Bullitt et. al., 2003a,b, 2004), an important implication of this finding is that comparing tortuosity of any test subject’s vessels with values from a healthy database should be done on a regional basis, using vessels in the same general anatomical vicinity.
Additional significant differences, whose clinical significances are less clear-cut, were also found. These included a decreased tortuosity of the anterior cerebral group as compared to both middle cerebral groups as measured by the DM, and an increased tortuosity of the right middle cerebral group as compared to the anterior and posterior circulations as measured by the ICM. Furthermore, although not statistically significant in this small sample, ICM data for the left middle cerebral group followed the same pattern as the right middle cerebral group, as did the DM data for the posterior cerebral and anterior groups.
Significant differences in DTC were found only between the posterior and right middle cerebral regions. The posterior region is more tortuous than the right middle region and it is also likely more tortuous than the left middle cerebral region although the result was less marked.
Perhaps not surprisingly, no differences were found in average radius between groups. This report divides vessels into groups on the basis of major vessel trees, each of which contains a root of large diameter, a number of intermediate sized vessels, and numerous small peripheral branches. If a different partitioning scheme had been employed, such as one that compares the base of brain to the cortical surface, significant differences in vessel radii would be expected.
The left and right middle cerebral circulations represent paired circulatory structures whose attributes were expected to be similar. As expected, there were no significant differences between these two groups by any of the measures employed.
4.4 Correlation Analysis
The inherent instability of correlations in such a small sample allows only rough and broad interpretations. We present this exploratory analysis primarily to generate suggestions useful in guiding future work.
All variables had low to moderately strong generalized intraclass correlation, with highest correlations for average radius (.75, 95% CI of .52-.), middle values for DTC (.55, 95% CI of .28–.79), SOAM1 (.64, 95% CI of .39–.85), and SOAM2 (.52, 95% CI of .24–.77), and lowest values for DM (.31, 95% CI of .04–.63) and ICM (.47, 95% CI of .21–.72). There were no remarkable differences between the Pearson and Spearman correlation results in any case. Except for only a few cases without any specific pattern, low correlations were observed among tortuosity measures, which may imply each tortuosity measure appraises different features of vessel tortuosity.
5. Discussion
This paper analyzes the statistical properties of vessel attributes within different portions of the healthy intracerebral circulation. We conclude that attribute distributions are Gaussian when parameters are represented as a summary value for each vessel group, and that attribute values are likely to vary by anatomical location. Several points should be made about the methods, however.
First, there are almost an infinite number of attributes that can be defined from sets of segmented vessels. The current report evaluates only a few of these measures. The fact that the particular parameters analyzed here demonstrate Gaussian distributions does not guarantee that another, arbitrarily selected attribute will also do so. Nevertheless, our results are encouraging, and the described use of summary values provides a useful means of handling at least some types of parameters whose distributions appear non-Gaussian when viewed on a vessel-by-vessel basis. We believe some form of a central limit theorem induced the Gaussian distributions due to including roughly 40–50 vessels per summary measure. An additional advantage lies in the much greater reliability of such summaries, when compared to reliabilities of measures of individual vessels.
Second, this report employs vessel trees as the means of defining vessel groups. This kind of grouping may provide the optimal method of analyzing some diseases such as stroke, Pick’s disease, and others. However, for other disease processes, different vascular groupings may be more appropriate. The current report does not pretend to provide a set of values that can subsequently be used as the definition of health against which to compare the vascular attributes of all future patients with all types of diseases. Instead, the goal of this report is to explore the general statistical properties of vessel attributes, with the expectation that the information gained through this investigation should be applicable to a variety of approaches.
Third, the specific values obtained when defining vessel attributes may depend partially upon the particular segmentation method employed. An approach limited to defining vessels two voxels or more in width will exclude small vessels and thus produce potentially different results for attributes such as average radius than does a method that includes small vessels. Similarly, a method that includes extraneous, non-vessel objects such as bone will be affected by these extraneous objects in a way difficult to predict, but likely to be dependent upon the relative numbers and shapes of the extraneous objects included.
A related fact is that vessel attribute measures may also vary based upon the differences in the level of detail provided by scans obtained at different resolutions. The SOAM measures, for example, are sensitive to the detection of high-frequency, low-amplitude “wiggles”, and volume averaging may preclude detection of such “wiggles” if the image data are comprised of large voxels. Indeed, one patient with a known malignant tumor was scanned twice at one sitting, and the high-frequency vessel “wiggles” associated with malignancy were readily apparent on a scan obtained at 0.5 x 0.5 x 0.8 mm3 but not on a scan obtained at 1.0 x 1.0 x 1.0 mm3. We have also scanned four healthy subjects at large voxel size, and statistical analysis identifies these four cases as outliers when compared to the thirteen healthy subjects included in this report. In particular, the observed distribution for SOAM2 was strongly negatively skewed (more extremely small values than extremely large values). When comparing a test subject to a healthy database, it is therefore important to employ images obtained at similar resolution.
The correlation between the related SOAM metrics but lack of correlation between any of the other tortuosity measures suggests that the various metrics each describe different features of tortuosity. Both our own group and other investigators have noted that it is difficult to provide a single measure of “tortuosity”. In particular, a metric that regards high-frequency, low-amplitude curves as of high tortuosity is likely to fail to recognize low-frequency, high-amplitude curves as of high tortuosity and vice versa, although different diseases may exhibit each abnormality either alone or in combination (Bullitt et al., 2003a,b). Under the present study, the lack of correlation between methods suggests that what is measured by the ICM and the SOAM are independent variables. It thus might be preferable to retain two or more measures of tortuosity rather than to seek a single, global metric.
We understand that conclusions based upon a study of only 13 participants must be limited. Nevertheless, and despite the small sample size, most of the primary statistical tests achieved significance. These results provide the basis for conducting power analyses to help plan future research. The data reported here can be used as input to estimate the variability (more precisely, the error covariance matrix) for any future study, allowing one to plot the power as a function of mean differences and sample size under the assumption that all data are Gaussian. Important future questions include the effects of aging, gender and ethnicity, but such analysis will require a larger study population.
In summary, this paper explores the statistical distribution of vessel attributes within different populations of intracranial vessels of healthy subjects. We conclude that, for the particular set of attributes investigated, the distributions are Gaussian when attributes are represented as summary values for each vessel group. As a result, linear statistical models can be used to search for differences between vessel populations. We also conclude that the expected values of vessel attributes in even healthy subjects are likely to vary according to anatomical location. These findings are of importance to any study that aims to compare a test subject or a patient with known disease to a database of healthy patients.
Acknowledgments
This work was supported by R01 EB000219 NIH-NIBIB and R01 HL69808 NIH-HLB.
References
- Aylward SR, Bullitt E. Initialization, noise, singularities and scale in height ridge traversal for tubular object centerline extraction. IEEE-TMI. 2002;21:61–75. doi: 10.1109/42.993126. [DOI] [PubMed] [Google Scholar]
- Baish JS, Jain RK. Fractals and cancer. Cancer Research. 2000;60:3683–3688. [PubMed] [Google Scholar]
- Bracher D. Changes in peripapillary tortuosity of the central retinal arteries in newborns. Graefe’s Arch Clin Exp Opthalmol. 1982;218:211–217. doi: 10.1007/BF02150097. [DOI] [PubMed] [Google Scholar]
- Brey D, King TW, Johnston C, McIntire LV, Reece GP, Patrick CW. A technique for three-dimensional analysis of microvascular structure. Microvascular Research. 2002;63:279–294. doi: 10.1006/mvre.2002.2395. [DOI] [PubMed] [Google Scholar]
- Bullitt E, Aylward S, Smith K, Mukherji S, Jiroutek M, Muller K. Symbolic Description of Intracerebral Vessels Segmented from MRA and Evaluation by Comparison with X-Ray Angiograms. Medical Image Analysis. 2001;5:157–169. doi: 10.1016/s1361-8415(01)00037-8. [DOI] [PubMed] [Google Scholar]
- Bullitt E, Gerig G, Pizer S, Aylward SR. Measuring tortuosity of the intracerebral vasculature from MRA images. IEEE-TMI. 2003a;22:1163–1171. doi: 10.1109/TMI.2003.816964. [DOI] [PMC free article] [PubMed] [Google Scholar]
- Bullitt E, Gerig G, Aylward S, Joshi S, Smith JK, Ewend M, Lin W. Vascular attributes and malignant brain tumors. MICCAI 2003; Lecture Notes in Computer Science. 2003b;2878:671–679. [Google Scholar]
- Bullitt E, Jung I, Muller K, Gerig G, Aylward S, Joshi S, Smith K, Ewend M. Determining malignancy of brain tumors by analysis of vessel shape. MICCAI (Lecture Notes in Computer Science) 2004. 2004 In press. [Google Scholar]
- Burger PC, Scheithauer BW, Vogel FS. Surgical Pathology of the Nervous System and its Coverings. 3. Churchill Livingstone; New York: 1991. [Google Scholar]
- Chung ACS, Noble JA. Statistical 3D vessel segmentation using a Rician distribution. MICCAI 1999 Lect Notes Comp Sci. 1999;1679:82–89. [Google Scholar]
- De Bruijne M, van Ginneken B, Niessen WJ, Maintz JBA, Viergever M. Active shape model based segmentation of abdominal aortic aneurysms in CTA images. SPIE. 2002;4684:463–474. [Google Scholar]
- Feldmar J, Malandain G, Ayache N, Fernandez-Vidal S, Maurincomme E, Trousset Y. Matching 3D MR angiography data and 2D X-ray angiograms. CVRMed-MRCAS 1997, Lect Notes Comp Sci. 1997;1205:129–138. [Google Scholar]
- Ferguson EA, Eccles R. Changes in nasal nitric oxide concentration associated with symptoms of common cold and treatment with a topical nasal decongestant. Acta Otolaryngol (Stockh) 1997;117:614–617. doi: 10.3109/00016489709113447. [DOI] [PubMed] [Google Scholar]
- Folkman J. Incipient Angiogenesis. Journal of the National Cancer Institute. 2000;92:94–95. doi: 10.1093/jnci/92.2.94. [DOI] [PubMed] [Google Scholar]
- Frangi AF, Niessen WJ, Hoogeveen RM, Walsum TV, Viergever MA. Quantification of vessel morphology from 3D MRA. MICCAI ’99 Lecture Notes in Computer Science. 1999a;1679:358–367. [Google Scholar]
- Frangi AF, Niessen WJ, Hoogeveen RM, Van Walsum T, Viergever MA. Model-based quantitation of 3d magnetic resonance angiographic images. IEEE-TMI. 1999b;18:946–956. doi: 10.1109/42.811279. [DOI] [PubMed] [Google Scholar]
- Gerig G, Koller T, Szekely G, Brechbuhler C, Kubler O. Symbolic description of 3-D structures applied to cerebral vessel tree obtained from MR angiography volume data. IPMI 1993, Lect Notes Comp Sci. 1993;687:94–111. [Google Scholar]
- Goldbaum MH, Hart WE, Cote BL, Raphaelian PV. Automated measures of retinal blood vessel tortuosity. Invest Opthalmol Vis Sci. 1994;35:2089. [Google Scholar]
- Hart WE, Goldbaum M, Cote B, Kube P, Nelson MR. Measurement and Classification of Retinal Vascular Tortuosity. Intl J Medical Informatics. 1999;53:239–252. doi: 10.1016/s1386-5056(98)00163-4. [DOI] [PubMed] [Google Scholar]
- Helmlinger G, Sckell A, Dellian M, Forbes NS, Jain RK. Acid production in glycolysis-impaired tumors provides new insights into tumor metabolism. Clinical Cancer Research. 2002;8:1284–1291. [PubMed] [Google Scholar]
- Hiroki M, Miyashita K, Oda M. Tortuosity of the White Matter Medullary Arterioles Is Related to the Severity of Hypertension. Cerebrovascular Diseases. 2002;13:242–250. doi: 10.1159/000057850. [DOI] [PubMed] [Google Scholar]
- Jain RK. Normalizing tumor vasculature with anti-angiogenic therapy: a new paradigm for combination therapy. Nature Medicine. 2001;7:987–98. doi: 10.1038/nm0901-987. [DOI] [PubMed] [Google Scholar]
- Kistner EO, Muller KE. Exact distributions of intraclass correlation and Cronbach’s alpha and Gaussian data and general covariance. Psychometrika. 2004 doi: 10.1007/BF02295646. in press. [DOI] [PMC free article] [PubMed] [Google Scholar]
- Krissian K. Flux-based anisotropic diffusion : Application to enhancement of 3D angiogram. IEEE-TMI. 2002;21:1440–1442. doi: 10.1109/TMI.2002.806403. [DOI] [PubMed] [Google Scholar]
- Lau DH, Xue L, Young LJ, Burke PA, Cheung AT. Paclitaxel (Taxol): an inhibitor of angiogenesis in a highly vascularized transgenic breast cancer. Cancer Biother Radiopharm. 1999;14:31–6. doi: 10.1089/cbr.1999.14.31. [DOI] [PubMed] [Google Scholar]
- Lei T, Udupa JK, Saha PK, Odhner D. Artery-vein separation via MRA—An image processing approach. IEEE-TMI. 2001;20:689–703. doi: 10.1109/42.938238. [DOI] [PubMed] [Google Scholar]
- Lorenz C, Carlsen IC, Buzug TM, Fassnacht C, Weese J. Multi-scale line segmentation with automatic estimation of width, contrast and tangential direction in 2D and 3D medical images. CVRMed-MRCAS ’97, LNCS. 1997;1205:233–242. [Google Scholar]
- Lorigo LM, Faugeras OD, Grimson WEL, Keriven R, Kikinis R, Nabavi A, Westin CF. CURVES: Curve evolution for vessel segmentation. Medical Image Analysis. 2001;5:195–206. doi: 10.1016/s1361-8415(01)00040-8. [DOI] [PubMed] [Google Scholar]
- Masutani Y, Kurihara T, Suzuki M, Dohi T. Quantitative vascular shape analysis for 3D MR-angiography using mathematical morphology. In: Ayache N, editor. Computer Vision, Virtual Reality and Robotics in Medicine. Springer Verlag; New York: 1995. pp. 449–454. [Google Scholar]
- McDonald DM. Angiogenesis and remodeling of airway vasculature in chronic inflammation. Am J Respir Crit Care Med. 2001;164(10 Pt 2):S39–45. doi: 10.1164/ajrccm.164.supplement_2.2106065. [DOI] [PubMed] [Google Scholar]
- Muller KE, Fetterman BA. Regression and ANOVA: An Integrated Approach Using SAS® Software. SAS Institute Inc; Cary, NC: 2002. [Google Scholar]
- Niessen W, van Swigndregt AM, Elsman B, Wink O, Viergever M, Mali W. Enhanced artery visualization in blood Pool MRA: results in the peripheral vasculature. IPMI 1999, Lect Notes Comp Sci. 1999;1613:340–345. [Google Scholar]
- SAS Procedures Guide. Cary, NC: SAS Institute Inc; 1999. pp. 1317–1454. [Google Scholar]
- Sabo E, Boltenko A, Sova Y, Stein A, Kleinhaus S, Resnick MB. Microscopic analysis and significance of vascular architectural complexity in renal cell carcinoma. Clinical Cancer Research. 2001;7:553–537. [PubMed] [Google Scholar]
- Sato Y, Nakajima S, Shiraga N, Atsumi H, Yoshida S, Koller T, Gerig G, Kikinis R. Three-dimensional multi-scale line filter for segmentation and visualization of curvilinear structures in medical images. Medical Image Analysis. 1998;2:143–168. doi: 10.1016/s1361-8415(98)80009-1. [DOI] [PubMed] [Google Scholar]
- Siemann D. Vascular Targeting Agents. Horizons in Cancer Therapeutics. 2002;3:4–15. [Google Scholar]
- Smedby O, Hogman N, Nilsson S, Erikson U, Olsson AG, Walldius G. Two-dimensional tortuosity of the superficial femoral artery in early atherosclerosis. J Vascular Research. 1993;30:181–191. doi: 10.1159/000158993. [DOI] [PubMed] [Google Scholar]
- Spangler KM, Chandra VR, Moody DM. Arteriolar tortuosity of the white matter in aging and hypertension. A microradiographic study. J Neuropathol Exp Neurol. 1994;53:22–26. doi: 10.1097/00005072-199401000-00003. [DOI] [PubMed] [Google Scholar]
- Tek H, Kimia BB. Volumetric segmentation of medical images by three-dimensional bubbles. Proceedings of the IEEE Workshop on Physics-based Modeling in Computer Vision (PBMCV) 1995:9–16. [Google Scholar]
- Timm NH. Applied Multivariate Analysis. Springer-Verlag; Berlin, Germany: 2002. [Google Scholar]
- Wilson DL, Noble JA. An adaptive segmentation algorithm for time-of-flight MRA data. IEEE-TMI. 1999;18:938–945. doi: 10.1109/42.811277. [DOI] [PubMed] [Google Scholar]
- Zhou LA, Rzeszotarski MS, Singerman LJ, Chokreff JM. The detection and quantification of retinopathy using digital angiograms. IEEE-TMI. 1994;13:619–626. doi: 10.1109/42.363106. [DOI] [PubMed] [Google Scholar]