

Abstract
A publicly available database of high-quality, multi-modal MR brain images of carefully screened healthy subjects, equally divided by sex, and with an equal number of subjects per age decade, would be of high value to investigators interested in the statistical study of disease. This report describes initial use of an accumulating healthy database currently comprising 50 subjects aged 20–72. We examine changes by age and sex to the volumes of gray matter, white matter and cerebrospinal fluid for subjects within the database. We conclude that traditional views of healthy aging should be revised. Significant atrophy does not appear in healthy subjects 60 or 70 years old. Gray matter loss is not restricted to senility, but begins in early adulthood and is progressive. The percentage of white matter increases with age. A carefully-designed healthy database should be useful in the statistical analysis of many age- and non-age- related diseases.
1. Introduction
Any automated, computerized assessment of disease requires establishment of healthy norms against which a test subject can be compared. However, healthy aging induces brain changes [1], [2]. In young, healthy adults [3] and in nondemented older persons [4], analyses demonstrate that the aging process is a continuum with changes evident before senescence. An accurate assessment of disease by magnetic resonance imaging (MR) thus requires an image database of healthy subjects appropriately age and sex matched to the potentially diseased subject in question.
The public establishment of such a healthy database would be of value to the scientific community. We are collecting high-resolution, 3T MR images of 100 healthy subjects aged 20–60+, with 20 subjects per decade divided equally by sex. All subjects are screened for the presence of brain disease. Images include T1, T2, MRA, and diffusion tensor. Images will be made publicly available once collection is complete.
The current report describes the first use of this database at the 50% completion point (50 subjects equally divided by sex, with 5 men and 5 women included in each of five age decades). This first report does not analyze disease, but rather examines differences by age and sex within the healthy database itself. More specifically, we describe automated volumetric analysis of the three brain compartments comprising gray matter (GM), white matter (WM) and cerebrospinal fluid (CSF). We also examine lateral ventricular volume as a percentage of total CSF volume.
Several papers have evaluated changes in ventricular volume with healthy aging [1], [5], [6], [7], [8], changes in GM-WM-CSF volumes with healthy aging [3], [4], [9], [10], [11]. These papers, however, examine different age group ranges, include variable male-female sex ratios, have not always screened healthy subjects carefully and have almost always employed low resolution MR images with large interslice spacing.
This study is based upon the assumption that careful design of a healthy subject database can provide better assessment of differences between patient populations. Consistent with previous studies, our results show significant differences between the intracranial volumes of males and females and a significant loss of GM with normal aging. However, in contrast to previous work, our results show relatively little brain atrophy in healthy subjects over 60, a continual gradation in loss of GM that begins in early adulthood, and an apparent relative increase in WM that approximately parallels the loss of GM, raising new issues about the change of imaging characteristics of GM and WM over time. Moreover, total CSF volume remains relatively constant, which has not been reported before. These results underscore the importance of healthy subject selection, the use of high quality images and the employment of standardized methods when attempting to establish group differences.
2. Clinical Material and Methods
2.1. Patient population and MR acquisition
The IRB-approved study included 50 volunteers (25 male, 25 female). Ten subjects, equally divided by sex, were imaged by decade (20–29, 30–39, 40–49, 50–59, and 60–72). Subjects with diabetes, hypertension, psychiatric disease, or history of brain disease were excluded. All subjects consented to make their images available via the web.
Images were obtained upon a head-only 3T MR unit (Allegra, Siemens Medical Systems Inc., Germany). A head coil was employed. T1 and T2 sequences, as well as additional image sequences, were obtained to cover the entire head. Voxel spacing was 1 x 1 x 1 mm for both T1 and T2 studies. For T1 images, acquisition parameters included TR=15, TE=7.1, fov=176x256 with a 0 gap, a matrix of 192x256, and a flip angle of 25. For T2 images, acquisition parameters included TR=7730, TE=80, fov=192x256 with a 0 gap, a matrix of 256 x 256, and a flip angle of 180.
2.2. Tissue segmentation
The three brain compartments were defined using an expectation-maximization (EM) segmentation scheme that separated WM, GM, and CSF using both T1 and T2 images. A spatial probabilistic brain atlas [12] that represents expert prior knowledge about brain structures guided the segmentation. The registered atlas together with the set of prior probabilities for tissue were passed along with the T1 and T2 images as inputs to the segmentation algorithm. The segmentation algorithm used was based on the EM segmentation algorithm developed by van Leemput et al [13], [14] and rewritten as an integrated package in ITK (Insight Toolkit). The automatic tool includes inter-modality registration, atlas registration, bias field inhomogeneity correction, and calculation of binary and probabilistic segmentation maps for CSF, GM and WM.
The lateral ventricular CSF was segmented using 3D snakes with region competition priors [15]. The snake was initialized near the ventricles and evolved based on the probability map for CSF, provided as input to the program. The GM, WM, total CSF and lateral ventricular volumes were calculated by integration over class-specific regions. Figure 1 illustrates results on an axial slice of one subject.
Figure 1.
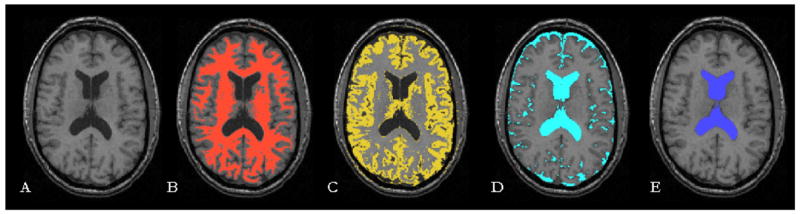
Segmentation results. (A) Original T1 axial image (B) White Matter (C) Gray Matter (D) Total CSF (E) Ventricular CFS
2.3. Statistical Analysis
Subjects were divided into five age groups named Agegroups 1–5, representing respectively the age ranges 20–29, 30–39, 40–49, 50–59 and 60–72. Absolute volumes were calculated for each of three compartments (WM, GM, and total CSF) as well as for the lateral ventricles. The total intracranial volume was viewed as the sum of WM+GM+CSF. Results were analyzed by age and sex not only for absolute volumes, but also for percentage of total volume occupied by each compartment. The percentage of the total CSF volume within the lateral ventricles was also examined.
Logarithmic transformations were applied to each percentage measurement and the normality of the transformed variables was tested by using the Shapiro-Wilks test and the Kolmogrov-Smirnov test. The total volume and the total CSF volume were similarly tested for the presence of normal distributions. A generalized linear model was used to fit the data. In the model, the total volume, the CSF volume and the percentages of the three components were treated as repeated measurements in the same subject so their correlations were accounted for in the analysis. The list of independent variables included the factor of age group (5 levels), the factor of gender group (2 levels) and their interactions.
Multivariable ANOVA test showed no significant interactions between age group and sex (p=0.88). Consequently, the final model only contained the main effects from age group and sex. The Tukey test was used to compare each measurement among the five age and two gender groups, after accounting for dependence among all the outcomes. Finally, the residue analysis post-model fitting showed that the model fits data well and that the model assumptions are thus presumably valid in this analysis.
3. Results
Results are presented in Tables 1 and 2 and illustrated in Figure 2. Table 1 shows the average total intracranial volume to be significantly smaller (p<0.001) in females (1341±100 cm3) than in males (1519±106 cm3). Not surprisingly in this study of adult subjects, there is no significant difference in total intracranial volume by age (p=0.31).
Figure 2.
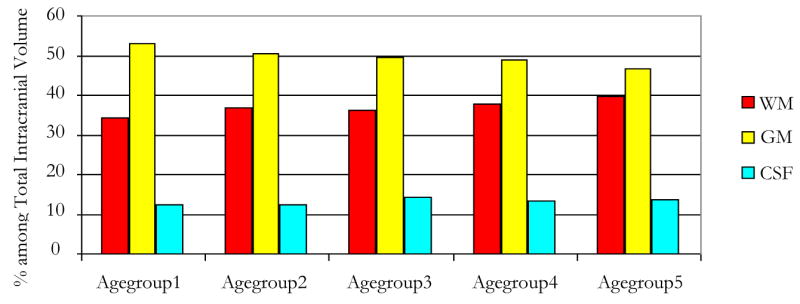
Tissues volumes evolution with healthy aging for overall groups
Table 1.
Average values of total intracranial, WM and GM volumes in normal adults Agegroups 1–5 represent ages 20–29-…-60+ respectively, SD = Standard Deviation, % is the percentage among Total Intracranial Volume
| Sex and Age Group | Total Intracranial Volume (cm3±SD) | WM (cm3±SD) | WM (%±SD) | GM (cm3±SD) | GM (%±SD) |
|---|---|---|---|---|---|
| Both sex | 1430±136 | 530±83 | 36.98±3.32 | 710±68 | 49.75±2.97 |
| Agegroup1 | 1474±121 | 508±56 | 34.38±1.46 | 782±50 | 53.13±1.67 |
| Agegroup2 | 1386 ±92 | 513 ±67 | 36.97±4.05 | 699±52 | 50.52±2.80 |
| Agegroup3 | 1426 ±161 | 517 ±80 | 36.11±1.95 | 705±68 | 49.58±1.73 |
| Agegroup4 | 1407 ±116 | 532 ±63 | 37.78±2.88 | 689±70 | 48.94±1.70 |
| Agegroup5 | 1457 ±180 | 583±124 | 39.66±3.49 | 675±53 | 46.57±2.45 |
|
| |||||
| All Females | 1341±100 | 488±65 | 36.28±3.31 | 672±59 | 50.12±3.04 |
| Agegroup1 | 1387±77 | 472±50 | 33.94±1.72 | 751±39 | 54.15±1.52 |
| Agegroup2 | 1326±88 | 498±79 | 37.51±5.20 | 665±48 | 50.26±3.43 |
| Agegroup3 | 1310±120 | 461±67 | 35.04±2.03 | 650±45 | 49.77±2.08 |
| Agegroup4 | 1326±82 | 496±63 | 37.37±3.70 | 644±47 | 48.59±1.97 |
| Agegroup5 | 1358±144 | 512±78 | 37.54±1.92 | 648±54 | 47.83±1.83 |
|
| |||||
| All Males | 1519±106 | 573±77 | 37.68±3.24 | 749±54 | 49.37±2.90 |
| Agegroup1 | 1562±88 | 544±35 | 34.82±1.16 | 813±41 | 52.12±1.17 |
| Agegroup2 | 1445±48 | 527±58 | 36.43±3.02 | 733±29 | 50.79±2.40 |
| Agegroup3 | 1542±99 | 573±43 | 37.18±1.23 | 760±26 | 49.38±1.53 |
| Agegroup4 | 1488±86 | 568±42 | 38.19±2.15 | 734±61 | 49.28±1.53 |
| Agegroup5 | 1556±167 | 654±126 | 41.78±3.53 | 702±39 | 45.31±2.50 |
In terms of the ratio of WM to total intracranial volume, there is no significant difference between males and females (p=0.07). However, significant differences were observed among the five age groups (p=0.002). In particular, there appears to be a significant trend towards WM increase with age beginning at approximately age 50. Agegroup1 displays a smaller percentage of WM than Agegroups 4 and 5 (p=0.05 and 0.001), with Agegroups 2 and 3 displaying results similar to those of the younger group. On the average, the WM percentage for those aged 20–29 was 9.7% smaller than those 50–59, and 15% smaller than those 60 and above. 1
Males and females appear to have the same ratio of GM to total volume (p=0.23). However, GM volume tends to decrease with age (p<0.001). Agegroup1 has a consistently larger percentage of GM than their elders (p=0.007 for Agegroup3, <0.001 for Agegroups 4 and 5). Those aged 30–39 have a significantly larger percentage of GM than those 60 and above (p=0.001). On average, the percentage of GM in those 20–29 is about 7.2% larger than those 40–49, about 8.6% larger than those 50–59 and about 14.2% larger than those 60 and above. The percentage of GM in people aged 30–39 is about 8.5% larger than in people 60 and over.
On the basis of literature studies, we anticipated a significant increase in CSF volume with age. The differences in CSF volume by age in the current study were relatively slight, however (Table 2), and much less marked than the age-associated changes to GM and WM. For total CSF volume, there was no significant difference among the five age groups (p=0.12) or between genders (p=0.07). A trend toward an increased ratio of ventricular CSF to total CSF may occur with age, but our data do not provide sufficient evidence to fully support this assertion. The only statistically significant difference between groups was between those 40–49 and those 60 and above, occurring at the p=0.04 level.
Table 2.
Average values of CSF and lateral ventricles volumes in normal adults Agegroups 1–5 represent ages 20–29-…-60+ respectively, SD = Standard Deviation, , % is the percentage among Total Intracranial Volume, %* is the percentage among CSF volume
| Sex and Age Group | CSF (cm3±SD) | CSF (%±SD) | Lateral Ventricles (cm3±SD) | Lateral Ventricles (%*±SD) |
|---|---|---|---|---|
| Both sex | 189±29 | 13.27±1.89 | 21±13 | 11.19±7.05 |
| Agegroup1 | 184±33 | 12.48±1.74 | 18±11 | 9.50±4.31 |
| Agegroup2 | 174±30 | 12.51±1.87 | 14±5 | 8.36±3.07 |
| Agegroup3 | 203±29 | 14.31±1.63 | 17±10 | 8.10±3.94 |
| Agegroup4 | 186±25 | 13.28±2.06 | 25±12 | 13.66±7.18 |
| Agegroup5 | 199±24 | 13.77±1.80 | 32±19 | 16.31±10.80 |
|
| ||||
| All Females | 182±30 | 13.60±2.15 | 17±10 | 9.42±5.21 |
| Agegroup1 | 164±22 | 11.90±1.89 | 14±7 | 8.54±3.18 |
| Agegroup2 | 163±36 | 12.23±2.24 | 13±3 | 8.41±2.47 |
| Agegroup3 | 199±20 | 15.19±1.15 | 12±7 | 5.74±3.09 |
| Agegroup4 | 186±31 | 14.04±2.33 | 22±6 | 12.10±4.46 |
| Agegroup5 | 198±25 | 14.62±1.37 | 24±17 | 12.32±8.88 |
|
| ||||
| All Males | 197±27 | 12.95±1.57 | 25±15 | 12.95±8.23 |
| Agegroup1 | 204±30 | 13.06±1.55 | 22±13 | 10.46±5.42 |
| Agegroup2 | 184±21 | 12.79±1.64 | 15±7 | 8.31±3.89 |
| Agegroup3 | 208±38 | 13.44±1.66 | 22±10 | 10.46±3.38 |
| Agegroup4 | 186±21 | 12.52±1.65 | 27±16 | 15.22±9.49 |
| Agegroup5 | 200±26 | 12.91±1.90 | 39±19 | 20.31±12.00 |
4. Discussion
Age-associated changes in the volumes of the three intracranial compartments have interested many investigators. To our knowledge, however, the current study is the first to employ high-resolution MR, standardized protocols, careful screening of healthy subjects, and age and sex-matching of subjects by decade. Although many of our results are consistent with previous reports, some are not. We believe that these differences are most likely related to differences in image quality and subject selection.
Consistent with the results of others [1], [10], our study indicates that males have a larger total intracranial volume than females and that the mean intracranial volumes of the younger and older groups are comparable. The total intracranial volume of our subjects, however, tended to be larger than reported in other adult studies [1], [10], [16]. This difference could be attributable either to the fact that our studies covered the entire brain, whereas other studies have not, or to the high resolution of our images, allowing more accurate volumetric measurements.
Many investigators have reported brain shrinkage with age, attributed primarily to loss of GM [2], [3], [4], [10]. To our surprise, however, our study revealed relatively little shrinkage of the total GM and WM with age. Indeed, total CSF volume remained relatively constant even for subjects in their 60s and 70s. Although the oldest subject in the current study was 72, other reports have indicated significant loss of brain tissue by this age [1], [2]. These differences are most likely related to the careful selection of healthy subjects employed in the current study, and suggest that tissue loss in these age groups may be related more to the effects of age-related diseases rather than to the aging process in isolation.
We agree with other groups that there is a loss of GM over time [2], [3], [4], [10]. Guttmann et al [2] describe a particularly nice study that examines subjects over ages, but conclude that the only significant age-related difference in GM percentage was between subjects 18–39 and those in their 50s. By contrast, our study shows a steadily progressive decline in GM percentage by decade, affecting both males and females, well-evident by middle age, and with statistically significant differences between multiple groups.
Another surprising finding was the statistically significant increase in the proportion of white matter with age. To our knowledge, this finding has not been previously reported. Intuitively, it makes sense that the GM shrinks more than the WM with age-related brain atrophy. GM shrinkage is presumably due to loss of neurons. Some of these neurons have axons that project into the WM and one would expect that losing these neurons would result in a corresponding loss of WM. However, there are also neurons in the cortex that have axons that stay within the cortex or only extend centripetally as far as the subcortical U fibers. Thus, if these neurons are lost, GM shrinkage would occur without corresponding shrinkage of the WM. This explanation is consistent with our finding of relative increases on WM with age. Another interesting possibility is that age produces changes to MR imaging characteristics so that GM becomes “less gray” as seen by MR and so becomes mistakenly classified as WM. This is a potential area of future research.
The ratio of ventricular volume to total CSF volume is of particular interest to the study of diseases such as normal pressure hydrocephalus. We were unable to find another age and sex matched study of healthy controls with which to compare our results. Our results suggest that there may be slight increase in both absolute ventricular volume and in ventricular/total_CSF ratio in our oldest age group (60+), but these results were statistically significant only when compared to the 40–49 years old group and even there did not reach a high level of significance. These results are in general agreement with those of Matsumae et al. [1], who studied ventricular volume with age. Our results may establish a basis upon which to study diseases such as normal pressure hydrocephalus at a later date.
5. Conclusion
Considered together, these results lead to the suggestion that the traditional view of age-related changes to intracranial compartments should be revised. Significant atrophy does not appear to occur in genuinely healthy subjects even into the late 60s and early 70s. Loss of GM with aging appears to be a steadily progressive process that begins relatively early in adulthood, and that may be associated with a relative increase in the proportion of WM.
This study raises several questions, however. First, the current study does not address the location of GM loss (cortex? basal ganglia? thalamus?), which could be an important area of research helpful in differentiating between healthy aging and pathology. Second, there is a real question of age-related changes in the MR imaging characteristics of GM and WM. Such changes in imaging characteristics could affect results, and could provide an important area of research.
The major contribution of this study, however, is in the initiation of a high-quality, multi-modality image database of carefully screened healthy subjects, evenly divided by sex, and with an equal number of subjects per decade. This database could serve as an important resource to all investigators interested not only in normal aging but also in the statistical study of disease.
Acknowledgments
This work was supported by the grant RO1 EB000219 NIH-NIBIB.
Footnotes
Percentages are calculated as predicted difference of WM percentages over WM percentage of compared group
References
- 1.Matsumae M, Kikinis R, Mórocz I, Lorenzo A, Sándor T, Albert MS, McL Black P, Jolesz F. Age related changes in intracranial compartment volumes in normal adults assessed by MRI. J Neurosurg. 1996;84(6):982–91. doi: 10.3171/jns.1996.84.6.0982. [DOI] [PubMed] [Google Scholar]
- 2.Guttmann CR, Jolesz FA, Kikinis R, Killiany RJ, Moss MB, Sandor T, Albert MS. White matter changes with normal aging. Neurology. 1998;50(4):972–8. doi: 10.1212/wnl.50.4.972. [DOI] [PubMed] [Google Scholar]
- 3.Gur RC, Gunning-Dixon FM, Turetsky BI, Bilker WB, Gur RE. Brain Region and Sex Differences in Age Association With Brain Volume: A quantitative MRI Study of Healthy Young Adults. Am J Geriatr Psychiatry. 2002;10:72–80. [PubMed] [Google Scholar]
- 4.Resnick SM, Goldszal AF, Davatzikos C, Golski S, Kraut MA, Metter EJ, Bryan RN, Zonderman AB. One-year Age Changes in MRI Brain Volumes in Older Adults. Cerebral Cortex. 2000;10(5):464–472. doi: 10.1093/cercor/10.5.464. [DOI] [PubMed] [Google Scholar]
- 5.Wohl MA, Mehringer CM, Lesser IM, Boone KB, Miller BL. White matter hyperintensities in healthy older adults: A longitudinal study. International Journal of Geriatric Psychiatry. 1994;9(4):273–277. [Google Scholar]
- 6.Condon B, Patterson J, Wyper D, Hadley D, Grant R, Teasdale G, Rowan J. Use of magnetic resonance imaging to measure intracranial cerebrospinal fluid volume. Lancet. 1986;1(8494):1355–7. doi: 10.1016/s0140-6736(86)91666-1. [DOI] [PubMed] [Google Scholar]
- 7.Haug G. Age and sex dependence of the size of normal ventricles on computed tomography. Neuroradiology. 1977;14(4):201–4. doi: 10.1007/BF00496984. [DOI] [PubMed] [Google Scholar]
- 8.Barron SA, Jacobs L, Kinkel WR. Changes in size of normal lateral ventricles during aging determined by computerized tomography. Neurology. 1976;26:1011–1013. doi: 10.1212/wnl.26.11.1011. [DOI] [PubMed] [Google Scholar]
- 9.Malko JA, Hoffman JC, Jr, Green RC. MR measurement of intracranial CSF volume in 41 elderly normal volunteers. AJNR Am J Neuroradiol. 1991;12(2):371–4. [PMC free article] [PubMed] [Google Scholar]
- 10.Matsumae M, Kikinis R, Mórocz IA, Lorenzo AV, Albert MS, McL Black P, Jolesz FA. Intracranial compartment volumes in patients with enlarged ventricles assessed by MRI based image processing. J Neurosurg. 1996;84(6):972–81. doi: 10.3171/jns.1996.84.6.0972. [DOI] [PubMed] [Google Scholar]
- 11.Resnick SM, Pham DL, Kraut MA, Zonderman AB, Davatzikos C. Longitudinal magnetic resonance imaging studies of older adults: a shrinking brain. J Neurosci. 2003;23(8):3295–301. doi: 10.1523/JNEUROSCI.23-08-03295.2003. [DOI] [PMC free article] [PubMed] [Google Scholar]
- 12.Evans AC, Collins DL, Mills SR, Brown ED, Kelly RL, Peters TM. 3D statistical neuroanatomical models from 305 MRI volumes. Proc IEEE Nuclear Science Symposium and Medical Imaging Conference. 1993:1813–1817. [Google Scholar]
- 13.Van Leemput K, Maes F, Vandermeulen D, Suetens P. Automated model based tissue classification of MR images of the brain. IEEE Trans Med Imaging. 1999;18:897–908. doi: 10.1109/42.811270. [DOI] [PubMed] [Google Scholar]
- 14.Van Leemput K, Maes F, Vandermeulen D, Suetens P. Automated model based bias field correction of MR images of the brain. IEEE Trans Med Imaging. 1999;18:885–896. doi: 10.1109/42.811268. [DOI] [PubMed] [Google Scholar]
- 15.Ho S, Bullitt E, Gerig G. Level set evolution with region competition: Automatic 3-D segmentation of brain tumors. In: Katsuri R, Laurendeau D, Suen C, editors. Proc 16th International Conference on Pattern Recognition. IEEE Computer Society; 2002. pp. 532–535. [Google Scholar]
- 16.Reiss AL, Eliez S, Schmitt JE, Straus E, Lai Z, Jones W, Bellugi U. Neuroanatomy of Williams syndrome: a high-resolution MRI study. J Cogn Neurosci. 2000;12(Suppl 1):65–73. doi: 10.1162/089892900561986. [DOI] [PubMed] [Google Scholar]