
Figure 10.
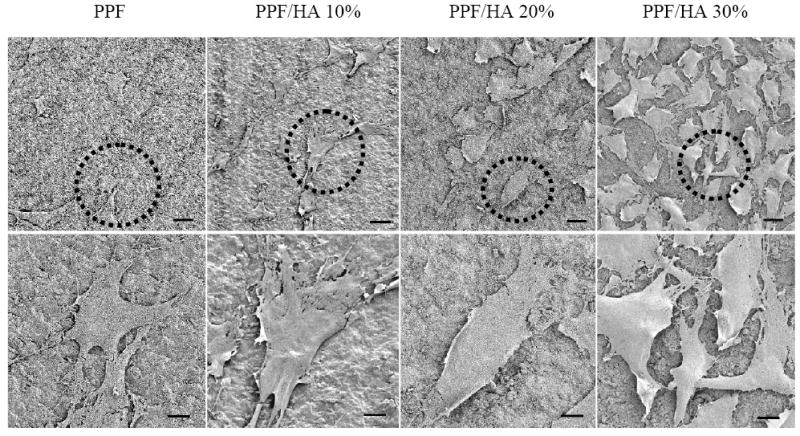
Scanning electron micrographs of MC3T3 cells after 24 h seeding on crosslinked PPF and PPF/HA disks with different HA contents. Bottom images were magnified from the dotted areas of the top images. Scale bars represent 300 μm (top) and 10 μm (bottom).