

Abstract
The effects of dietary manipulation of folate and methionine were determined on plasma homocysteine and HDL-cholesterol levels in wild type and apoE-deficient mice. A low folate diet was supplemented with or without folate and/or methionine in the drinking water and administered for 7 weeks. Fasted homocysteine rose to ~23 μM on the low folate/high methionine diet, but high folate ameliorated the effect of the high methionine on fasted plasma homocysteine to ~10 μM. Determination of non-fasted plasma homocysteine levels at 6 hour intervals revealed a large diurnal variation in homocysteine consistent with a nocturnal lifestyle. The daily average of the non-fasted homocysteine levels were higher than the fasted values for the high methionine diets, but lower than the fasted values for the low methionine diets. An acute methionine load by gavage of the fasted mice increased plasma homocysteine 2.5 hours later, but the mice that had been on the high methionine diets had a lower fold induction. Mice fed high methionine diets weighed less than mice fed low methionine diets. Based on these results, two solid food diets were developed one containing 2% added methionine and the other 2% added glycine. The methionine diet led to fasted plasma homocysteine levels >60 μM, higher than with methionine supplementation in drinking water. Mice on methionine diets had >20% decreased body weights, and also decreased HDL-cholesterol levels. An HDL turnover study demonstrated that the HDL-cholesterol production rate was significantly reduced in the mice fed the methionine diet.
Keywords: homocysteine, HDL turnover, folate
Introduction
Homocysteine (Hcy)2 is a metabolite of methionine, specifically the methyl donor S-adenosylmethionine, and a precursor for cysteine biosynthesis [1]. A 1995 meta-analysis of 27 primarily case-control studies concluded that a 5 μM increment in plasma total Hcy (tHcy) increases the odds ratio for coronary artery disease (CAD) to 1.6 and 1.8 for men and women, respectively [2]. A more recent meta-analysis found a more modest effect such that subjects with a 25% lower tHcy level have an 11% decreased risk for ischemic heart disease [3]. This meta-analysis also found that retrospective studies have larger odds ratios than prospective studies, indicating that elevated tHcy could be a result of, rather of than a cause of, cardiovascular disease [3]. Normal levels of plasma tHcy in humans are 7 to 14 μM; and, hyperhomocysteinemia, due to genetic causes or vitamin deficiency, is defined as tHcy > 15 μM. The most common genetic cause of hyperhomocysteinemia is a polymorphism in methylenetetrahydrofolate reductase (MTHFR) gene, which yields a thermolabile enzyme [4]. The frequency of homozygotes for this allele is about 12% in the white population, and homozygosity for this allele is associated with increased tHcy. A recent meta-analysis of 40 studies found that homozygotes had a 16% increased odds ratio for cardiovascular disease; however, this increased odds ratio was not observed in locations with high folate diets [5]. This is explainable by a large gene-diet interaction, as increased tHcy is observed only in the homozygotes for the thermolabile MTHFR allele who have low plasma folate levels [6]. It is well known, and used as the basis of a clinical measurement, that tHcy levels rise acutely after an oral methionine load; although, there are mixed results about the chronic effects of dietary methionine and/or protein on plasma tHcy in humans [7–10].
In numerous mouse studies, high methionine and/or vitamin deficient diets have been used to raise tHcy levels and look for effects on atherosclerosis, thrombosis, and vascular reactivity. It had also been shown that different strains of mice respond with different levels of plasma tHcy 2.5 hours after an acute oral methionine load [11]. There are also previous indications that altered Hcy metabolism can have an effect on HDL levels. Cystathionine β-synthase deficient mice with highly elevated tHcy levels have decreased plasma HDL-cholesterol (HDL-C) levels [12, 13]. Mice hemizygous for MTHFR deficiency have a mild elevation of tHcy levels and decreased levels of plasma apoAI, the major HDL apolipoprotein [14]. A high methionine diet yielding a moderate increase in plasma tHcy, but not a high methionine/low folate diet yielding a robust increase in plasma tHcy, was reported to lower total plasma cholesterol in wild type C57BL/6 mice [15].
In the current mouse study, we examined the effects of chronic methionine feeding on many parameters including body weight, blood counts, plasma cholesterol, and HDL-C levels. We also measured tHcy levels in fasted and non-fasted mice, at various times during the day, and after an acute methionine load. We found that chronic feeding of a high methionine diet led to a significant decrease in plasma HDL-C, and in an HDL turnover study, this decrease is associated with a decreased HDL-C production rate.
Methods and Materials
Mice and Diets
ApoE-deficient and wild type mice, both on the C57BL/6 background, were purchased from Jackson Laboratory, Bar Harbor, ME. Male mice were used exclusively throughout this study. In addition to a normal chow diet (PicoLab rodent chow 20–5053), the following specifically designed synthetic diets were used (all from Harlan Teklad): 1) TD 97095, a low folate, low methionine diet containing 6% fat and 19.5% casein (w:w); 2)TD 98400, the “Gly” diet containing 6% fat, 19.5% casein, 2mg/kg folate, and supplemented with 2% glycine; and 3) TD 98399, the “Met” diet, identical to the Gly diet, only 2% methionine replaces the 2% glycine. The exact formulations for these diets are shown in Table 1. The actual levels of folate and methionine in all diets were chemically determined by Covance (Madison, WI). In some studies, methionine and folate were supplemented in the drinking water in different concentrations and changed weekly. A 25 g male C57BL/6 mouse is reported to eat 2.62 g of food and drink 2.86 g of water daily (Jackson Labs Mouse Phenome Database http://phenome.jax.org/pub-cgi/phenome/mpdcgi?rtn=docs/home). We used these values in order to estimate the daily intake of folate and methionine in mice on the various diets. In order to obtain the fasted plasma samples, food was removed and methionine and/or folate containing water were exchanged for normal water on the evening before the sacrifice. In the morning the animals were bled from the retroorbital plexus, under Metofane anesthesia. Acute methionine loading was achieved by oral gavage of methionine solution to deliver 320 mg methionine per kg body weight. Two and a half hours later the mice were anesthetized with Avertin, and the blood was removed from the left ventricle during sacrifice by exsanguination. This blood was used to determine the post methionine loaded plasma Hcy and for the other lipid and hematological parameters
Table 1.
Synthetic diet compositions.
| Folate Deficient TD 97095# g/kg | GLY TD 98400# g/kg | MET TD 98399# g/kg | |
|---|---|---|---|
| Casein (vitamin-free) | 195 | 195 | 195 |
| Methionine | 20 | ||
| Glycine | 20 | ||
| Sucrose | 345 | 325 | 325 |
| Corn starch | 306 | 301 | 301 |
| Soybean oil | 60 | 60 | 60 |
| Cellulose | 50 | 50 | 50 |
| Mineral Mix (TD 94046) | 35 | 35 | 35 |
| Calcium phosphate | 4 | 4 | 4 |
| Ethoxyquin | 0.012 | 0.012 | 0.012 |
| Vitamin mix (TD 40060) | 10 | 10 | |
| Ascorbic acid | 1.02 | ||
| Vit. B12 | 0.03 | ||
| Biotin | 0.0005 | ||
| Calcium Pantothenate | 0.066 | ||
| Choline citrate | 3.5 | ||
| Inositol | 0.11 | ||
| Menadione | 0.05 | ||
| Niacin | 0.1 | ||
| Pyridoxine HCl | 0.022 | ||
| Riboflavin | 0.022 | ||
| Thiamine HCl | 0.022 | ||
| Vitamin A palmitate | 0.04 | ||
| Vitamine D3 | 0.0044 | ||
| Vitamin E acetate | 0.242 | ||
| Measured folate content (mg/kg)* | 0.065 | 2 | 2 |
| Measured methionine content* | 4.3 | 4.3 | 24.3 |
, Harlan Teklad catalog number.
For comparison, the Picolab 20–5053 rodent chow was measured to contain 2.5 mg/kg folate and 4.2 g/kg methionine
Hcy assay
Total plasma Hcy was measured using an enzymatic assay that was adopted from prior studies [16–18]. 20 μl aliquots of plasma or standards were reduced by dilution with 44 μl K3PO4 (0.1 M, pH 7.4), 10 μl dithioerythritol (DTE, 0.2 M) and 1 μl Pentostatin (2′deoxycoformycin, Pfizer, Ann Arbor, MI, 0.1 M). The mixture was boiled for 10 min and centrifuged. The supernatant was decanted and cooled on ice water. The following were added to 45 μl of the reduced sample; 23 μl K3PO4 (0.1 M pH 7.4), 1 μl 2′deoxycoformycin (0.1 M), 1 μl [8-14C]adenosine (1 mM, 52 mCi/mmol), and 10 μl S-adenosyl-L-homocysteine-hydrolase (13 mU/μl, Sigma, St. Louis, MO). The reaction was incubated for 30 min at 37°C and terminated by addition of 10 μl formic acid (2 M). 5 μl unlabeled S-adenosyl-L-homocysteine (10 mM) was added as a carrier. The samples were boiled for 10 min and centrifuged for 10 min at maximum speed in a microfuge. A 25 μl aliquot of the reaction was spotted, together with adenosine and S-adenosyl-homocysteine as markers, on cellulose chromatogram sheets (Kodak, Rochester, NY), dried and developed for 3 hr. in a chamber with ethanol: acetic acid: water (64: 1: 35, vol%). The sheets were air dried and the spots containing the labeled adenosine and SAH marked under UV light. The spots were cut out and the radioactivity was determined by liquid scintillation counting. L-homocysteine (Sigma) solutions were used as standards and this assay yielded linear correlations between Hcy input and 14C cpm recovered.
Plasma lipids and HDL-cholesterol values
Plasma triglycerides and cholesterol were determined using commercial kits (Sigma), which were adapted for 96 well plates. HDL cholesterol was determined after separation from non-HLD cholesterol by 2-step density ultracentrifugation. In the first step, 30 μl plasma was overlayed with 30 μl of PBS in a thick-walled 200 μl tube, and the VLDL was floated up by spinning for 3 hrs at 70,000 rpm in an S100AT3 rotor (Beckman). The bottom 30 μl was transferred to a clean tube and mixed with 30 μl of a 1.12 g/ml KBr solution, resulting in a solution with a final density of 1.063 g/ml, which was spun for 16 hrs at 70,000 rpm. The bottom half with density > 1.063 that contains HDL and lipid free protein was used for cholesterol determination by the assay described above. Hematological values were determined using routine clinical assays.
Cholesterol absorption
Cholesterol absorption was determined as previously described [19]. Briefly, mice were housed singly in metabolic cages and gavaged orally with a mixture containing [14C]cholesterol and the non absorbable [3H]sitostanol in olive oil. The feces were collected for a 24 hr period, and the 14C/3H ratio in the feces and gavage mixture were used to calculate % cholesterol absorption, as previously described [19]
HDL turnover
HDL was prepared from wild type mice fed a chow diet by sequential density ultracentrifugation using the fraction d = 1.063 to 1.21 g/ml. HDL was labeled in its core with [3H]cholesteryl oleyl ether, as previously described [20], by use of rabbit lipoprotein deficient plasma as a source of cholesterol ester transfer protein. The labeled HDL was injected into the tail vein and blood samples were obtained at various time points from the retroorbital plexus, under Metofane anesthesia. Plasma radioactivity was counted for each sample, and normalized to the radioactivity at the 5 minute (initial) time point. The decay curve for each mouse was fit by non-linear regression to a two-phase exponential decay with the plateau set to 0 (analysis performed using GraphPad Prism software). The HDL-C fractional catabolic rates (FCR) for the slow decay curves were used to calculate the HDL-C production rates (PR) using the formula: PR = (FCR × HDL-C concentration x plasma volume), with or without normalization for body weight. Plasma volume was estimated to be 3.85% of the body weight.
Results
The effects of dietary methionine and folate on plasma tHcy in 8-week old apolipoprotein E (apoE) deficient mice were investigated. It was first determined whether dietary methionine, during a 4-week period, affected fasting plasma tHcy levels in chow-diet fed male apolipoprotein E-deficient mice. The chow diet was analyzed to contain 2.5 mg/kg folate and 4.2 g/kg methionine, resulting in an approximate daily intake of 6.6 μg folate and 11 mg of methionine per mouse. Three increasing amounts of methionine were fed chronically, by methionine addition to the drinking water. The mean fasting plasma tHcy in mice without methionine supplementation was 7.3 ± 1.5 μM, and increasing methionine in the diet resulted in increasing concentrations of fasting plasma tHcy, with estimated 132 mg/day methionine intake leading to fasting tHcy of 22 ± 2.5 μM (Fig. 1). Nonlinear regression of this data yields a Bmax of 28 μM tHcy (r2=0.90), suggesting that this is the theoretical limit of fasting level of tHcy that could be obtained in these mice on a normal folate diet by methionine supplementation in the drinking water.
Figure 1. Effect of varying dietary methionine levels on fasting plasma Hcy levels in apolipoprotein E-deficient mice.
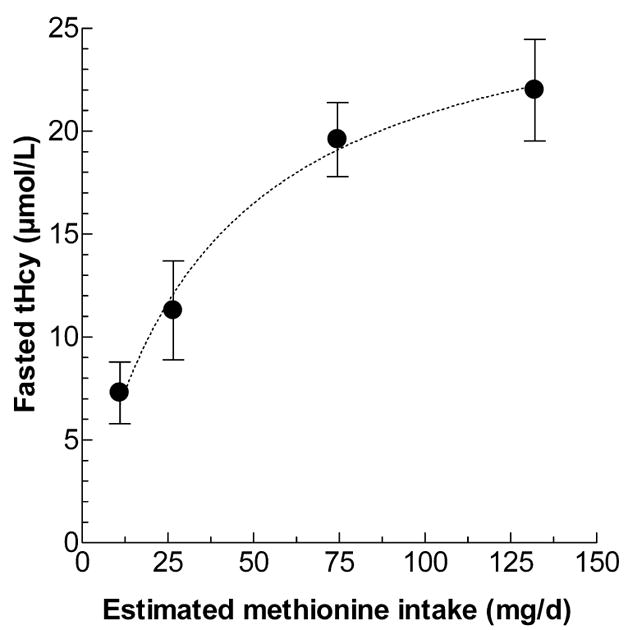
Chow diet, calculated to provide 12.5 ug/day folate, was supplemented with drinking water containing various levels of methionine to yield daily methionine intakes as shown. Groups of 5 mice were fed each diet for 4 weeks, fasted overnight with plain drinking water, and bled for determination of fasting plasma Hcy. Values are mean ± S.D., and the line was determined by non linear regression analysis.
To investigate the effects of both folate and methionine, we used a low folate diet that was analyzed to contain 0.065 mg/kg folate and 4.3 g/kg methionine (methionine content similar to the level in the chow diet). This diet was supplemented with drinking water containing either: 1) no additions to yield the low folate/low methionine diet (LoF/LoM); 2) 4% (w/v) methionine to yield the low folate/high methionine diet (LoF/HiM); 3) 10 mg/l folate to yield the high folate/low methionine diet (HiF/LoM); or 4) 10 mg/ml folate plus 4% methionine to yield the high folate/high methionine diet (HiF/HiM). The estimated daily intake of folate and methionine for these four diets are shown in Table 2. Mice were fed these four diets chronically from 9 weeks of age until 16 weeks of age (8–10 per group), and their tHcy levels, after an overnight fast and after replacing the folate/methionine supplemented drinking water with plain water, are shown in Table 3. The two groups on low methionine diets, HiF/LoM and LoF/LoM, had mean fasting tHcy levels of 9.3 and 12.6 μM, respectively. The LoF/HiM diet dramatically increased mean fasting plasma tHcy to 22.8 μM. However, the fasting hyperhomocysteinemia caused by the LoF/HiM diet was ameliorated by feeding high amounts of folate in the HiF/HiM diet, lowering the mean fasting tHcy levels to 10.0 μM.
Table 2.
Approximate daily folate and methionine intakes per mouse on different diets.
| Diet | Abbreviation | Folate μg/d | Methionine mg/d |
|---|---|---|---|
| Chow | 6.6 | 11 | |
| Low folate/low methionine | LoF/LoM | 0.17 | 11.3 |
| Low folate/high methionine | LoF/HiM | 0.17 | 125.7 |
| High folate/low methionine | HiF/LoM | 28.8 | 11.3 |
| High folate/high methionine | HiF/HiM | 28.8 | 125.7 |
| Glycine | GLY | 5.24 | 11.3 |
| Methionine | MET | 5.24 | 63.7 |
Values calculated based upon daily food and water intake of 2.62 g and 2.86 ml, respectively.
Table 3.
Effects of the test diets on tHcy levels and other parameters.
| N | tHcy fasted μM | tHcy eff μM | tHcy gav μM | BW g | Spleen mg | TC mg/dl | |
|---|---|---|---|---|---|---|---|
| LoF/LoM | 8 | 12.6±2.5 | 5.7±1.2 | 104±16 | 28.9±2.0 | 78±23 | 589±175 |
| LoF/HiM | 9 | 22.8±6.8 | 37±10 | 113±31 | 23.6±1.6 | 76±20 | 533±96 |
| HiF/LoM | 9 | 9.3±2.5 | 4.5±0.9 | 81±25 | 27.9±2.5 | 85±12 | 471±109 |
| HiF/HiM | 10 | 10.0±3.5 | 15±4.0 | 49±15 | 25.1±1.0 | 72±16 | 516±58 |
| P ANOVA | <0.0001 | <0.0005 | <0.0001 | <0.0001 | NS | NS | |
| Newman-Keuls Test | |||||||
| LoF/HiM vs. LoF/LoM | <0.001 | <0.001 | NS | <0.001 | |||
| HiF/LoM vs. LoF/LoM | NS | NS | <0.05 | NS | |||
| HiF/LoM vs. LoF/HiM | <0.001 | <0.001 | <0.05 | <0.001 | |||
| HiF/HiM vs. LoF/LoM | NS | NS | <0.001 | <0.001 | |||
| HiF/HiM vs. LoF/HiM | <0.001 | <0.01 | <0.001 | NS | |||
| HiF/HiM vs. HiF/LoM | NS | NS | <0.01 | <0.01 | |||
Newman-Keuls Post Test was only performed when the overall ANOVA test was significant. Abbreviations: Hcy eff, effective diurnal mean of tHcy level; Hcy gav, tHcy 2.5 hours after methionine loading; BW, body weight; TC, total cholesterol.
Fasting tHcy levels may not representative of the average tHcy levels in mice with free access to food and water; thus, plasma tHcy levels were monitored every 6 h over one day (Fig. 2). Mice are nocturnal and thus we observed a large diurnal variation in non-fasted plasma tHcy levels, with higher values at night and lower values at day. Interestingly, the fed tHcy values were greater than the fasting values for both high methionine diets, whereas the fed tHcy values were less than the fasting tHcy levels for both low methionine diets (compare Fig 2 to Table 3). By averaging the diurnal tHcy values at midnight, 6AM, noon, and 6 PM, the mean fed tHcy values were calculated for the four experimental diets, which we have called the effective tHcy levels and which are a better reflection of the chronic tHcy levels than the fasted tHcy values (Table 3). The effective tHcy levels were 4.5±0.9 μM (HiF/LoM), 5.7±1.2 μM (LoF/LoM), 37±10 μM (LoF/HiM), and 15±4.0 μM (HiF/HiM). The most striking difference between the fasted and effective tHcy values was observed in the HiF/HiM fed group, where the fasting values were roughly similar to the values for the LoF/LoM and HiF/LoM groups, while the effective values were about three-fold higher than the values for the LoF/LoM and HiF/LoM groups. The lack of significance between the effective tHcy of the HiF/HiM group and the LoF/LoM and HiF/LoM groups is only due to the small sample size and the conservative nature of the ANOVA Newman-Keuls multiple comparison posttest, as a similar test comparing data from just these 3 diets found the effective tHcy levels of mice on the HiF/HiM diet different from both the LoF/LoM and HiF/LoM groups (p<0.01), as do t-tests for HiF/HiM vs. both LoF/LoM and HiF/LoM (p<0.02).
Figure 2. Diurnal variation in non-fasted plasma Hcy levels.
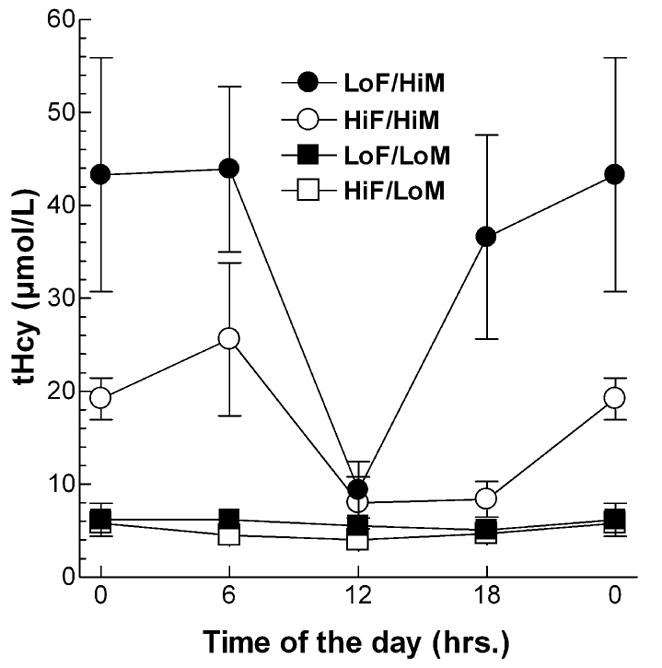
Mice (n=3 per diet) on the four test diets were bled at midnight (0 hours) and at 6 hour intervals for determination of plasma homocysteine levels. The lights in the room were on from 7 AM to 7 PM. Values are mean ± S.D. LoF/HiM, low folate high methionine; HiF/HiM, high folate high methionine; LoF/LoM, low folate low methionine; HiF/LoM, high folate low methionine.
After obtaining the fasting blood samples, the mice on the four test diets were subjected to oral gavage with 320 mg/kg methionine and bled 2.5 hours later at the time of sacrifice. These post-gavage bloods were used to obtain plasma tHcy values after oral methionine loading. There were dramatic increases in plasma tHcy after oral methionine loading for mice on all four test diets, with values > 100 μM detected for both folate-deficient diets (Table 3). The fold increase in tHcy levels comparing the methionine loaded to fasted samples is shown in Figure 3. Regardless of the folate content of the diet, the fold-increase in tHcy levels after methionine loading was almost twice as great (~8-fold) for mice fed the two low methionine diets than for mice fed the two high methionine diets (~4.5-fold). Therefore, chronic methionine intake resulted in an adaptive response which limited the induction-fold in tHcy levels after an acute methionine load.
Figure 3. Fold increase in plasma Hcy levels in mice after an acute oral methionine load compared to fasting Hcy levels.
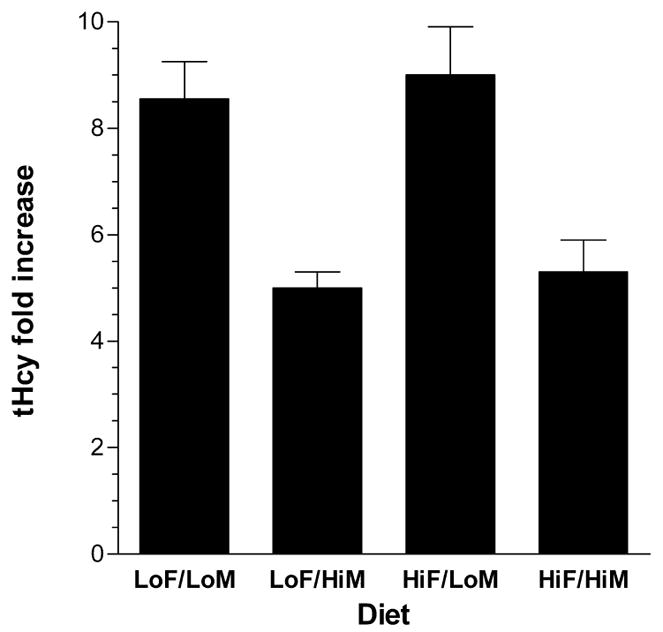
Hcy levels were determined from fasted plasma and plasma taken 2.5 hours after oral gavage with 320 mg/kg methionine. The mean ± S.D. fold increases are shown (n=5 per diet).
There was no significant influence of the different diets on spleen weight, total cholesterol (Table 3), hemoglobin, hematocrit, and complete or differential blood counts (latter values not shown) in these apoE-deficient mice. The LoF/HiM diet did, however, lead to a significant decrease in body weight compared to the other three diets (18% decrease vs. the LoF/LoM diet, Table 3). Despite this effect on body weight, all mice were healthy looking and well-groomed.
Based upon these results, we designed two new diets in which either 2% methionine or glycine, as a control amino acid, was milled into a solid-food diet containing 2.0 mg/kg folate, which we designated as MET and GLY diets, respectively. These diets are considerably easier to use compared to methionine supplementation in the water, which requires weekly mixing. We fed these diets to groups of male wild type and apoE-deficient mice starting at 7 weeks of age for a period of 5 weeks. The mice on the GLY diets had mean fasted Hcy levels of ~ 5 μM. The MET diet led to significantly higher mean fasted Hcy levels of 90 and 68 μM for the in the wild type and apoE-deficient mice, respectively (Fig 4A). Body weights were reduced by > 20% in both strains of mice fed the MET diet (Fig 4B), similar to the body weight reduction observed in the mice supplemented with 4% methionine in their drinking water (Table 3). One possible explanation for this finding would be that the mice did not like the taste of the MET diet and ate less food. However, this was not the case as we found no significant difference in the amount of food consumed comparing mice fed the MET (3.58 + 0.57 g/d, N=5) and GLY diets (3.70 + 0.58 g/d, N=5), which was assessed over a 24 hr period in 12-week old mice housed in metabolic cages. As expected, the plasma total cholesterol levels were ~ 500 mg/dl in the apoE-deficient mice, and below 100 mg/dl in the wild type mice (Fig 4C, p<0.001 for the apoE-deficient mice vs. the wild type mice by ANOVA posttest). The wild type mice fed the MET diet had 37% lower total cholesterol levels than the mice on the GLY diet (p<0.001), and the same trend was observed in the apoE-deficient mice, albeit not statistically significant. Since most of the plasma cholesterol in wild type mice is carried on HDL, we assayed HDL-C levels in these samples as well. The MET diet led to a highly significant 33% reduction in HDL-C levels in wild type mice, and a 25% reduction in HDL-C levels in apoE-deficient mice, which was not statistically significant (Fig 4D). As previously observed [21], HDL-C levels were reduced in apoE-deficient mice compared to wild type mice (p<0.01 for the apoE-deficient mice vs. the wild type mice by ANOVA posttest).
Figure 4. MET and GLY diet effects on wild type and apoE-deficient mice.
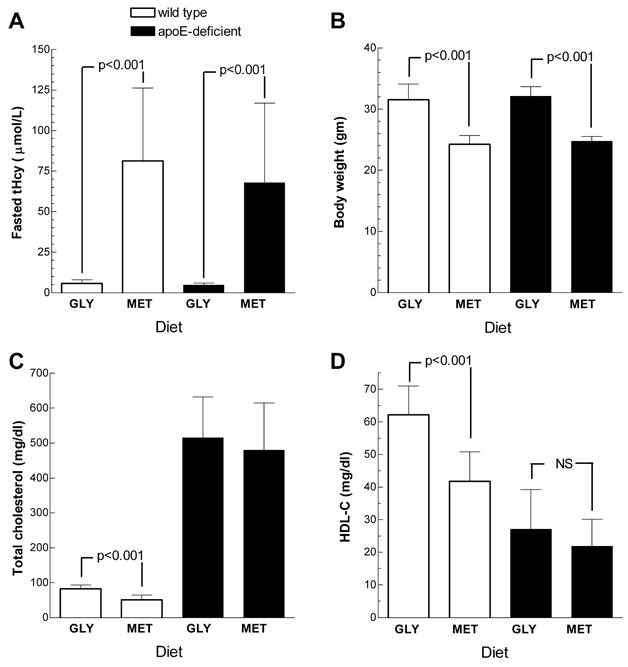
A. Fasted Hcy levels in wild type (open bars) and apoE-deficient (closed bars) on the GLY and MET diet as indicated (n = 9 to 13 per group, mean ± S.D., p-values shown are from two-tailed t-tests of the diet effect within each mouse type). B. Body weights in wild type and apoE-deficient on the GLY and MET diet (analysis as described in A). C. Total plasma cholesterol in wild type and apoE-deficient on the GLY and MET diet (analysis as described in A). D. HDL-cholesterol in wild type and apoE-deficient on the GLY and MET diet (analysis as described in A).
Cholesterol absorption and HDL turnover studies were performed to follow up on the MET diet induced reduction in HDL-C in wild type mice. Cholesterol absorption was measured by a dual isotope gavage method using [14C]cholesterol and the poorly absorbed [3H]sitostanol in two independent experiments each with 5 wild type male mice on each diet. Pooling data from both experiments, the mice on the GLY and MET diets had 80.0 ± 5.1% and 82.8 ± 10.1% mean cholesterol absorptions (not significant). HDL turnover was assayed by i.v. injection of [3H]cholesteryl oleyl ether labeled HDL into five wild type male mice each on the GLY and MET diets. Since the ether linkage of cholesteryl oleyl ether cannot be cleaved, the label is not readily releasable from tissues, and thus the plasma disappearance of the label is reflective of HDL turnover (Fig. 5). The turnover of the labeled HDL in each mouse was fit by non-linear regression to a 2-phase exponential decay. The initial rapid phase had average fractional catabolic rates (FCR) of 9.0 and 6.1 pools per hour for the mice on the GLY and Met diets, respectively (NS). This initial rapid phase of decay is probably due to plasma HDL equilibration with the interstitial fluid, and thus we calculated the HDL-cholesterol FCR by use of the second and slower phase of HDL clearance. The slow phase HDL FCRs were 0.070 and 0.071 pools per hour for the mice on the GLY and Met diets, respectively (NS, Table 4). As before, the MET diet led to a significant reduction in body weight (24% reduction, Table 4). And, the mean HDL-C levels were reduced 24%, going from 94.4 mg/dl on the GLY diet to 71.8 mg/dl on the MET diet. Using the HDL-cholesterol values as well as the calculated plasma volumes and body weights, we calculated HDL-cholesterol production rates of 2.53 and 1.91 μg/hr/g body weight for mice on the GLY and Met diets, respectively (p=0.019, Table 4). Thus, the 24% decrease in HDL-C levels was reflected by a significant 25% decrease in HDL production rate adjusted per gram of body weight, and a significant 45% reduction in HDL transport rate not adjusted by body weight (Table 4).
Figure 5. HDL turnover in wild type mice fed GLY or MET diet.
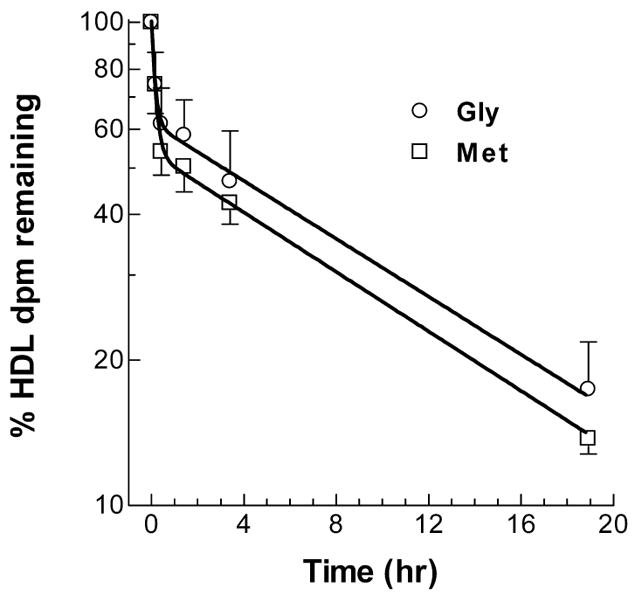
[3H]Cholesteryl oleyl ether labeled HDL was injected into groups of mice fed the GLY (open squares, n = 8) or MET (open circles, n = 10) diet. Clearance of plasma 3H dpm was followed over time (normalized to the 5 min post injection time point, mean ± S.D.). The data fit a two-phase exponential decay model.
Table 4.
Methionine effects on HDL turnover
| Body weight g | HDL-C mg/dl | HDL-C FCR pools/hr | HDL-C PR μg/hr | HDL-C PR μg/hr/g | |
|---|---|---|---|---|---|
| GLY | 31.8 ± 1.8 | 94.4 ± 6.8 | 0.070 ± 0.010 | 81 ± 12 | 2.53 ± 0.33 |
| MET | 24.1 ± 1.4 | 71.8 ± 4.8 | 0.071 ± 0.010 | 45 ± 4 | 1.91 ± 0.27 |
| P value | <0.0001 | 0.0003 | NS | 0.001 | 0.019 |
All values mean + S.D., five mice per group, p-values based upon two-tailed t-test. FCR, fractional catabolic rate; PR, production rate; NS, not significant. The HDL-C FCR values are based upon the slow phase turnover as described in the text.
Discussion
The focus of this study is on the effects of feeding mice a high methionine diet. At a normal level of dietary folate, a high methionine diet led to decreased body weight, increased plasma tHcy, and decreased plasma HDL-C. Most Hcy studies in mice and many in humans have used fasting samples for determination of plasma tHcy. For mice on low methionine diets, we observed that the fasted plasma tHcy levels were much higher than the effective tHcy levels averaged over 24 hrs in fed mice. However, after an overnight fast the mice had not had a major feeding period for over 1 day, since mice eat primarily at night. We have observed that this fasting regimen led to a 10 to 15% decrease in body weight, and thus these mice were in a catabolic state. We speculate that endogenous protein turnover during this catabolic state could lead to increased plasma methionine, compared to the fed state of these mice on the low methionine diets, and that this might account for increased Hcy in the fasted mice on these diets. Similar to what we observed in the mice fed the low methionine diets, tHcy levels are also reported to be higher in human subjects who had fasted at least 6 hrs than in subjects who had a recent meal [22]. In contrast, fasted tHcy levels were lower than the effective levels for the mice fed the two high methionine diets, since the effective methionine levels were greatly influenced by high methionine plasma levels in the fed state on these diets. Another finding of interest is that the high folate diet masked the effect of the high methionine diet on fasted tHcy levels (10 μM), but had less effect in masking the effect of the high methionine diet on the effective tHcy levels averaged over 24 hrs (15 μM).
Chronic feeding of the high methionine diet, independent of dietary folate, diminished the fold induction of tHcy levels after the oral methionine loading, compared to the fasting values. Although tHcy levels were high for all mice after the oral methionine load, the induction-fold was about half as large in the mice chronically fed either of the high methionine diets. This apparently adaptive response to chronic high methionine diet could possibly be due to up-regulation in enzymes that metabolize Hcy, for example cystathione β-synthase. It is of interest, that of 5 mouse strains subjected to oral methionine loading, C57BL/6, the strain used in the current study, was the most responsive and yielded the highest levels of tHcy post methionine loading [11].
We observed a very strong diurnal variation in plasma tHcy levels for the mice on the high methionine diets, with the highest levels observed during the dark cycle, when the mice are more active and eat most of their food. A much weaker diurnal effect has been observed in human subjects with decreased plasma tHcy levels at night [23]. In addition, we observed a striking difference in fasted tHcy levels based upon whether methionine was added to the drinking water or milled into the food. For example the fasting tHcy for apoE-deficient mice on the low folate/high methionine (water supplemented diet) was ~23 μM (Table 3), while the fasting tHcy for the apoE-deficient mice on the solid food MET diet (containing more folate and less methionine than the low folate/high methionine water supplemented diet) had much higher tHcy levels of ~68 μM (Fig. 4A). This could be due to different chemical stability of methionine in the water vs. solid food supplemented diets, or to differences in the methionine absorption or metabolism; however, the precise reason for this effect is not known.
Dietary methionine has been reported to have only minor effects on fasted plasma tHcy in humans. In one study based upon a diet questionnaire, subjects who were in the top quartile of methionine intake, compared to subjects in the bottom quartile, actually had lower fasted plasma tHcy, arguing against a hyperhomocysteinemia effect of dietary methionine [8]. Another study found that methionine dietary supplementation did lead to a trend to increased plasma tHcy levels in men, with plasma levels of 18 μM tHcy achieved with 75 mg/kg/d methionine supplementation [9]. Interestingly, vegans, who have less dietary protein intake than meat-eaters, had higher fasted plasma tHcy levels, although the might be due to their low plasma levels of vitamin B12, a co-factor for Hcy metabolism [10]. Since all of the above human studies used fasted plasma samples, one might ask if this is the best type of plasma sample to use in the determination of tHcy levels in humans. Further human studies are needed to resolve this issue, but based on our mouse studies, obtaining both a fasting and a post methionine load sample may prove the most informative. It would be interesting to ascertain whether the ratio of post-load to fasting Hcy is influenced by the pattern of dietary methionine intake in humans, and if this ratio is affected by vitamin intake and the common MTHFR polymorphism.
We observed a significant effect of the MET diet on decreasing HDL-C in wild type mice, which was associated with a decreased production rate, rather than an increased turnover rate. A similar decrease in plasma HDL was observed in cystathionine-β-synthase (Cbs)−/− mice that have profound hyperhomocysteinemia [12, 13]. Additionally, total plasma cholesterol levels were reported to decrease by 27% in wild type C57BL/6 mice fed a high methionine diet [15]; although HDL-C levels were not reported We speculate that increased tHcy due to dietary methionine may lead to down regulation of one of the key players in HDL production, such as apoA-I, ABCA1, or LCAT. Supporting this idea, Cbs−/− mice were shown to have decreased LCAT mRNA and plasma activity [13]. Recently, a gene array study of liver RNA from mildly hyperhomocysteinemic hemizygous Mthfr+/−deficient mice revealed decreases in apoA-I and apoA-IV mRNA, compared to wild type mice [14]. In addition 30 to 40% decreases in plasma apoA-I were detected in the Mthfr+/− mice, as well as in the Cbs+/− mice, implying a Hcy effect; although curiously, plasma HDL-C levels were not reported in the Mthfr+/− mice [14]. Furthermore, this paper also reported inverse correlations between plasma tHcy and both plasma apoA-I levels and HDL-C, in a cohort of men with coronary artery disease [14]. ApoA-I levels in HepG2 hepatoma cells were reduced by incubation of the cells with 5 mM Hcy, but this dose is clearly out of the range of physiological levels [14], weakening the significance of this finding. Endoplasmic reticulum stress has been shown to be involved in Hcy regulation of gene expression in both cultured endothelial cells, as well as in HepG2 cells [15], but again this response is to mM levels of Hcy. We speculate that the effects of Hcy on reducing HDL-C, and an implied reduction in reverse cholesterol transport, may play a role in the association of elevated tHcy with atherosclerosis and coronary artery disease, but whether this mechanism is in fact involved in atherosclerosis remains to be determined.
Acknowledgments
We thank Jan L. Breslow for his support, discussion, and critical reading of the manuscript.
This work was supported by grant PO1 HL54591 from the N.I.H. to J.D.S., and by grant Me 1507/1-1 from the Deutsche Forschungsgemeinschaft to M.M.
Abbreviations
- CAD
coronary artery disease
- Cbs
cystathionine-β-synthase
- FCR
fractional catabolic rate
- Hcy
homocysteine
- HDL-C
HDL-cholesterol
- HiF/HiM
high folate/high methionine diet
- HiF/LoM
high folate/low methionine diet
- LoF/HiM
low folate/high methionine diet
- LoF/LoM
low folate/low methionine diet
- MTHFR
methylenetetrahydrofolate reductase
- PR
production rate
- tHcy
total plasma homocysteine levels after reduction
Footnotes
Publisher's Disclaimer: This is a PDF file of an unedited manuscript that has been accepted for publication. As a service to our customers we are providing this early version of the manuscript. The manuscript will undergo copyediting, typesetting, and review of the resulting proof before it is published in its final citable form. Please note that during the production process errors may be discovered which could affect the content, and all legal disclaimers that apply to the journal pertain.
References
- 1.Mudd SH, Poole JR. Labile methyl balances for normal humans on various dietary regimens. Metabolism. 1975;24:721–35. doi: 10.1016/0026-0495(75)90040-2. [DOI] [PubMed] [Google Scholar]
- 2.Boushey CJ, Beresford SA, Omenn GS, Motulsky AG. A quantitative assessment of plasma homocysteine as a risk factor for vascular disease. Probable benefits of increasing folic acid intakes. JAMA. 1995;274:1049–57. doi: 10.1001/jama.1995.03530130055028. [DOI] [PubMed] [Google Scholar]
- 3.Clarke R. Homocysteine and risk of ischemic heart disease and stroke: a meta-analysis. JAMA. 2002;288:2015–22. doi: 10.1001/jama.288.16.2015. [DOI] [PubMed] [Google Scholar]
- 4.Engbersen AM, Franken DG, Boers GH, Stevens EM, Trijbels FJ, Blom HJ. Thermolabile 5,10-methylenetetrahydrofolate reductase as a cause of mild hyperhomocysteinemia. Amer J Hum Genet. 1995;56:142–50. [PMC free article] [PubMed] [Google Scholar]
- 5.Klerk M, Verhoef P, Clarke R, Blom HJ, Kok FJ, Schouten EG. MTHFR 677C-->T polymorphism and risk of coronary heart disease: a meta-analysis. JAMA. 2002;288:2023–31. doi: 10.1001/jama.288.16.2023. [DOI] [PubMed] [Google Scholar]
- 6.Jacques PF, Bostom AG, Williams RR, Ellison RC, Eckfeldt JH, Rosenberg IH, Selhub J, Rozen R. Relation between folate status, a common mutation in methylenetetrahydrofolate reductase, and plasma homocysteine concentrations. Circulation. 1996;93:7–9. doi: 10.1161/01.cir.93.1.7. [DOI] [PubMed] [Google Scholar]
- 7.Shimakawa T, Nieto FJ, Malinow MR, Chambless LE, Schreiner PJ, Szklo M. Vitamin intake: a possible determinant of plasma homocyst(e)ine among middle-aged adults. Ann Epidemiol. 1997;7:285–93. doi: 10.1016/s1047-2797(97)00004-5. [DOI] [PubMed] [Google Scholar]
- 8.Ward M, McNulty H, Pentieva K, McPartlin J, Strain JJ, Weir DG, Scott JM. Fluctuations in dietary methionine intake do not alter plasma homocysteine concentration in healthy men. J Nutr. 2000;130:2653–7. doi: 10.1093/jn/130.11.2653. [DOI] [PubMed] [Google Scholar]
- 9.Ward M, McNulty H, McPartlin J, Strain JJ, Weir DG, Scott JM. Effect of supplemental methionine on plasma homocysteine concentrations in healthy men: a preliminary study. Int J Vitam Nutr Res. 2001;71:82–6. doi: 10.1024/0300-9831.71.1.82. [DOI] [PubMed] [Google Scholar]
- 10.Mann NJ, Li D, Sinclair AJ, Dudman NP, Guo XW, Elsworth GR, Wilson AK, Kelly FD. The effect of diet on plasma homocysteine concentrations in healthy male subjects. Eur J Clin Nutr. 1999;53:895–9. doi: 10.1038/sj.ejcn.1600874. [DOI] [PubMed] [Google Scholar]
- 11.van Straaten HW, Blom H, Peeters MC, Rousseau AM, Cole KJ, Seller MJ. Dietary methionine does not reduce penetrance in curly tail mice but causes a phenotype-specific decrease in embryonic growth. J Nutr. 1995;125:2733–40. doi: 10.1093/jn/125.11.2733. [DOI] [PubMed] [Google Scholar]
- 12.Wang H, Jiang X, Yang F, Gaubatz JW, Ma L, Magera MJ, Yang X, Berger PB, Durante W, Pownall HJ, Schafer AI. Hyperhomocysteinemia accelerates atherosclerosis in cystathionine beta-synthase and apolipoprotein E double knock-out mice with and without dietary perturbation. Blood. 2003;101:3901–7. doi: 10.1182/blood-2002-08-2606. [DOI] [PubMed] [Google Scholar]
- 13.Namekata K, Enokido Y, Ishii I, Nagai Y, Harada T, Kimura H. Abnormal lipid metabolism in cystathionine beta-synthase-deficient mice, an animal model for hyperhomocysteinemia. J Biol Chem. 2004;279:52961–9. doi: 10.1074/jbc.M406820200. [DOI] [PubMed] [Google Scholar]
- 14.Mikael LG, Genest J, Jr, Rozen R. Elevated homocysteine reduces apolipoprotein A-I expression in hyperhomocysteinemic mice and in males with coronary artery disease. Circ Res. 2006;98:564–71. doi: 10.1161/01.RES.0000204825.66410.0b. [DOI] [PubMed] [Google Scholar]
- 15.Werstuck GH, Lentz SR, Dayal S, Hossain GS, Sood SK, Shi YY, Zhou J, Maeda N, Krisans SK, Malinow MR, Austin RC. Homocysteine-induced endoplasmic reticulum stress causes dysregulation of the cholesterol and triglyceride biosynthetic pathways. J Clin Invest. 2001;107:1263–73. doi: 10.1172/JCI11596. [DOI] [PMC free article] [PubMed] [Google Scholar]
- 16.Refsum H, Helland S, Ueland PM. Radioenzymic determination of homocysteine in plasma and urine. Clin Chem. 1985;31:624–8. [PubMed] [Google Scholar]
- 17.Ueland PM, Helland S, Broch OJ, Schanche JS. Homocysteine in tissues of the mouse and rat. J Biol Chem. 1984;259:2360–4. [PubMed] [Google Scholar]
- 18.Chu RC, Hall CA. The total serum homocysteine as an indicator of vitamin B12 and folate status. Am J Clin Pathol. 1988;90:446–9. doi: 10.1093/ajcp/90.4.446. [DOI] [PubMed] [Google Scholar]
- 19.Sehayek E, Shefer S, Nguyen LB, Ono JG, Merkel M, Breslow JL. Apolipoprotein E regulates dietary cholesterol absorption and biliary cholesterol excretion: studies in C57BL/6 apolipoprotein E knockout mice. Proc Natl Acad Sci U S A. 2000;97:3433–7. doi: 10.1073/pnas.050016197. [DOI] [PMC free article] [PubMed] [Google Scholar]
- 20.Rinninger F, Pittman RC. Regulation of the selective uptake of high density lipoprotein-associated cholesteryl esters. J Lipid Res. 1987;28:1313–25. [PubMed] [Google Scholar]
- 21.Plump AS, Scott CJ, Breslow JL. Human apolipoprotein A-I gene expression increases high density lipoprotein and suppresses atherosclerosis in the apolipoprotein E-deficient mouse. Proc Nat Acad Sci U S A. 1994;91:9607–11. doi: 10.1073/pnas.91.20.9607. [DOI] [PMC free article] [PubMed] [Google Scholar]
- 22.Nurk E, Tell GS, Nygard O, Refsum H, Ueland PM, Vollset SE. Plasma total homocysteine is influenced by prandial status in humans: the Hordaland Hhomocysteine Sstudy. J Nutr. 2001;131:1214–6. doi: 10.1093/jn/131.4.1214. [DOI] [PubMed] [Google Scholar]
- 23.Svatikova A, Wolk R, Magera MJ, Shamsuzzaman AS, Phillips BG, Somers VK. Plasma homocysteine in obstructive sleep apnoea. Eur Heart J. 2004;25:1325–9. doi: 10.1016/j.ehj.2004.05.018. [DOI] [PubMed] [Google Scholar]