

Abstract
Despite multiple advances in medical imaging, noninvasive monitoring of therapeutic efficacy for malignant gliomas remains problematic. An underutilized observation is that malignancy induces characteristic abnormalities of vessel shape. These characteristic shape abnormalities affect both capillaries and much larger vessels in the tumor vicinity, involve larger vessels prior to sprout formation, and are generally not present in hypervascular benign tumors. Vessel shape abnormalities associated with malignancy thus may appear independently of increase in vessel density. We hypothesize that an automated, computerized analysis of vessel shape as defined from high-resolution MRA can provide valuable information about tumor activity during the treatment of malignant gliomas. This report describes vessel shape properties in 10 malignant gliomas prior to treatment, in 2 patients in remission during treatment, and in 2 patients with recurrent disease. One subject was scanned multiple times. The method involves an automated, statistical analysis of vessel shape within a region of interest for each tumor, normalized by the values obtained from the vessels within the same region of interest of 34 healthy subjects. Results indicate that untreated tumors display statistically significant vessel tortuosity abnormalities. These abnormalities involve vessels not only within the tumor margins as defined from MR but also vessels in the surrounding tissue. The abnormalities resolve during effective treatment and recur with tumor recurrence. We conclude that vessel shape analysis could provide an important means of assessing tumor activity.
Keywords: GBM, Tortuosity, MRA, Vessels, Computer analysis
Introduction
An ongoing clinical dilemma is how best to assess tumor malignancy and to monitor therapeutic response noninvasively. Noninvasive imaging techniques such as perfusion magnetic resonance (MR) imaging, MR-spectroscopy, and positron emission tomography (PET) have been found useful in grading cerebral neoplasms and in monitoring treatment response. However, no method has yet proven fully reliable (1–4), and, at least at our institution, the frequency of both false positive and false negatives by any of these methods has precluded reliance upon non-invasive imaging techniques for clinical decision-making.
An alternative and complementary approach is to analyze the shapes of the larger vessels that can be visualized directly by magnetic resonance angiography (MRA). This method has also been shown to have the potential for discriminating between benign and malignant disease (5, 6). The approach is based upon the fact that malignancy induces abnormal vessel tortuosity (7–9). These vessel shape changes are not restricted to the capillary bed but also involve much larger, initially normal, vessels that course in the tumor vicinity (10), thus allowing discrimination of abnormal vessels on high-resolution MRA (5, 6, 11). Of importance, vessel tortuosity abnormalities precede vessel sprout formation (10), thus making abnormal tortuosity a potentially appealing marker for incipient cancers and for malignant tumors without a dense capillary network.
This preliminary report explores the feasibility of using quantitative, computerized calculations of vessel tortuosity to assess the activity of malignant gliomas prior to and during treatment. Our hypothesis is that abnormal vessel tortuosity is associated with active tumor growth, and thus should be present on initial presentation, should resolve during periods of remission, and should reappear with early tumor recurrence. This report also explores the distance from the apparent tumor surface over which vessel shape abnormalities occur, with the idea that the distance over which the tumor exerts its effect on vessel morphology might be as important as the extent of the abnormalities themselves. We conclude that quantitative vessel shape measurements do indeed show promise in monitoring tumor activity. The value of determining the distance over which such abnormalities occur is less certain, however, and will require animal studies to interpret.
Methods
The approach involves a quantitative, statistical evaluation of vessel shape within a region of interest in each tumor patient. The values are then compared to the values obtained within the same region of interest of a healthy database of subjects. Images of thirty-four healthy subjects, ranging in age from nineteen to seventy-four and comprising eighteen females and sixteen males, make up the healthy database. Untreated tumors include nine glioblastomas (GBM) and one grade III glioma scanned prior to initial surgery. Treated tumors include one grade III glioma in remission during treatment, one patient with GBM in remission during treatment and scanned at several time points, and two cases of recurrent GBM following initially successful treatment.
Image Acquisition
Images were obtained upon a head-only 3T MR unit (Allegra, Siemens Medical Systems Inc., Germany) or upon a 1.5T MR unit (Sonata, Siemens Medical Systems Inc., Germany). A head coil was employed. T1, T2, and MRA sequences covering the entire head were performed on all subjects, with tumor patients additionally receiving a gadolinium enhanced T1 sequence. The imaging parameters were as follows for the T1 and T2 images: TR/TE/TH/=15msec/7msec/1mm for the T1-weighted imaging sequence and TR/TE/TH= 7730msec/80msec/1mm for the T2-weighted images. The inplane resolution was 1 × 1 mm2, with an interslice spacing of 1mm for T1 images and 3mm for T2 images.
For obtaining brain vasculature, a 3D time-of-flight MRA sequence was employed. Velocity compensation along both frequency and partition encoding directions was used to minimize signal dephasing induced by the flowing spins. In addition, a magnetization transfer pulse was employed to suppress signal from brain parenchyma while maintaining signal from flowing spins and thus improving the visibility of brain vasculature. The voxel size was 0.5 × 0.5 × 0.8 mm3 and the entire head was covered. Acquisition parameters included TR=35, TE=3.5, Flip Angle=22, Matrix=309 × 448, FOV=230 × 230.
Image Segmentation
Quantitative measurement of vessel tortuosity requires explicit definition of individual vessels. Our approach also requires delineation of a region of interest, which was here initially defined as the volume defined by the tumor surface. Segmentation of both vessels and tumor was therefore required.
Vessel extraction involved 3 steps: definition of a seed point, automatic extraction of an image intensity ridge representing the vessel’s central skeleton, and automatic determination of vessel radius at each skeleton point (12). The output of the program provided sets of directed, 4-dimensional points indicating the (x,y,z) spatial position of each sequential vessel skeleton point and an associated radius at each point. Extracted vessels were then postprocessed to produce connected vessel trees and to exclude noise (13).
Tumor segmentation was performed using either a fully automated method (14) or a partially manual program that segments tumors via polygon drawing and filling on orthogonal cuts through an image volume (15). One patient followed over time had only a tiny, patchy lesion discernible on initial postoperative scan and no detectable tumor on later scans. In this case, the region of interest in the initial scan was manually defined and the tumor margins were then automatically dilated until the defined volume contained four vessels, as has we have done in the past for tiny lesions (6). This same region of interest was then mapped to all subsequent scans of the same patient.
Image Registration
The human vasculature is variable. It is thus impossible to provide a one-to-one vascular mapping between patients for more than a few named vessels. Moreover, vessel attributes vary from location to location within the head. Evaluation of disease thus requires knowledge of the mean and variance of normal vessel attributes within a region of interest. Such mapping across patients requires image registration.
For this study, we decided not to transform the vessels, as affine transformation might alter measurements of tortuosity and other vessel attributes, but rather to deform the region of interest across patients. Vessels were thus analyzed only in their native states. All registrations were performed using Rueckert and Schnabel’s mutual information-based registration program (16, 17). This program permits rigid, affine, and fully deformable registration. For rigid and affine registrations, the output can be saved as a file convertible to a registration matrix. For this project, we employed only rigid and full affine registrations and saved the output matrices.
The T1 image of each subject was registered using a full affine registration to the ICBM T1 brain atlas (18). The additional images of each subject were then rigidly registered to that same patient’s T1 image (Figure 1). Lesion coordinates from any tumor patient could then be transformed into the coordinate system of any subject’s MRA via a set of matrix multiplications, using matrix inversion when appropriate. This approach requires only a single registration per image, regardless of the number of images to which a region of interest may be mapped.
Figure 1.

Registration of a subject’s images into a common coordinate system using both rigid and affine transformations. By a combination of forward and backward mapping, a region of interest defined from any image can then be mapped into the undeformed space of any other image that has been also mapped to the same common coordinate system.
Vessels traversing the region of interest were clipped to that surface, and analysis was applied only to the vessel segments confined to the region of interest. The current study compared vessel attributes of 34 healthy subjects to those of each tumor patient.
Regions of Interest Used to Determine Spread of Tortuosity Abnormalities
One of the purposes of this report is to explore how vessel morphology changes with distance from the discernible tumor surface. We therefore created sequential, hollow, nonoverlapping shells at increasing distance from the definable tumor surface, and analyzed vessel attributes both within the tumor confines and within each consecutive shell around the tumor.
Following determination of vessel shape within the initial region of interest (the tumor boundaries), the region of interest was automatically dilated by 8 voxels in each dimension (8 mm in each dimension for our 1 × 1 × 1 mm3 gadolinium enhanced T1 images) using mathematical morphology. The previous, solid region of interest was then subtracted to provide a concentric, 8 mm thick, hollow shell around the tumor. The shell region was then mapped to each healthy subject and the vessel analysis was repeated. This shell dilation process was repeated 10 times to provide 10 concentric, 8 mm thick, hollow shells around each tumor (Figure 2). For peripheral lesions, the method resulted in portions of some shells lying outside of the head. The analysis was not affected by such outlying shells, however, since vessel shape calculation was performed only upon those vessels lying within the region of interest.
Figure 2.

Hollow shell dilation about tumor surface. Far left: T1-GAD slice. Subsequent images show the same slice with the region of interest superimposed in white. From left to right, the region of interest is the tumor and then ring dilation 1, ring dilation 2, ring dilation 5, and ring dilation 10. Note that the dilations cover a large volume of the head.
Tortuosity and Vessel Density Measures
Our vessel segmentations defined each vessel as an ordered set of 3D points indicating an x,y,z spatial position of the skeleton curve with an associated radius at each point. Each skeleton curve was defined as a spline, which was subsequently subsampled to produce an ordered set of skeleton points regularly spaced at intervals of the length of one voxel.
We employed two distinct tortuosity measures (11). The first metric, the “Sum of Angles Metric” (SOAM), summed the angles between consecutive trios of points along a space curve and normalized by the path length. Results were output as radians/cm. Vessels of high curvature have elevated SOAM values. In particular, the SOAM is effective in detecting high-frequency, low-amplitude coils or sine waves.
The second measure, the “Inflection Count Metric” (ICM), counted “inflection points” along each space curve and multiplied this number (plus one) times the total path length and then divided by the distance between endpoints. For a 3D space curve, we defined an inflection point as a locus that exhibits a minimum of total curvature. In particular, the Normal and Binormal axes of the Frenet frame (19) change orientation by close to 180º as the frame passes through an inflection point. As a result, one can search for 3D inflection points by identifying large local maxima of the dot product ΔN · ΔN, where N is the unit vector representing the Frenet normal axis, and ΔN represents the difference of the normal axes associated with the consecutive points Pk and Pk+1. Results are output as a dimensionless number. The ICM is effective in detecting larger amplitude curves.
Malignant vessel tortuosity is characterized by an unusual configuration that produces “…many smaller bends upon each larger bend” (7). Malignant tumor vessels therefore tend to exhibit statistically increased tortuosity values by both the SOAM and the ICM (Figure 3). More detail on our tortuosity classifications and on the mathematical methods employed to characterize them is available in (11).
Figure 3.

Malignant tumor vasculature is characterized by “many smaller bends upon each larger bend” (left). An abnormal increase in larger bends (center) can be detected by the ICM, and an abnormal increase in smaller bends (right) can be detected by SOAM. Malignant tumor vasculature tends to exhibit increased tortuosity by both metrics, with the SOAM of greatest prognostic significance.
A third measure, the “Terminal Branch Count” (TBC), was also analyzed. This metric counts the number of vessels entirely contained within the region of interest. More specifically, a terminal branch is defined as a single, unbranching vessel whose start and end points are each contained within the region of interest and which does not possess any points lying outside of the region of interest (Figure 4). Such vessels tend to be short and small in diameter. Hypervascular tumors with vigorous sprouting tend to exhibit an increase in the TBC as compared to the count in the same anatomical region of healthy controls. The terminal branch count thus provides an indirect measure of vessel sprouting.
Figure 4.

Terminal branches. The oval represents the region of interest. The two thick vessels are vessels of passage. The three fine vessels are terminal branches that, by definition, are entirely contained within the region of interest.
Statistical Analysis
Because vessel shapes vary from location to location within the head (20), the tortuosity abnormalities induced by a tumor located in a specific region are superimposed upon the healthy tortuosity values present in that same region. We therefore normalized the vessel shape measures obtained for each tumor by the means and standard deviations of the vessel shape measures determined within the same region of interest of the healthy database. Normalization of each tumor value was performed by “z-scoring” each value: (tumor_value – healthy_mean)/healthy_standard_deviation. Under this representation a value of “2.1” indicates a value 2.1 standard deviations above the healthy mean and a value of “−0.5” indicates a value 0.5 standard deviations below the healthy mean. All statistical analyzes were performed upon z-scored values, permitting detection of the same disease in different anatomical locations.
An earlier discriminant analysis performed upon the z-scored shape measures of 22 known malignant tumors and 8 known benign tumors indicated clear separation between the two tumor groups by the statistically determined linear discriminant equation Y = 1.73 · SOAM + 0.37 · ICM – 2.84. Tumors were malignant if Y was greater than 0 and were benign otherwise. The current report employed this equation to calculate the likelihood of malignancy within the boundary of GBMs as defined from GAD+ images and within a set of concentric shells around each tumor surface up to a distance of 8 cm.
Validation of Image Processing Results
For the nine untreated GBM patients, the untreated grade III glioma, and the two patients with recurrent disease, image analysis was performed on preoperative images obtained prior to total gross resection of each lesion. Direct correlation was therefore available for the computerized assessment of malignancy of the delineable lesion and the diagnosis given by histopathological examination of the resected tissue.
The patient with clinically stable disease and the patient scanned at multiple time points during therapy have not yet been reoperated upon. There was therefore no direct histopathological confirmation of the image processing results. For these patients, evaluation of the image processing method was therefore done by comparison to the patient’s clinical course. Based upon clinical practice guidelines, we selected two months as the time at which the patient should be clinically evaluated following the computerized analysis. If the program indicated quiescent disease and the patient remained clinically stable two months later, we reported the program’s analysis as likely correct. If, however, the program indicated quiescent disease and the patient developed neurological deficits or showed enlargement of the lesion by MR within two months, then the program’s findings were considered suspect.
We cannot validate the program’s findings directly for the concentric shells around the tumor surface, since these areas were not biopsied or resected. However, malignant gliomas are known to extend beyond the enhancing tumor margins seen by MR (21, 22). We therefore believed it of interest to examine how far beyond the apparent tumor margins vessel tortuosity abnormalities extend both in patients with active disease and in patients in remission.
Results
Figure 5 provides an image of segmented vessels displaying the typical tortuosity abnormality seen with malignancy. The distinctive shape is that of “many smaller bends upon each larger bend” (7).
Figure 5.

Tortuosity abnormality in malignancy. There are many small, sharp bends superimposed upon each larger bend in the abnormal vessels. Arrows point to examples of the small, sharp bends.
Figure 6 provides a graph of malignancy index versus tumor distance in nine GBM patients prior to any treatment. In this and all subsequent graphs, a malignancy index greater than 0 suggests malignancy (with higher values indicating a higher probability of malignancy) and a malignancy score of 0 or less suggests benignity. The value obtained at x = 0 is the malignancy index defined for the vessels lying within the tumor margin. Subsequent values of x provide values obtained within 10 sets of hollow shells at progressive distance from the tumor surface, with the final shell located 8 cm from the tumor surface.
Figure 6.

Vessel tortuosity abnormalities in untreated glioblastoma.
As illustrated by Figure 6, all tumors showed significant tortuosity abnormalities for those vessels contained within the apparent tumor margins. How far distantly these shape abnormalities extended outside the glioblastoma’s enhancing rim was variable, and ranged from a few millimeters to over 3 centimeters. There was no obvious correlation of tumor volume with the distance from the enhancing rim over which vessel abnormalities occurred.
Vessel density measurement as determined by the TBC was also variable in this group of untreated tumors. While most tumors were hypervascular, others fell well within the nor-movascular range. These differences were likely caused by variability in the tumor volume occupied by necrosis.
Figure 7 provides a similar graph of a different patient with an untreated glioma grade III. The program defined the tumor as marginally malignant on the basis of the vessels inside the apparent tumor confines. The malignancy score was lower than that of any of the untreated glioblastomas and the vessel shape changes were confined to the tumor volume defined from MR without extension into the surrounding tissue.
Figure 7.
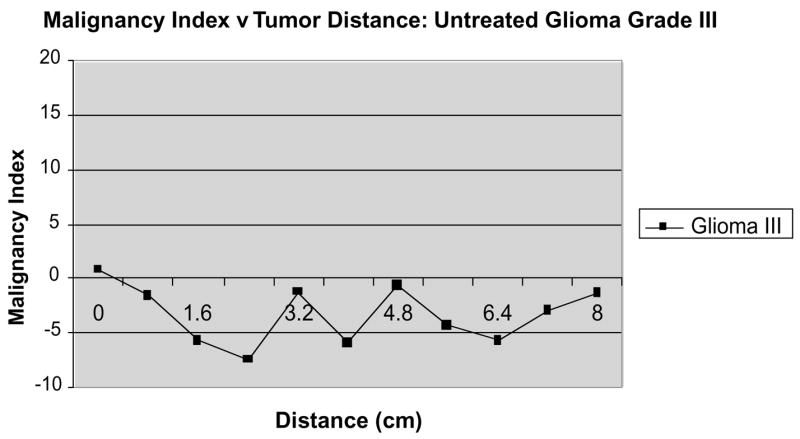
Tortuosity abnormalities in an untreated glioma grade III.
Figure 8 provides data for an individual with a GBM followed over time. The graph format is similar to that of Figures 6 and 7, but each curve represents a different time point during treatment of the same patient. This patient has done exceptionally well with therapy. The black curve with large squares indicates results following surgical resection and early during radiation therapy, at which time the patient was symptomatic and had neurological deficits. The vessel tortuosity abnormalities were severe and widespread at this time point, extending 5 cm from the tumor surface. The grey curve with small squares indicates results 7 months later, at which time the patient was still on chemotherapy. At that time he was neurologically intact without evidence of recurrence on MR. The vessel shape measures showed normalization. The white curve resulted from a study three months later, at which time the patient remained neurologically intact with no evidence of recurrence by MR, and was off all therapy. The graph indicates further normalization of vessel shape. The patient remains neurologically intact and asymptomatic off all therapy two months later.
Figure 8.

Progressive resolution of abnormal vessel tortuosity patterns in a GBM patient undergoing successful therapy.
Figure 9 illustrates results for a grade III glioma patient who also responded well to therapy. At the time the scan was obtained, she was being treated with anti-angiogenic agents and was felt to have stable disease. Her measures of vessel shape fell well into normal range for all parts of the brain examined.
Figure 9.

Vessel shape was within normal range in this glioma III patient responsive to treatment.
When a tumor recurs after initially successful treatment vessel shape abnormalities also recur, although these abnormalities may be less marked than those evident prior to whole-brain irradiation and chemotherapy. Figure 10 provides a graph for two GBM patients who underwent resection of a recurrent tumor following initially successful therapy with whole-brain radiation and chemotherapy. In the first patient, vessel shape abnormalities were present not only within the tumor boundaries (as defined from MR) but also in a second region several centimeters away. We do not have biopsy results for this second region. The second patient similarly possessed mild vessel shape abnormalities within the tumor as defined from MR, but with extension of these abnormalities for 2 cm from the apparent tumor surface.
Figure 10.

Vessel shape measures were abnormal with recurrent glioblastoma.
Discussion
Many pathological states affect vessel density and/or morphology, making the use of vessel attributes an appealing means of assessing disease quantitatively and noninvasively. MR perfusion imaging is a well-established technique that measures vessel density primarily at the capillary level. Additional valuable information may be provided by the larger vessels discriminable by MRA, however. Kozinska and colleagues, for example, found that larger multiple sclerosis plaques tend to be located farther from vessels than smaller plaques (23).
The current report employs vessels segmented from high-resolution MRA and describes the use of quantitative measures of vessel tortuosity in determining the level of activity of known malignant gliomas before and during treatment. Abnormal vessel tortuosity has been described in association with a wide variety of malignancies including those of the breast (24), brain (25), colon (26), and lung (27). The shape change is distinctive, may be related to production of VegF (8), and consists of “…a profound sort of tortuosity, with many smaller bends upon each larger bend” (7). By histological section, successful treatment of the underlying tumor results in rapid normalization of these abnormalities (10, 28). Importantly for the purpose of visualization by clinical MR, the shape abnormalities occur not only within the tiny vessels comprising the capillary bed but also within the much larger, initially normal vessels that course in the vicinity of the tumor (10). Indeed, such vessels both dilate and develop abnormal tortuosity patterns well before the appearance of vascular sprouting (10), making the approach potentially appealing for the early detection of cancer or for detecting early recurrence following therapy.
Although abnormalities of vessel shape have frequently been associated with malignancy by histological examination, vessel shape measures defined from in vivo medical images have not generally been used for tumor staging. Abnormal vessel tortuosity in association with cancer has indeed been noted on x-ray angiography (29), but the perception of three-dimensional abnormalities on flat, projection images containing significant projection overlap is difficult, and current 3D reconstruction methods often miss the smaller vessels. By MR, complex shapes are difficult to perceive on a slice by slice basis, and the noise inherent to maximum intensity projections makes it difficult to discern small vessels in the vicinity of a tumor. Moreover, the quantitative definition of tortuosity requires explicit definition of vessels from the input image, and methods capable of defining small, faint vessels from noisy image data have become available only recently.
We believe that an analysis of vessel shape may have value both in distinguishing benign from malignant tumors and in assessing the efficacy of cancer treatment early during drug administration. An earlier, blinded study successfully separated benign from malignant tumors in 21/21 cases prior to total gross resection (6). The current report assesses the potential value of the method in monitoring the treatment of malignant gliomas. Although the number of cases is small, all 10 malignant gliomas examined prior to treatment were associated with abnormalities of vessel shape, both of the two patients responsive to therapy showed resolution of shape abnormalities, and the two patients with biopsy-proven, known tumor recurrence exhibited vessel abnormalities indicative of malignancy.
Figure 8, which shows progressive resolution of vessel abnormalities during effective therapy in a single patient, is particularly instructive. The tortuosity and malignancy index scores are quantitative. By sequential examination of vessels in the same region over time, one obtains a quantitative, noninvasive measure of how well the treatment is proceeding. How soon the vessel shape abnormalities perceptible by MR recur when the tumor itself begins to regrow is unknown, but both patients with quiescent disease as indicated by the computerized analysis have remained in remission two months after the study. Our preliminary results also suggest that the vessel shape changes associated with tumor recurrence may be less marked than those associated with untreated tumors. It therefore may be useful to follow individual patients over time in order to best interpret the more subtle abnormalities associated with tumor recurrence.
This study includes one untreated glioma grade III, which is a malignant tumor, although less malignant than glioma grade IV (GBM). Grade III gliomas are not associated with marked angiogenesis (25). Our vessel density measurements as determined by TBC are in agreement with the histological diagnosis, and indicate a normovascular pattern. The tortuosity measurements were marginally abnormal, and were less abnormal than those of the glioblastomas. Further cases are required to determine the ability of the approach to distinguish gliomas by grade. However, we believe that the proposed approach will prove complementary to those based purely on vessel density measurements, since vessel shape abnormalities associated with malignancy exist in the absence of dense capillary sprouting (10).
This report also examines the distance from the tumor surface over which vessel shape abnormalities occur. Highly malignant tumors, such as glioblastomas, tend to show vessel abnormalities many millimeters (and often centimeters) away from the tumor surface as defined from MR, although the grade III glioma did not. Since these areas were not biopsied, we cannot confirm the analysis provided by the computer program. Whole-brain sections in animal models will be required to evaluate the computer analysis of these peripheral regions.
A disadvantage of the proposed approach is that it requires high-resolution, high-quality images that display small vessels. We are capable of distinguishing tortuosity abnormalities on MR scans obtained at 0.5 × 0.5 × 0.8 mm3, but cannot do so reliably with scans obtained at 0.8 × 0.8 × 1.0 mm3. Extension of the method to anatomical regions such as the lung is thus likely to require imaging techniques adapted to prevent blurring of vessels by respiratory motion.
The registration methods employed in this report were based upon alignment of soft tissues and upon affine transformations. This is not the optimal means of aligning vessels, and a fully-deformable, vessel-based method of image registration would be preferable. Our group is currently working on this area of research (30–33). We expect that with improvement of the registration methods our results should be even more clear cut.
In summary, this report describes a new, noninvasive, quantitative method of assessing malignancy and of monitoring the treatment response of malignant gliomas. On theoretical grounds, the method should be sensitive to changes in tumor state and is likely to be independent of vessel density measurements. Although much further work is required, preliminary results are promising.
Acknowledgments
Supported by R01 EB000219 NIH-NIBIB.
References
- 1.Law M, Yang S, Wang H, Babb JS, Johnson G, Cha S, Knopp EA, Zagzag D. Glioma Grading: Sensitivity, Specificity, and Predictive Values of Perfusion MR Imaging and Proton MR Spectroscopic Imaging Compared with Conventional MR Imaging. AJNR. 2003;24:1989–1998. [PMC free article] [PubMed] [Google Scholar]
- 2.Law M, Yang S, Babb JS, Knopp EA, Golfinos JG, Zagzag Dm Johnson G. Comparison of Cerebral Blood Volume and Vascular Permeability from Dynamic Susceptibility Contrast-Enhanced Perfusion MR Imaging with Glioma Grade. AJNR. 2004;25:746–755. [PMC free article] [PubMed] [Google Scholar]
- 3.Benard F, Romsa J, Hustinx R. Imaging Gliomas with Positron Emission Tomography and Single-photon Emission Computed Tomography. Seminars in Nuclear Medicine. 2003;33:148–162. doi: 10.1053/snuc.2003.127304. [DOI] [PubMed] [Google Scholar]
- 4.Ricci P. Differentiating Recurrent Tumor from Radiation Necrosis With 18FDG-PET: Time for Reevaluation?. Proceedings of the 34th Annual Meeting of the American Society of Neuroradiology; Seattle, Washington. 1996. [Google Scholar]
- 5.Bullitt E, Gerig G, Aylward S, Joshi S, Smith K, Ewend M, Lin W. Vascular Attributes and Malignant Brain Tumors. Lecture Notes in Computer Science. 2003;2878:671–679. [Google Scholar]
- 6.Bullitt E, Jung I, Muller K, Gerig G, Aylward S, Joshi S, Smith K, Ewend M. Determining Malignancy of Brain Tumors by Analysis of Vessel Shape. MICCAI 2004. Lecture Notes in Computer Science. 2004;3217:645–653. [Google Scholar]
- 7.Baish JS, Jain RK. Fractals and Cancer. Cancer Research. 2000;60:3683–3688. [PubMed] [Google Scholar]
- 8.Folkman J. Incipient Angiogenesis. Journal of the National Cancer Institute. 2000;92:94–95. doi: 10.1093/jnci/92.2.94. [DOI] [PubMed] [Google Scholar]
- 9.Sabo E, Boltenko A, Sova Y, Stein A, Kleinhaus S, Resnick MB. Microscopic Analysis and Significance of Vascular Architectural Complexity in Renal Cell Carcinoma. Clinical Cancer Research. 2001;7:533–537. [PubMed] [Google Scholar]
- 10.Li CH, Shan S, Huang Q, Braun R, Lanzen J, Hu K, Lin P, Dewhirst M. Initial Stages of Tumor Cell-induced Angiogenesis: Evaluation Via Skin Window Chambers in Rodent Models. J Natl Cancer Inst. 2000;92:143–147. doi: 10.1093/jnci/92.2.143. [DOI] [PubMed] [Google Scholar]
- 11.Bullitt E, Gerig G, Pizer S, Aylward SR. Measuring Tortuosity of the Intracerebral Vasculature from MRA Images. IEEE-TMI. 2003;22:1163–1171. doi: 10.1109/TMI.2003.816964. [DOI] [PMC free article] [PubMed] [Google Scholar]
- 12.Aylward S, Bullitt E. Initialization, Noise, Singularities and Scale in Height Ridge Traversal for Tubular Object Centerline Extraction. IEEE-TMI. 2002;21:61–75. doi: 10.1109/42.993126. [DOI] [PubMed] [Google Scholar]
- 13.Bullitt E, Aylward S, Smith K, Mukherji S, Jiroutek M, Muller K. Symbolic Description of Intracerebral Vessels Segmented from MRA and Evaluation by Comparison with X-Ray Angiograms. Medical Image Analysis. 2001;5:157–169. doi: 10.1016/s1361-8415(01)00037-8. [DOI] [PubMed] [Google Scholar]
- 14.Prastawa M, Bullitt E, Moon N, Van Leemput K, Gerig G. Automatic Brain Tumor Segmentation by Subject Specific Modification of Atlas Priors. Acad Radiol. 2003;10:1341–1348. doi: 10.1016/s1076-6332(03)00506-3. [DOI] [PMC free article] [PubMed] [Google Scholar]
- 15.Prastawa M, Bullitt E, Ho S, Gerig G. Robust Estimation for Brain Tumor Segmentation. MICCAI 2003. Lecture Notes in Computer Science. 2003;2878:530–537. [Google Scholar]
- 16.Rueckert D. Rview. 2002 Available: www.doc.ic.ac.uk/~dr/software.
- 17.Schnabel JA, Rueckert D, Quist M, Blackall JM, Castellano Smith AD, Hartkens T, Penney GP, Hall WA, Liu H, Truwit CL, Gerritsen FA, Hill DLG, Hawkes JD. A Generic Framework for Non-rigid Registration Based on Non-uniform Multi-level Free-form Deformations. Lecture Notes in Computer Science. 2001;2208:573–581. [Google Scholar]
- 18.ICBM Atlas. McConnell Brain Imaging Centre, Montréal Neurological Institute, McGill University; Montréal, Canada: [Google Scholar]
- 19.Koenderink JJ. Solid Shape. Cambridge Mass: MIT Press; 1993. pp. 167–194. [Google Scholar]
- 20.Bullitt E, Muller K, Jung I, Lin W. Aylward Analyzing Attributes of Vessel Populations. MedIA. 2004 doi: 10.1016/j.media.2004.06.024. In press. [DOI] [PMC free article] [PubMed] [Google Scholar]
- 21.Westphal M, Giese A. Local Control of Gliomas: The Next Best Step – A Good Step? Controversies in Neuro-Oncology. Front Radiat Ther Oncol. 1999;33:214–226. doi: 10.1159/000061237. [DOI] [PubMed] [Google Scholar]
- 22.Kristin R, Swansona B, Carly Bridgea JD, Murray B, Ellsworth C, Alvord Virtual and Real Brain Tumors: Using Mathematical Modeling to Quantify Glioma Growth and Invasion. Journal of the Neurological Sciences. 2003;216:1–10. doi: 10.1016/j.jns.2003.06.001. [DOI] [PubMed] [Google Scholar]
- 23.Kozinska D, Holland CM, Krissian K, Westin CF, Guttmann CRG. A Method for the Analysis of the Geometrical Relationship Between White Matter Pathology and the Vascular Architecture of the Brain. NeuroImage. 2004;22:1671–1678. doi: 10.1016/j.neuroimage.2004.04.014. [DOI] [PubMed] [Google Scholar]
- 24.Lau DH, Xue L, Young LJ, Burke PA, Cheung AT. Paclitaxel (Taxol): An Inhibitor of Angiogenesis in a Highly Vascularized Transgenic Breast Cancer. Cancer Biother Radiopharm. 1999;14:31–36. doi: 10.1089/cbr.1999.14.31. [DOI] [PubMed] [Google Scholar]
- 25.Burger PC, Scheithauer BW, Vogel FS. Surgical Pathology of the Nervous System and its Coverings. 3. Churchill Livingstone; New York: 1991. [Google Scholar]
- 26.Siemann D. Vascular Targeting Agents. Horizons in Cancer Therapeutics. 2002;3:4–15. [Google Scholar]
- 27.Helmlinger G, Sckell A, Dellian M, Forbes NS, Jain RK. Acid Production in Glycolysis-impaired Tumors Provides New Insights into Tumor Metabolism. Clinical Cancer Research. 2002;8:1284–1291. [PubMed] [Google Scholar]
- 28.Jain RK. Normalizing Tumor Vasculature with Anti-angiogenic Therapy: A New Paradigm for Combination Therapy. Nature Medicine. 2001;7:987–998. doi: 10.1038/nm0901-987. [DOI] [PubMed] [Google Scholar]
- 29.Scatliff JH, Radcliffe WB, Pittman HH, Park CH. Vascular Structure of Glioblastomas. Am J Roent Rad Ther Nuc Med. 1969;105:795–804. doi: 10.2214/ajr.105.4.795. [DOI] [PubMed] [Google Scholar]
- 30.Aylward SR, Jomier J, Weeks S, Bullitt E. Registration and Analysis of Vascular Images. International Journal of Computer Vision. 2003;55:123–138. [Google Scholar]
- 31.Chillet D, Jomier J, Cool D, Aylward S. Vascular Atlas Formation Using a Vessel-to-image Affine Registration Method. MIC-CAI 2003. Lecture Notes in Computer Science. 2003;2878:335–342. [Google Scholar]
- 32.Cool D, Chillet D, Kim J, Guyon JP, Foskey M, Aylward S. Tissue-based Affine Registration of Brain Images to Form a Vascular Density Atlas. MICCAI 2003, Lecture Notes in Computer Science. 2003;2879:9–15. [Google Scholar]
- 33.Jomier J, Aylward S. Rigid and Deformable Vasculature-to-Image Registration: A Hierarchical Approach. MICCAI 2004; Lecture Notes in Computer Science. 2004;3216:821–828. [Google Scholar]