

Abstract
Validation and method of comparison for segmentation of magnetic resonance images (MRI) presenting pathology is a challenging task due to the lack of reliable ground truth. We propose a new method for generating synthetic multi-modal 3D brain MRI with tumor and edema, along with the ground truth. Tumor mass effect is modeled using a biomechanical model, while tumor and edema infiltration is modeled as a reaction-diffusion process that is guided by a modified diffusion tensor MRI. We propose the use of warping and geodesic interpolation on the diffusion tensors to simulate the displacement and the destruction of the white matter fibers. We also model the process where the contrast agent tends to accumulate in cortical csf regions and active tumor regions to obtain contrast enhanced T1w MR image that appear realistic. The result is simulated multi-modal MRI with ground truth available as sets of probability maps. The system will be able to generate large sets of simulation images with tumors of varying size, shape and location, and will additionally generate infiltrated and deformed healthy tissue probabilities.
1 Introduction
The segmentation of brain tumor from magnetic resonance (MR) images is a vital process for treatment planning and for studying the differences of healthy subjects and subjects with tumor. The process of automatically extracting tumor from MR images is a challenging process, and a variety of methods have been proposed [1,2,3]. The typical standard for validation of the different segmentation methods is comparison against the results of manual raters. However, manual segmentation suffers from the lack of reliability and reproducibility, and different sites may have different methods for manually outlining tumors in MRI. The true ground truth may need to be estimated from a collection of manual segmentations [4]. Validation of the segmentation of structures other than brain tumor is typically not done since manual segmentation of edema or of the whole brain are very challenging tasks and might not represent truth very well.
Brain MRI with tumor is difficult to segment due to a combination of the following factors:
The deformation of non-tumor structures due to tumor mass effect.
Infiltration of brain tissue by tumor and edema (swelling). Edema appears around the tumor mainly in white matter regions.
There is gradual transition from tumor to edema, often it is difficult to discern the boundary between the two structures.
The standard MR modality used to identify tumor, T1w with contrast enhancement (typically using gadolinium), is not always ideal. Blood vessels and cortical cerebrospinal fluid (csf) tend to be highlighted along with tumor, while parts of tumor that are necrotic tissue do not appear enhanced at all. It is generally impossible to segment tumor by simply thresholding the contrast enhanced T1w image.
Rexilius et al.[5] proposed a framework for generating digital brain phantoms with tumor. They used a biomechanical finite element model to simulate the tumor mass effect. The phantom for a healthy subject is deformed and a tumor structure from a real subject is inserted to the MRI. Their model for edema is computed from the distances to the tumor boundary and the white matter mask. This is insufficient to simulate some real infiltration properties because infiltration is not only influenced by distance to tumor. Typically, edema infiltration occurs following the white matter fibers. Their framework only considers contrast enhancement inside tumors, without enhancement of vessels and csf regions.
We propose a method for generating simulated brain tumor MRI which includes most of the difficulties encountered in real MR images. The MR images produced by the method presents the four challenges as listed above. Tumor mass effect is simulated using a biomechanical model. Infiltration of brain tissues by tumor and edema is simulated as a reaction-diffusion process that is guided by a modified diffusion tensor MR image (DT-MRI). We also simulate the process where the contrast agent accumulates in some fluid regions and outer tumor regions to generate contrast enhanced T1w MRI that reflect challenges encountered in real tumor MR images.
2 Method
The input for our method is a ground truth of a healthy subject, which is a set of spatial probabilities for white matter, gray matter, and csf as shown in Figure 1. We generate new spatial probabilities for tumor and edema, and modify the healthy probabilities to account for mass effect and infiltration. The new set of probabilities is used to simulate MR images given training data that is obtained from real brain MRI with tumors. The probability that a particular location contains contrast agent is computed to determine regions that appear highlighted in T1w MRI.
Fig. 1.
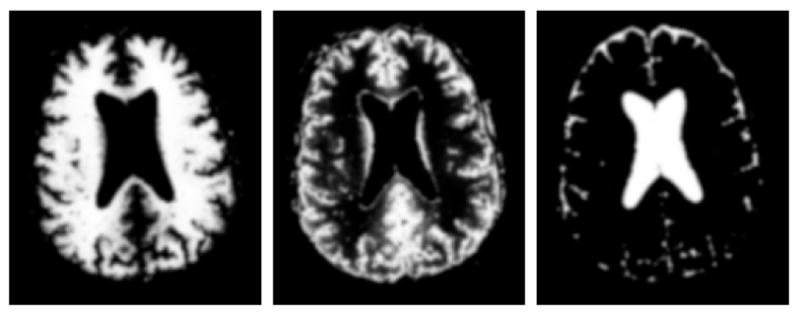
The input for our phantom generation framework: ground truth for a healthy subject. From left to right: axial view of the spatial probabilities for white matter, gray matter, and csf.
The brain tumor MRI simulation system includes the following steps:
Selection of a MRI of a healthy subject with probabilistic tissue segmentation. This provides the initial healthy ground truth that will be transformed into pathological ground truth.
Selection of a region for the initial tumor probability that describes the initial state of the tumor. Tumor growth is then simulated through deformation and infiltration.
Computation of a deformation field using a biomechanical model. The probabilistic maps and the DT-MRI are warped using the deformation.
Modification of the DT-MRI to account for destruction of white matter fibers.
Simulation of tumor and edema infiltration using the modified DT-MRI.
Simulation of the process of accumulation of contrast agent in fluid and tumor regions.
Generation of multi-modal MRI given the final healthy tissue, tumor, and edema probability maps.
2.1 Tumor Mass Effect
Given an initial tumor region that is obtained through user interaction, the growth of the tumor is modeled as a deformation process. The initial tumor region can also be automatically drawn at random given some prior knowledge of the spatial distribution. Meningiomas, for example, often appear near the brain periphery. The initial tumor region can have arbitrary shape and influences the resulting deformation. In the initial tumor region, the tumor probabilities are set to be one, ptumor(x) = 1 and tissue or fluid probabilities are set to be zero. The set of spatial probabilities, with the addition of the new spatial tumor probability are deformed according to a biomechanical model.
We have chosen to use the linear elastic finite element model used in [6,5]. The external force for the system is a radial force that originates from the initial tumor region, and this force weakens by distance.
2.2 Tumor and Edema Infiltration
We use the registered and reoriented DT-MRI to simulate the tissue infiltration process, similar to the approach done by Clatz et al.[7]. However, registration and reorientation are generally insufficient to account for the mass effect. White matter fibers around tumor tend to be displaced, and as observed by Lu et al.[8], in regions near the tumor the mean diffusivity (MD) tends to be increased while the fractional anisotropy (FA) tends to be decreased. This effect can be seen as a reflection of the destruction of white matter fibers due to tumor growth.
The influence of tumor mass effect on DT-MRI is modeled using a combination of image warping and non-linear interpolation. The DT-MRI is warped following the strategy described in [9], where a rigid rotation is applied to each individual tensors. The rigid rotation for each tensor is computed based on the local warping property. The destruction of white matter fibers is simulated by interpolating each individual tensor with an isotropic tensor that has higher mean diffusivity. Figure 2 shows the registered DT-MRI before and after the modification that models the influence of tumors.
Fig. 2.
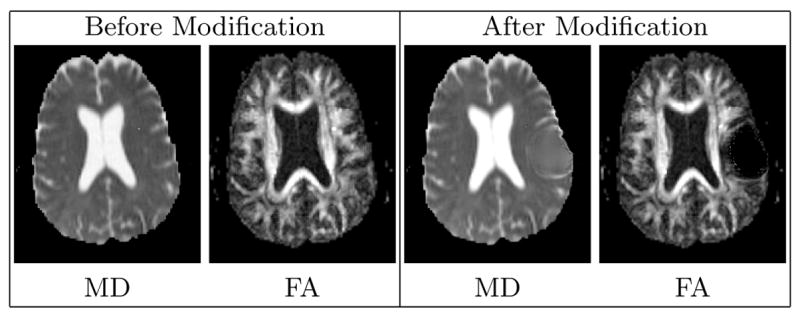
Visualization of the diffusion tensor MRI through the axial views of the 3D Mean Diffusivity (MD) and Fractional Anisotropy (FA) images. The modified DT-MRI has higher MD and lower FA in the regions surrounding tumor, which models the destruction of the fibers. The MD image shows that the ventricle near the tumor is slightly deformed. The FA image shows that the white matter fibers near the tumor region are pushed away.
The interpolation between a warped tensor D and its isotropic version E is calculated using the geodesic interpolation strategy proposed by Fletcher et al.[10]. The isotropic tensor E is formulated to have two times the determinant value of D, . The weight α for the interpolation between D and E is inversely proportional to the amount of deformation. We use where K(x) = max(1, |J(x)|) − 1 with J being the Jacobian matrix of the spatial coordinate mapping function and σK is the rough estimate of the amount of deformation that destroys fibers. The modified tensor we use for computing infiltration is D′(x) = interpolate(D(x) : α, E(x) : (1 − α)). With our formulation of α, volume expansion destroys fibers while volume compression does not change the original tensors. This is done because we observed that in real tumor DT-MRI some fibers can appear condensed without being destroyed.
The spatial probability that a particular location is infiltrated by pathological cells, pinfiltrated = ϕ, is evolved using the modified DT-MRI as follows:
The first term is the DT-MRI guided diffusion, with an additional parameter a that depends on the tissue type. White matter is more likely to diffuse than white matter, while csf is not likely to be infiltrated at all. The second term is the growth term, with b being a constant. The diffusion tensors D′ are normalized so that the trace of the tensors is within the range of [0, 1]. The initial values for ϕ is chosen to be higher for regions with high tumor and white matter probability, ϕ(x, t = 0) = pwhite(x) ptumor(x). The evolution is stopped when the volume of infiltrated brain voxels is higher than a fraction of the brain tissue volume.
Tumor may not only deform tissue, but also infiltrate nearby tissue. We model this by attributing the early stages of infiltration to tumor and the later stages to edema. The probability of infiltrated tumor or edema is the probability that a location is both infiltrated and part of brain tissue. More precisely, ptumor(x) = pwarped tumor + ϕ(x, tearly) ptissue(x) and pedema(x) = (ϕ(x, tfinal) − ϕ(x, tearly)) ptissue(x). The probability of observing brain tissue is ptissue(x) = pwhite(x) + pgray(x). The value tfinal is the time where evolution stops, and tearly is a time value earlier in the process, tearly < tfinal. The choice for the value of tearly depends on the type of tumor being modeled. For example, meningiomas tend to have less tumor infiltration compared to glioblastomas.
2.3 Generation of MR Image Intensities
One of the particular challenges in segmenting brain tumor from MRI is the inconsistencies in the contrast enhanced T1w image. Due to the biological process, the contrast agent is almost always accumulated in regions other than tumor, mainly in the cortical csf and the blood vessels. Additionally, the necrotic parts of the tumor do not accumulate the contrast agent at all. Tumor necrosis are typically found in the core tumor regions.
Our method models the accumulation of the contrast agent in the active tumor tissue and the cortical csf in order to generate more challenging images. The spatial probability for the accumulation of contrast agent, pacc = η is evolved using the following reaction diffusion equation:
where v and w are constants and I is the indicator function. The value of u depends on the tissue type at location x, contrast agent is modeled to be more likely to spread in csf than in tumor tissue. Xsource and Xsink are the sets of points that act as sources or sinks respectively, the points are chosen at random. Locations with high csf probability and low distance to brain boundary are more likely to be source points. Within tumor, the outer regions are more likely to be source points while the core regions are more likely to be sink points. We initialize η so that the voxels in the source regions are equally likely to have accumulated contrast agent or to have no contrast agent at all, η(x, t = 0) = I{x ∈ Xsource} 0.5.
The probability that a voxel would appear highlighted in contrast enhanced T1w MRI is the probability that the voxel is csf or tumor and has accumulated contrast agent, penhanced(x) = pacc (pcsf (x) + ptumor(x)). Figure 3 shows the generated enhancement probabilities. Our model accounts for the fact that cortical csf and active tumor regions are highlighted and that necrosis regions are not enhanced. However, it does not account for the fact that blood vessels can also appear enhanced.
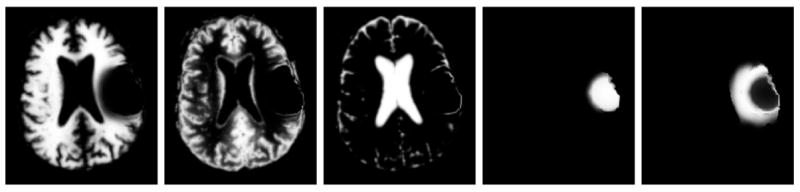
Fig. 3.
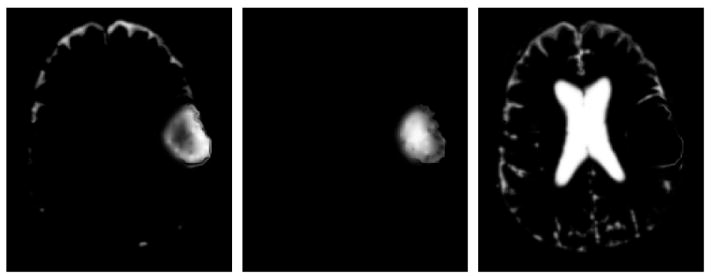
Axial view of the generated probabilities related to contrast enhancement. From left to right: probability for highlighted csf or tumor, probability for non-highlighted tumor, and probability for non-highlighted csf.
Given the modified spatial probabilities of the healthy ground truth, the MR images are generated as linear combinations of a set of mean intensities for each class:
where m is the modality, Nm is the number of classes, Ci is one of the classes used for that modality, and μi is the mean intensity for class Ci. The mean class intensities are obtained from real brain tumor MRI. For T1w and T2w images, the set of classes C is composed of white matter, gray matter, csf, tumor, and edema. For the contrast enhanced T1w image, the set of classes C is composed of white matter, gray matter, non-enhancing csf, non-enhancing tumor, edema, and the class for all contrast enhanced voxels.
3 Results
The synthetic brain tumor MRI is shown together with an example of a real brain tumor MRI in Figure 4. In both cases, tumor deforms other structures and edema infiltrates brain tissue. The contrast enhanced T1w MR images also show complex highlight patterns. Figure 5 shows the ground truth for the synthetic MRI. Ground truth is presented as a set of probability maps for tissue and pathology, similar to the one provided by BrainWeb [11] for healthy subjects. This has significant advantage over binarization since validation can use probabilistic statistical analysis rather than simple volume comparison.
Fig. 4.
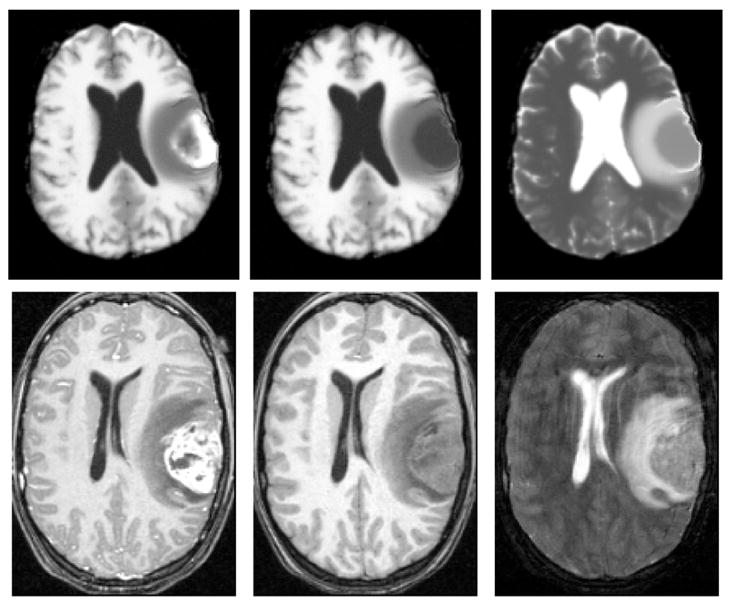
The synthetic MR images compared to real MR images of a subject with meningioma and surrounding edema. Top: axial view of the synthetic MR images generated using our method. Bottom: axial view of real MR images. From left to right: contrast enhanced T1w, T1w, and T2w images.
Fig. 5.
Axial view of the ground truth for the synthetic MR images. From left to right: the class probabilities for white matter, gray matter, csf, tumor, and edema.
4 Discussion and Conclusion
We have presented a method for generating synthetic multi-modal MR images with brain tumors that present similar difficulties as real brain tumor MR images. Using sets of such images with variations of tumor size, location, extent of surrounding edema, and enhancing regions, segmentation methods can be tested on images that include most of the challenges for segmentation. The synthetic MRI and the ground truth allows for the validation of the segmentation of the whole brain, which includes white matter, gray matter, csf, tumor, and edema. This capability is novel as most validations done so far were focused on tumor only but not on infiltrated tissue and on deformed healthy tissue.
A possible extension to the method we proposed is the inclusion of vessel information to determine additional regions where contrast agent tend to accumulate. Blood vessel information can also be combined together with deformation and infiltration to generate more precise simulation of the tumor growth and the development of necrosis. This could lead to development of a texture model for the tumor and edema regions.
It is important to note that our goal is to generate sufficiently realistic MR images that are difficult to segment. The accurate modeling of tumor and edema growth is beyond the scope of our current work. Such an effort would require the modeling of the complex interactions between the deformation process, the infiltration process, and the development of blood vessels [12]. Here, we focus on the generation of test images that empirically simulate pathology as seen in real images, with the main purpose to use simulated images and ground truth for validation and cross-comparison.
The method presented here may also be applied for multi-focal lesions, for example in cases of vascular strokes or multiples sclerosis. Such cases generally present multiple regions with small scale local deformation and tissue infiltration, which can be generated using our framework.
Footnotes
This work was supported by NIH-NIBIB R01 EB000219.
References
- 1.Clark MC, Hall LO, Goldgof DB, Velthuizen R, Murtagh FR, Silbiger M. Automatic tumor-segmentation using knowledge-based techniques. IEEE TMI. 1998;117:187–201. doi: 10.1109/42.700731. [DOI] [PubMed] [Google Scholar]
- 2.Kaus M, Warfield S, Nabavi A, Black PM, Jolesz FA, Kikinis R. Automated segmentation of mr images of brain tumors. Radiology. 2001;218:586–591. doi: 10.1148/radiology.218.2.r01fe44586. [DOI] [PubMed] [Google Scholar]
- 3.Prastawa M, Bullitt E, Ho S, Gerig G. A brain tumor segmentation framework based on outlier detection. MedIA. 2004;8:275–283. doi: 10.1016/j.media.2004.06.007. [DOI] [PubMed] [Google Scholar]
- 4.Warfield SK, Zou KH, Wells WM. Simultaneous truth and performance level estimation (STAPLE): an algorithm for the validation of image segmentation. IEEE TMI. 2004;23:903–921. doi: 10.1109/TMI.2004.828354. [DOI] [PMC free article] [PubMed] [Google Scholar]
- 5.Rexilius J, Hahn HK, Schlüter M, Kohle S, Bourquain H, Böttcher J, Peitgen HO. A framework for the generation of realistic brain tumor phantoms and applications. Proc MICCAI 2004. 2004:243–250. LNCS 3217. [Google Scholar]
- 6.Ferrant M, Nabavi A, Macq B, Jolesz FA, Kikinis R, Warfield SK. Registration of 3D interoperative MR images of the brain using finite element biomechanical model. IEEE TMI. 2001;20:1384–1397. doi: 10.1109/42.974933. [DOI] [PubMed] [Google Scholar]
- 7.Clatz O, Bondiau PY, Hervé Delingette Grégoire Malandalin Maxme Sermesant SKW, Ayache N. In silico tumor growth: Application to glioblastomas. Proc MICCAI 2004 Volume LNCS. 2004;3217:337–345. [Google Scholar]
- 8.Lu S, Ahn D, Johnson G, Cha S. Peritumoral diffusion tensor imaging of high-grade gliomas and metastatic brain tumors. AJNR. 2003;24:937–941. [PMC free article] [PubMed] [Google Scholar]
- 9.Alexander DC, Pierpaoli C, Basser PJ, Gee JC. Spatial transformations of diffusion tensor magnetic resonance images. IEEE TMI. 2001;20:1131–1139. doi: 10.1109/42.963816. [DOI] [PubMed] [Google Scholar]
- 10.Fletcher PT, Joshi S. Principal geodesic analysis on symmetric spaces: Statistics of diffusion tensors. CVAMIA 2004. 2004:87–98. LNCS 3117. [Google Scholar]
- 11.Cocosco CA, Kollokian V, Kwan RS, Evans AC. BrainWeb: Online interface to a 3D MRI simulated brain database. Neuroimage. 1997;5 [Google Scholar]
- 12.Zheng X, Wise SM, Cristini V. Nonlinear simulation of tumor necrosis, neo-vascularization and tissue invasion via and adaptive finite-element/level-set method. Bulletin of Mathematical Biology. 2005;67:211–259. doi: 10.1016/j.bulm.2004.08.001. [DOI] [PubMed] [Google Scholar]