

Abstract
Background
A broad region on chromosome 4q was previously linked to the phenotype of alcohol dependence in the Collaborative Study on the Genetics of Alcoholism sample. A strong positional candidate gene was identified within this region: tachykinin receptor 3 gene (TACR3), which encodes tachykinin receptor 3 (NK3R), the receptor for the tachykinin 3 (neurokinin B) peptide. Pharmacological studies have provided evidence that the administration of NK3R agonists attenuates the intake of alcohol and NK3R can also mediate the acute and chronic behavioral effects of cocaine.
Methods
Thirty SNPs were genotyped throughout TACR3. Family based association analysis was performed in 219 European American families to detect an association with alcohol dependence. Subsequent analyses were performed to evaluate the evidence of association with other definitions of alcohol dependence as well as cocaine dependence.
Results
Seven of the 9 SNPs in the 3′ region of TACR3 provided significant evidence of association with alcohol dependence (p ≤ 0.05). Further analyses suggest that the evidence of association is strongest among those subjects with more severe alcohol dependence (defined by ICD-10) and those with co-morbid cocaine dependence. Haplotype analyses further strengthen the evidence of association in the 3′ region of the gene.
Conclusions
These results indicate that sequence variations in TACR3 contribute to the variation in more severe alcohol dependent individuals and those who are also cocaine dependent.
Keywords: Alcoholism, Association, Tachykinin Receptor 3 Gene, SNP, Family Study
Alcohol dependence is a common and debilitating disorder with a 12 month prevalence of 3.8%, which represents 7.9 million Americans (Grant et al., 2004). Genetic factors have been shown to play an important role in alcohol dependence (Cadoret et al., 1980; Cloninger et al., 1981; Goodwin, 1979; Heath et al., 1997; Kendler et al., 1994; Pickens et al., 1991). Several genes, including GABRA2, (Covault et al., 2004; Edenberg et al., 2004; Fehr et al., 2006; Lappalainen et al., 2005), ADH4 (Edenberg et al., 2006; Guindalini et al., 2005; Luo et al., 2005b) and CHRM2 (Luo et al., 2005a; Wang et al., 2004) have now been shown in multiple studies to be associated with alcohol dependence. Additional genes that are yet to be identified or replicated must also contribute to the risk of disease.
The Collaborative Study on the Genetics of Alcoholism (COGA) has collected multiplex, alcohol dependent families in order to maximize the ability to detect genes contributing to the risk of alcoholism. Genome wide analysis demonstrated linkage to chromosome 4q (Reich et al., 1998; Williams et al., 1999). The linked region was relatively large, encompassing about 50 cm, and therefore it was hypothesized that multiple genes within this chromosomal region might contribute to the risk of alcohol dependence. We have already reported that ADH4, which is located within this linked chromosomal region, is associated with alcoholism in the COGA sample (Edenberg et al., 2006). Another gene, SNCA, was found to be associated with the craving for alcohol but was not associated with alcohol dependence itself (Foroud et al., 2007). Association studies of additional candidate genes within this region of chromosome 4q have continued.
A potential positional candidate gene within the linked region on chromosome 4q25 is TACR3, which encodes the tachykinin receptor 3, receptor for the tachykinin 3 (neurokinin B) peptide. TACR3 belongs to a family of genes that encodes proteins that function as receptors for tachykinins (reviewed in Page, 2005). There are 5 known mammalian tachykinins: substance P, neurokinin A, neurokinin B, neuropeptide K and neuropeptide γ. All have a common C-terminal sequence Phe-X-Gly-Leu-Met-NH2; their affinities for receptors are based on differences at the amino terminal end. There are 3 distinct G protein-coupled receptors which bind to the tachykinins: NK1R, NK2R, and NK3R; their endogenous ligands are substance P, neurokinin A, and neurokinin B, respectively. NK1R and NK3R are both widely distributed in the brain. Neurokinin B preferentially binds to the tachykinin 3 receptor (NK3R).
Pharmacological studies have provided evidence that the administration of NK3R receptor agonists attenuates the intake of alcohol and can also mediate the acute and chronic behavioral effects of cocaine. Studies in the Sardinian preferring and nonpreferring rats found that administration of senktide, a selective NK3R agonist, inhibited alcohol intake, without affecting overall water or food intake (Ciccocioppo et al., 1994, 1995). It was hypothesized from these studies as well as others that the NK3R agonist acts to reduce ethanol consumption by replacing the rewarding properties of alcohol (Massi et al., 2000). Studies in Wistar rats have also shown that administration of an NK3R agonist blocked the acute locomotor stimulant effects of cocaine (Jocham et al., 2006). In these animals, the agonist also potentiated the cocaine-induced increase in dopamine levels in the nucleus accumbens core but did not have this effect in the nucleus accumbens shell (Jocham et al., 2006). However, species differences have been found between the rat and mouse NK3R and the human NK3R. Studies in marmoset monkeys have provided evidence that administration of an NK3R agonist, senktide, enhanced the effects of cocaine on locomotor activity, but reduced other cocaine-influenced behaviors such as exploratory activity and terrestrial glance behavior (De Souza Silva et al., 2006b). In contrast, pretreatment with a NK3R antagonist, SR142801, enhanced the aversive behavioral effects of cocaine in the monkeys (De Souza Silva et al., 2006a).
Based on both the linkage evidence as well as the studies in animal models, we hypothesized that variation in TACR3 is associated with the susceptibility for alcohol dependence. To test this hypothesis, we genotyped SNPs throughout TACR3 and performed family based association analysis. After finding significant evidence of association using DSM-IV diagnostic criteria, we further characterized the evidence of association by examining the effects of alcohol dependence severity and cocaine dependence on this association.
METHODS
Sample
Multiplex alcohol dependent families were recruited by COGA, an ongoing multi-site study that has recruited families at 6 centers across the United States: Indiana University, State University of New York Downstate Medical Center, University of Connecticut, University of Iowa, University of California/San Diego, and Washington University, St. Louis. This study was approved by the institutional review boards of all participating institutions.
Alcohol dependent probands were identified through alcohol treatment programs. A poly-diagnostic interview instrument, the Semi-Structured Assessment for the Genetics of Alcoholism (SSAGA) (Bucholz et al., 1994; Hesselbrock et al., 1999), was administered to the proband and their family members (see Foroud et al., 2000, and Reich et al., 1998; for more details). A subset of families having at least 3 first degree relatives who met both lifetime DSM-IIIR criteria for alcohol dependence (American Psychiatric Association and Work Group to Revise DSM-III, 1987) and lifetime Feighner (Feighner et al., 1972) criteria for definite alcoholism, participated in the genetic phase of this study. Due to the known racial differences in SNP allele frequencies and patterns of linkage disequilibrium, the analytic sample was restricted to the 219 European American families (n = 1,923 genotyped individuals).
Phenotypes
Data from the SSAGA interview were used to classify subjects as alcohol dependent (Table 1); because the linkage in this chromosome 4 region was strongest for the diagnosis based on DSM-IV criteria (American Psychiatric Association and Task Force on DSM-IV, 2000), that was our primary diagnosis. A total of 753 subjects were defined as alcohol dependent and all others with SSAGA data were classified as unaffected (n = 1,047). Following initial evidence of association using the primary phenotype (DSM-IV alcohol dependence), secondary analyses were also performed using a narrower and broader definition of alcohol dependence. For the narrower disease phenotype, those participants meeting criteria for ICD-10 were considered as affected (n = 565; Table 1), and all others with SSAGA data were classified as unaffected (n = 1,235). For the broader phenotype, subjects meeting both DSM-IIIR criteria for alcohol dependence (American Psychiatric Association and Work Group to Revise DSM-III, 1987) and Feighner (Feighner et al., 1972) criteria for definite alcoholism were classified as meeting the COGA alcohol dependence phenotype (n = 884; Table 1; all others with a SSAGA were classified as unaffected (n = 916). The 123 individuals who provided a blood sample for DNA but did not have a completed SSAGA were classified as unknown for all models of alcohol dependence.
Table 1.
Phenotypic Characteristics of the Genotyped Individualsa
| Phenotypes | Male | Female | Total |
|---|---|---|---|
| Alcohol dependence | |||
| DSM-IV alcohol dependence | 499 | 254 | 753 |
| ICD-10 alcohol dependence (Narrow) | 389 | 176 | 565 |
| DSM-IIIR alcohol dependence + Feighner definite alcohol dependence (Broad) | 590 | 294 | 884 |
| Cocaine dependence | |||
| DSM-IIIR cocaine dependent | 161 | 94 | 255 |
| Comorbid | |||
| DSM-IV alcohol dependent + DSM-IIIR cocaine dependent | 142 | 66 | 208 |
| ICD-10 alcohol dependent + DSM-IIIR cocaine dependent | 126 | 57 | 183 |
There are 123 individuals, 64 males and 59 females, who have genotypic information but who did not complete a SSAGA and therefore are classified as unknown for all phenotypes being analyzed.
Given the evidence from animal studies described above, we hypothesized that variations in TACR3 could also affect cocaine dependence. However, having already identified an association with alcohol dependence, this required careful analysis to avoid confounding. Within the genotyped study sample were 255 subjects who met DSM-IIIR criteria for cocaine dependence (Table 1). Among these, 208 also met criteria for DSM-IV alcohol dependence (82%). However, 545 of the 753 DSM-IV alcohol dependent subjects (72.4%) did not meet criteria for DSM-IIIR cocaine dependence. Therefore, to explore whether the evidence of association of TACR3 with alcohol dependence was due to the inclusion of subjects with cocaine dependence, we performed 2 additional analyses. First, we repeated the family based association analysis classifying as affected only those subjects who met criteria for cocaine dependence without regard for alcoholism status (n = 255). All others with SSAGA data were classified as unaffected, including individuals with DSM-IV alcohol dependence who were not DSM-IIIR cocaine dependent. Second, we performed family based association analysis including as affected only those individuals who met criteria for DSM-IV alcohol dependence but who did not meet DSM-IIIR criteria for cocaine dependence. In this way, we could determine whether the observed association of TACR3 with alcohol dependence was due to the inclusion of subjects who were comorbid for cocaine dependence.
SNP Selection and Genotyping
Tachykinin receptor 3 gene spans 130 kb on chromosome 4q25 and contains 5 exons (Fig. 1A). SNPs distributed throughout the gene were selected from public databases, primarily dbSNP (http://www.ncbi.nlm.nih.gov/SNP/). Most SNPs were located in noncoding regions of the gene. Two known coding SNPs, rs2276973 in exon 3 and rs17033889 in exon 5, were also genotyped. The location of each SNP was determined from the annotations in the NCBI human genome assembly Build 36.1. At the time some SNPs were selected, allele frequencies were not available. To determine allele frequencies and to test the quality of the assays, SNPs were genotyped in 2 sets of samples, each consisting of 40 unrelated individuals from the Coriell European- and African-American diversity samples; only SNPs in Hardy Weinberg equilibrium in both test groups were genotyped on the COGA sample.
Fig. 1.
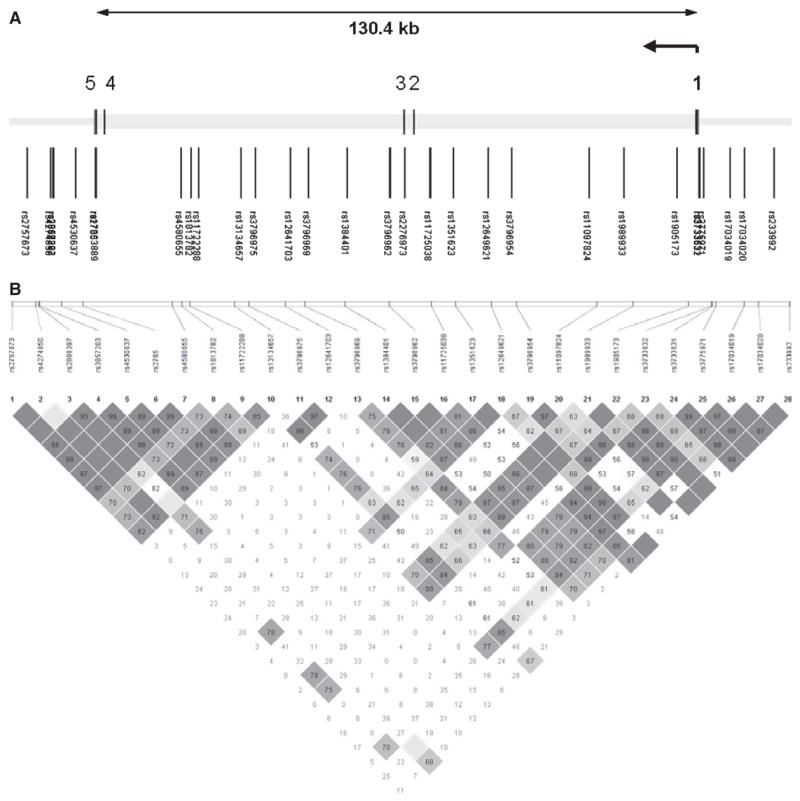
(A) Genomic structures of TACR3. The gene structure of TACR3 is based on transcript NM_001059. The direction of transcription and the exons are indicated by arrows and numerical numbers, respectively. The size of the gene is indicated in scale at the top of the figure. (B). Pairwise linkage disequilibrium. Pairwise linkage disequilibrium (D′) estimates among the genotyped SNPs. Darkly shaded boxes have strong evidence of linkage disequilibrium, defined as a pair of SNPs with the one-sided upper 95% confidence bound on D′ of 0.98 and the lower bound above 0.7. Lightly shaded boxes have lower linkage disequilibrium.
Genotyping of the 30 SNPs was done using a modified single nucleotide extension reaction with allele detection by mass spectrometry (Sequenom MassArray system; Sequenom, San Diego, CA). The assays were designed and run with either of 2 formats, hME™ or iPLEX™ (Sequenom, San Diego, CA). All SNP genotypes were checked for Mendelian inheritance using the program PEDCHECK (O’Connell and Weeks, 1998). Marker allele frequencies and heterozygosities were computed in the COGA sample using the program USERM13, part of the MENDEL linkage computer programs (Boehnke, 1991). No marker deviated significantly (p < 0.01) from Hardy Weinberg equilibrium.
Statistical Analyses
SNP coverage across TACR3 was evaluated using the program HAPLOVIEW (Barrett et al., 2005), which examined the extent of linkage disequilibrium (LD) between pairs of SNPs. The program Tagger (de Bakker et al., 2005) (http://www.broad.mit.edu/mpg/tagger) was used to estimate how well the SNPs genotyped in this study represented the genetic information contained in nongenotyped SNPs. Because 7 of the SNPs genotyped in this study were not in the HapMap database and therefore could not be evaluated by Tagger, this method underestimates the extent to which the genotyped SNPs in this study also carry information on the nongenotyped variation in the gene.
The Pedigree Disequilibrium Test (PDT) (Martin et al., 2000), as implemented in the program UNPHASED (Dudbridge, 2003), was used to test for association with alcohol dependence in the extended, multiplex COGA pedigrees. The PDT utilizes data from all available trios in a family, as well as from discordant sibships. Evidence for association is assessed based on: 1) the overtransmission of a particular allele to affected individuals; and 2) the greater frequency of the allele in affected individuals as compared to their unaffected siblings. Results from the “avg-PDT” statistic, which weighs each family equally in computing the overall test statistic (Martin et al., 2001), are reported. Due to the extremely limited power to detect association, 2 SNPs with very low MAF (rs17033889 and rs2276973) were not included in the family based association analyses.
In regions of TACR3 where association analyses with individual SNPs were significant, multi-SNP haplotypes were constructed to further analyze the evidence of association. Haplotypes were estimated using consecutive, overlapping sets of 3 adjacent SNPs (Edenberg et al., 2004). Due to the small sample size of the cocaine phenotype, missing genotypes were imputed employing the EM algorithm as per the missing option in UNPHASED. In each set of sliding windows, haplotypes having a frequency of at least 5% were used to test for association using the PDT and the global p-value is reported for each test of association. The haplotypes were then reviewed in each of the sequential sliding windows to determine whether significant association results were due to the overtransmission of a particular haplotype to affected individuals or to the differential transmission to siblings discordant for the phenotype.
RESULTS
Thirty SNPs were genotyped across the 130 kb region containing TACR3, extending more than 10 kb beyond the gene on both the 5′ and 3′ ends (Fig. 1A). Statistical analyses were not performed for the 2 exonic SNPs with very low minor allele frequency (rs17033889 and rs2276973; Table 2). Evaluation of the SNP positions (Fig. 1A) and the pairwise LD in our sample (Fig. 1B) indicated that the 28 SNPs we included in the statistical analyses adequately covered TACR3 and its flanking regions (mean max r2 = 0.87). To further evaluate the coverage of TACR3, we used the program Tagger (de Bakker et al., 2005) to calculate LD between the SNPs we genotyped and all 83 SNPs in the region that were analyzed by HapMap. Of the 28 SNPs analyzed, 25 were in the HapMap database and therefore could be evaluated. The average r2 of these 25 SNPs with all 83 known HapMap SNPs (MAF ≥ 0.1) in the region was 0.87; r2 was greater than 0.5 for 83% of the SNPs and greater than 0.8 for 80% of the SNPs. Given that we genotyped an additional 3 SNPs not in the HapMap database (and thus not incorporated into this calculation), our actual coverage was even better.
Table 2.
Association of TACR3 SNPs With Study Phenotypes
| Alcohol dependence
|
|||||||||
|---|---|---|---|---|---|---|---|---|---|
| SNP ID | Positiona | SNP locationb | MAFc | HWEd | DSM-IVe | ICD-10e | COGAe | DSM-IV Alc Dep no cocainee | DSM-IIIR cocainee,f |
| [1] rs2757673 | 104715499 | Downstream | 0.25 | 1.00 | 0.02 | 0.02 | 0.11 | 0.10 | 0.02 |
| [2] rs4274850 | 104720470 | Downstream | 0.19 | 0.87 | 0.05 | 0.01 | 0.05 | 0.05 | 0.11 |
| [3] rs2868397 | 104720987 | Downstream | 0.04 | 0.79 | 0.26 | 0.23 | 0.25 | 0.61 | 0.03 |
| [4] rs3857203 | 104721232 | Downstream | 0.35 | 0.55 | 0.04 | 0.04 | 0.16 | 0.11 | 0.01 |
| [5] rs4530637 | 104725838 | Downstream | 0.34 | 1.00 | 0.03 | 0.02 | 0.15 | 0.11 | 0.01 |
| [6] rs2765 | 104730215 | 3′UTR | 0.33 | 0.66 | 0.03 | 0.02 | 0.15 | 0.19 | 0.007 |
| rs17033889 | 104730341 | Exon 5, Thr449Ala | 0.01 | 1.00 | N/Ag | N/A | N/A | N/A | N/A |
| [7] rs4580655 | 104748723 | Intron 3 | 0.34 | 0.44 | 0.02 | 0.03 | 0.11 | 0.12 | 0.009 |
| [8] rs1813782 | 104750764 | Intron 3 | 0.37 | 0.79 | 0.81 | 0.46 | 0.95 | 0.63 | 0.04 |
| [9] rs11722288 | 104752399 | Intron 3 | 0.29 | 0.94 | 0.02 | 0.03 | 0.12 | 0.04 | 0.02 |
| [10] rs13134657 | 104761590 | Intron 3 | 0.11 | 0.64 | 0.31 | 0.70 | 0.93 | 0.56 | 0.35 |
| [11] rs3796975 | 104764604 | Intron 3 | 0.45 | 0.44 | 0.75 | 0.94 | 0.85 | 0.55 | 0.63 |
| [12] rs12641703 | 104772136 | Intron 3 | 0.49 | 0.87 | 0.20 | 0.46 | 0.66 | 0.19 | 0.51 |
| [13] rs3796969 | 104776115 | Intron 3 | 0.37 | 0.76 | 0.16 | 0.60 | 0.45 | 0.07 | 0.12 |
| [14] rs1384401 | 104784527 | Intron 3 | 0.35 | 0.05 | 0.90 | 0.57 | 0.62 | 0.47 | 0.02 |
| [15] rs3796962 | 104793714 | Intron 3 | 0.34 | 0.14 | 0.70 | 0.26 | 0.43 | 0.71 | 0.01 |
| rs2276973 | 104796831 | Exon 3, Arg286Lys | 0.00 | 1.00 | N/A | N/A | N/A | N/A | N/A |
| [16] rs11725038 | 104802382 | Intron 1 | 0.34 | 0.08 | 0.90 | 0.34 | 0.80 | 0.39 | 0.006 |
| [17] rs1351623 | 104807426 | Intron 1 | 0.17 | 0.24 | 0.18 | 0.92 | 0.92 | 0.21 | 0.12 |
| [18] rs12649621 | 104814831 | Intron 1 | 0.10 | 0.70 | 0.56 | 0.94 | 0.95 | 0.93 | 0.57 |
| [19] rs3796954 | 104820021 | Intron 1 | 0.13 | 0.02 | 0.43 | 0.65 | 0.92 | 0.40 | 0.76 |
| [20] rs11097824 | 104836637 | Intron 1 | 0.10 | 0.99 | 0.76 | 0.55 | 0.15 | 1.00 | 0.49 |
| [21] rs1989933 | 104844112 | Intron 1 | 0.10 | 0.68 | 0.53 | 0.92 | 0.91 | 0.89 | 0.57 |
| [22] rs1905173 | 104855551 | Intron 1 | 0.09 | 0.93 | 0.52 | 0.99 | 0.79 | 0.93 | 0.54 |
| [23] rs3733632 | 104860384 | 5′UTR | 0.20 | 0.02 | 0.23 | 0.85 | 0.88 | 0.08 | 0.71 |
| [24] rs3733631 | 104860552 | Promoter | 0.16 | 0.73 | 0.52 | 0.84 | 0.74 | 0.63 | 0.42 |
| [25] rs3775971 | 104861369 | Promoter | 0.16 | 0.67 | 0.39 | 0.89 | 0.91 | 0.42 | 0.33 |
| [26] rs17034019 | 104867106 | Upstream | 0.10 | 0.69 | 0.66 | 0.83 | 0.84 | 0.92 | 0.46 |
| [27] rs17034020 | 104870122 | Upstream | 0.06 | 1.00 | 0.88 | 0.88 | 0.50 | 0.60 | 0.46 |
| [28] rs233992 | 104876519 | Upstream | 0.44 | 0.19 | 0.12 | 0.90 | 0.14 | 0.16 | 0.43 |
Chromosome positions are based on NCBI Human Genome Assembly v. 36.1.
SNP location relative to the exons of TACR3, based on transcript NM_001059.1. Transcription is opposite to the human genome direction.
Minor allele frequency in European Americans.
p-Value for test of Hardy Weinberg equilibrium.
p-Value of avg-PDT statistic for associations between the SNPs and phenotypes shown.
Note that 82% of individuals with cocaine dependence were also alcohol dependent.
N/A not available due to very low MAF resulting in no power to detect evidence of association.
Table 2 presents the results from family based tests of association (PDT) between each TACR3 SNP and alcohol dependence (DSM-IV criteria). Seven of the 9 SNPs in the 3′ region of TACR3 provided significant evidence of association (p ≤ 0.05). One marker, rs2868397, had a minor allele frequency of only 4% and therefore provided minimal power to detect association. Another SNP, rs1813782, which was informative, did not provide evidence of association (p = 0.81), although the adjacent SNPs both did (p = 0.02). Review of the LD pattern indicates that this SNP is in lower LD with its flanking markers, which were in high LD with each other. The other SNPs distributed throughout the 5′ and coding regions of TACR3 did not provide significant evidence of association (all p > 0.12).
To further explore the phenotypes that contribute to the observed association, analyses were performed using narrower (ICD-10) and broader (COGA; DSM-IIIR plus Feighner definite) definitions of alcohol dependence. The same SNPs in the 3′ region of the TACR3 gene which were significant when analyzing the DSM-IV alcohol dependence phenotype were also significant when analyses were performed using the narrower ICD-10 criteria, suggesting that the association is driven by the subset of alcoholics with a more severe phenotype. In contrast, only 1 SNP, rs4274850, was significant (p = 0.05) when analyses were performed using the broader alcohol dependence definition (COGA).
Because there are data from animal models suggesting that TACR3 might play a role in cocaine dependence, we carried out subsequent analyses to determine whether the association of TACR3 with alcohol dependence was due to the inclusion of 208 individuals who were also cocaine dependent. To examine the role of cocaine dependence on the association with alcohol dependence, the family based association analysis was repeated; however, those who met criteria for both DSM-IV alcohol dependence and cocaine dependence were excluded from the sample of affected individuals (n = 208) to see if there was association with alcoholism in the absence of confounding by cocaine dependence. Therefore, affected individuals included only those who met DSM-IV criteria for alcohol dependence but did not meet criteria for DSM-IIIR cocaine dependence. In this analysis, 2 SNPs were significant (p ≤ 0.05) (Table 2).
Association analysis employing cocaine dependence as the phenotype of interest detected evidence of association throughout an extended region of TACR3, including the 3′ region identified when analyzing the alcohol dependence phenotype and also SNPs in introns 1 and 3 (Table 2). Haplotypes were then constructed throughout TACR3 using overlapping sets of 3 adjacent SNPs. Significant evidence (p ≤ 0.05) of association was observed with multiple sets of consecutive haplotypes when performing analyses with DSM-IIIR cocaine dependence (Table 3). One other 3 SNP sliding window (SNP 12-14) also provided significant evidence of association (p = 0.01). Overall association results and associated haplotypes were similar when analyses were performed using DSM-IV and ICD-10 alcohol dependence (Tables 4 and 5).
Table 3.
Association of TACR3 Haplotypes With Cocaine Dependence
| SNP [1-3]
|
SNP [2-4]
|
SNP [3-5]
|
SNP [4-6]
|
SNP [5-7]
|
SNP [6-8]
|
|||||||
|---|---|---|---|---|---|---|---|---|---|---|---|---|
| Overtransmission | Aa | Ub | A | U | A | U | A | U | A | U | A | U |
| [1] rs2757673 | G | A | ||||||||||
| [2] rs4274850 | A | C | A | C | ||||||||
| [3] rs2868397 | C | C | C | C | C | C | ||||||
| [4] rs3857203 | G | A | G | A | G | A | ||||||
| [5] rs4530637 | G | A | G | A | G | A | ||||||
| [6] rs2765 | A | G | A | G | A | G | ||||||
| [7] rs4580655 | A | G | A | G | ||||||||
| [8] rs1813782 | A | G | ||||||||||
| [9] rs11722288 | ||||||||||||
| Haplotype (p-value)c | 0.09 | 0.09 | 0.07 | 0.08 | 0.05 | 0.04 | 0.02 | 0.007 | 0.02 | 0.01 | 0.17 | 0.03 |
| Global (p-value)d | 0.09 | 0.10 | 0.05 | 0.01 | 0.01 | 0.12 | ||||||
DSM-IIIR cocaine dependence.
Unaffected.
p-Value associated with the differential transmission of that haplotype.
Global p-value for the PDT using all haplotypes observed with these 3 SNPs.
Table 4.
Association of TACR3 Haplotypes With Alcohol Dependence (DSM-IV)
| SNP [1-3]
|
SNP [2-4]
|
SNP [3-5]
|
SNP [4-6]
|
SNP [5-7]
|
SNP [6-8]
|
|||||||
|---|---|---|---|---|---|---|---|---|---|---|---|---|
| Overtransmission | Aa | Ub | A | U | A | U | A | U | A | U | A | U |
| [1] rs2757673 | G | A | ||||||||||
| [2] rs4274850 | A | C | A | C | ||||||||
| [3] rs2868397 | C | C | C | C | C | C | ||||||
| [4] rs3857203 | G | A | G | A | G | A | ||||||
| [5] rs4530637 | G | A | G | A | G | A | ||||||
| [6] rs2765 | A | G | A | G | A | G | ||||||
| [7] rs4580655 | A | G | A | G | ||||||||
| [8] rs1813782 | A | G | ||||||||||
| [9] rs11722288 | ||||||||||||
| Haplotype (p-value)c | 0.02 | 0.02 | 0.04 | 0.08 | 0.15 | 0.15 | 0.07 | 0.07 | 0.03 | 0.03 | 0.22 | 0.06 |
| Global (p-value)d | 0.02 | 0.05 | 0.15 | 0.07 | 0.03 | 0.18 | ||||||
DSM-IV alcohol dependence.
Unaffected.
p-Value associated with the differential transmission of that haplotype.
Global p-value for the PDT using all haplotypes observed with these 3 SNPs.
Table 5.
Association of TACR3 Haplotypes With Alcohol Dependence (ICD-10)
| SNP [1-3]
|
SNP [2-4]
|
SNP [3-5]
|
SNP [4-6]
|
SNP [5-7]
|
SNP [6-8]
|
|||||||
|---|---|---|---|---|---|---|---|---|---|---|---|---|
| Overtransmission | Aa | Ub | A | U | A | U | A | U | A | U | A | U |
| [1] rs2757673 | G | A | ||||||||||
| [2] rs4274850 | A | C | A | C | ||||||||
| [3] rs2868397 | C | C | C | C | C | C | ||||||
| [4] rs3857203 | G | A | G | A | G | A | ||||||
| [5] rs4530637 | G | A | G | A | G | A | ||||||
| [6] rs2765 | A | G | A | G | A | G | ||||||
| [7] rs4580655 | A | G | A | G | ||||||||
| [8] rs1813782 | A | G | ||||||||||
| [9] rs11722288 | ||||||||||||
| Haplotype (p-value)c | 0.02 | 0.02 | 0.02 | 0.01 | 0.02 | 0.02 | 0.01 | 0.01 | 0.01 | 0.01 | 0.08 | 0.04 |
| Global (p-value)d | 0.02 | 0.01 | 0.02 | 0.01 | 0.007 | 0.09 | ||||||
ICD-10 alcohol dependence.
Unaffected.
p-Value associated with the differential transmission of that haplotype.
Global p-value for the PDT using all haplotypes observed with these 3 SNPs.
DISCUSSION
Linkage analyses were initially used to identify chromosome 4q25 as a region likely to harbor gene(s) contributing to alcohol dependence. Examination of this chromosomal interval identified a positional candidate gene, TACR3, which had been studied in rat and monkey models and found to have a role in the response to ethanol and cocaine. Based on these lines of evidence, we initially tested for the association of SNPs within the TACR3 gene and alcohol dependence, defined by DSM-IV criteria (for which the linkage signal was strongest). Having found positive evidence of association, we then pursued secondary analyses to better delineate whether the evidence of association was found throughout the COGA sample or could be limited to a particular subset of the COGA sample. These analyses suggested that variation in TACR3 is associated with more severe alcoholism, as demonstrated by the stronger association when analyzing ICD-10 alcohol dependence, despite the smaller number of affected individuals. The strongest evidence of association was found with the phenotype of cocaine dependence. However, 82% of the cocaine-dependent individuals were also alcohol dependent; because there were only 47 subjects who were cocaine dependence but not DSM-IV alcohol dependent, we did not have sufficient power to test whether the association with cocaine dependence was independent of alcohol dependence. In previous work (Dick et al., 2007), we found that the individuals in our study with comorbid alcohol and illicit drug dependence had more severe alcohol problems; therefore, this finding reinforces the idea that variants in TACR3 are associated with more severe forms of alcoholism.
There is substantial clinical heterogeneity in the phenotypic expression of alcohol dependence, and it is not surprising that particular genes may contribute to subsets of the disease, defined by severity or other comorbid addictions. In previous analyses, we have detected association to SNCA which was observed only when using the phenotype of alcohol craving rather than alcohol dependence (Foroud et al., 2007). Comorbid addiction to drugs other than alcohol is observed among a substantial proportion of alcohol dependent individuals; within the broader COGA sample, including individuals with a less strong family history of alcohol dependence who were not included in the genotyped sample reported herein, there were 1,964 subjects meeting DSM-IV criteria for alcohol dependence. Within this group, 32% also met criteria for DSM-IIIR cocaine dependence.
The primary phenotype analyzed for association with TACR3 was DSM-IV alcohol dependence. Three additional phenotypes were also analyzed as part of secondary analyses (COGA, ICD-10 and cocaine dependence). Thus, we have 3 nested alcohol dependence phenotypes and 1 cocaine dependence phenotype; the latter includes many subjects who are also alcohol dependent. It is difficult to assess the number of independent tests; however, we propose that there are at most 2 independent tests being performed. One is a test of the association with alcohol dependence, and the other is a test of the association with cocaine dependence. Employing a conservative Bonferroni adjustment for 2 phenotypic groups, our adjusted significance threshold would be 0.05/2 = 0.025. Using this criterion, 3 SNPs were significantly associated with DSM-IV alcohol dependence and 4 SNPs were significantly associated with ICD-10 alcohol dependence. Nine SNPs were significantly associated with cocaine dependence. Furthermore, 5 sliding windows [1–3, 2–4, 3–5, 4–6, and 5–7] were significantly associated with ICD-10 alcohol dependence and 2 windows were significantly associated with cocaine dependence [4–6 and 5–7].
This study has several strengths. First, 30 SNPs were genotyped throughout TACR3, allowing rigorous evaluation of the evidence of association. Second, a large sample of 219 European American multiplex alcohol dependent families were analyzed using family based methods of association analysis, reducing the potential errors due to stratification. Third, the depth of phenotyping completed in the vast majority of the genotyped individuals allowed us to determine that the association was due to the most severely affected alcoholics who were also cocaine dependent.
This study did also have limitations. We did not have a large sample of African American families and therefore are not able to confirm whether this association would also replicate in ethnically diverse samples. We also did not have a large sample of individuals who were only cocaine dependent; therefore, we cannot test whether variation in TACR3 can affect the risk of cocaine dependence independently of the association with alcohol dependence.
In summary, we have detected consistent evidence of association in the COGA sample in the 3′ region of TACR3 when analyzing alcohol dependence as well as cocaine dependence. Our results suggest that the evidence of association is primarily due to that subset of the sample that meets more severe criteria for alcohol dependence (DSM-IV and ICD-10) and are both alcohol dependent and cocaine dependent. These results confirm the data in the rat and monkey which suggested that the NK3 receptor plays an important role in the response to ethanol and cocaine. Studies in additional samples are critical to confirm these results and better delineate how variation in TACR3 mediates its effects.
Acknowledgments
The Collaborative Study on the Genetics of Alcoholism (COGA), Co-Principal Investigators B. Porjesz, V. Hesselbrock, H. Edenberg, L. Bierut, includes 9 different centers where data collection, analysis, and storage take place. The 9 sites and Principal Investigators and Co-Investigators are: University of Connecticut (V. Hesselbrock); Indiana University (H.J. Edenberg, J. Nurnberger Jr., P.M. Conneally, T. Foroud); University of Iowa (S. Kuperman, R. Crowe); SUNY Downstate (B. Porjesz); Washington University in St. Louis (L. Bierut, A. Goate, J. Rice); University of California at San Diego (M. Schuckit); Howard University (R. Taylor); Rutgers University (J. Tischfield); Southwest Foundation (L. Almasy). Zhaoxia Ren serves as the NIAAA Staff Collaborator. This national collaborative study is supported by the NIH Grant U10AA008401 from the National Institute on Alcohol Abuse and Alcoholism (NIAAA) and the National Institute on Drug Abuse (NIDA).
Genotyping facilities were provided by the Center forMedical Genomics at Indiana University School of Medicine, supported in part by the Indiana Genomics Initiative (INGEN, supported in part by the Lilly Endowment, Inc.). We thank Gayathri Rajan and Rachel Thowe for their superb technical support on SNP genotyping.
In memory of Henri Begleiter and Theodore Reich, Principal and Co-Principal Investigators of COGA since its inception; we are indebted to their leadership in the establishment and nurturing of COGA, and acknowledge with great admiration their seminal scientific contributions to the field.
References
- American Psychiatric Association and Task Force on DSM-IV. Diagnostic and Statistical Manual of Mental Disorders DSM-IV-TR. 4, text revision. American Psychiatric Association; Washington, DC: 2000. [Google Scholar]
- American Psychiatric Association and Work Group to Revise DSM-III. Diagnostic and Statistical Manual of Mental Disorders DSM-III-R. 3, rev edn. American Psychiatric Association; Washington, DC: 1987. [Google Scholar]
- de Bakker PI, Yelensky R, Pe’er I, Gabriel SB, Daly MJ, Altshuler D. Efficiency and power in genetic association studies. Nat Genet. 2005;37:1217–1223. doi: 10.1038/ng1669. [DOI] [PubMed] [Google Scholar]
- Barrett JC, Fry B, Maller J, Daly MJ. Haploview: analysis and visualization of LD and haplotype maps. Bioinformatics. 2005;21:263–265. doi: 10.1093/bioinformatics/bth457. [DOI] [PubMed] [Google Scholar]
- Boehnke M. Allele frequency estimation from data on relatives. Am J Hum Genet. 1991;48:22–25. [PMC free article] [PubMed] [Google Scholar]
- Bucholz KK, Cadoret R, Cloninger CR, Dinwiddie SH, Hesselbrock VM, Nurnberger JI, Jr, Reich T, Schmidt I, Schuckit MA. A new, semistructured psychiatric interview for use in genetic linkage studies: a report on the reliability of the SSAGA. J Stud Alcohol. 1994;55:149–158. doi: 10.15288/jsa.1994.55.149. [DOI] [PubMed] [Google Scholar]
- Cadoret RJ, Cain CA, Grove WM. Development of alcoholism in adoptees raised apart from alcoholic biologic relatives. Arch Gen Psychiatry. 1980;37:561–563. doi: 10.1001/archpsyc.1980.01780180075008. [DOI] [PubMed] [Google Scholar]
- Ciccocioppo R, Panocka I, Pompei P, deCaro G, Massi M. Selective agonists at NK3 tachykinin receptors inhibit alcohol intake in Sardinian alcohol-preferring rats. Brain Res Bull. 1994;33:71–77. doi: 10.1016/0361-9230(94)90050-7. [DOI] [PubMed] [Google Scholar]
- Ciccocioppo R, Panocka I, Pompei P, Polidori C, deCaro G, Massi M. Subcutaneous injections of the tachykinin senktide reduce alcohol intake in alcohol-preferring rats. Peptides. 1995;16:533–537. doi: 10.1016/0196-9781(94)00219-v. [DOI] [PubMed] [Google Scholar]
- Cloninger CR, Bohman M, Sigvardsson S. Inheritance of alcohol abuse. Cross-fostering analysis of adopted men. Arch Gen Psychiatry. 1981;38:861–868. doi: 10.1001/archpsyc.1981.01780330019001. [DOI] [PubMed] [Google Scholar]
- Covault J, Gelernter J, Hesselbrock V, Nellissery M, Kranzler HR. Allelic and haplotypic association of GABRA2 with alcohol dependence. Am J Med Genet B Neuropsychiatr Genet. 2004;129:104–109. doi: 10.1002/ajmg.b.30091. [DOI] [PubMed] [Google Scholar]
- De Souza Silva MA, Mello EL, Jr, Muller CP, Jocham G, Maior RS, Huston JP, Tomaz C, Barros M. Interaction of the tachykinin NK3 receptor agonist senktide with behavioral effects of cocaine in marmosets (Callithrix penicillata) Peptides. 2006a;27:2214–2223. doi: 10.1016/j.peptides.2006.03.005. [DOI] [PubMed] [Google Scholar]
- De Souza Silva MA, Mello J, Muller CP, Jocham G, Maior RS, Huston JP, Tomaz C, Barros M. The tachykinin NK3 receptor antagonist SR142801 blocks the behavioral effects of cocaine in marmoset monkeys. Eur J Pharmacol. 2006b;536:269–278. doi: 10.1016/j.ejphar.2006.03.010. [DOI] [PubMed] [Google Scholar]
- Dick DM, Agrawal A, Wang JC, Hinrichs A, Bertelsen S, Bucholz KK, Schuckit M, Kramer J, Nurnberger J, Jr, Tischfield J, Edenberg HJ, Goate A, Bierut LJ. Alcohol dependence with comorbid drug dependence: genetic and phenotypic associations suggest a more severe form of the disorder with stronger genetic contribution to risk. Addiction. 2007;102:1131–1139. doi: 10.1111/j.1360-0443.2007.01871.x. [DOI] [PubMed] [Google Scholar]
- Dudbridge F. Pedigree disequilibrium tests for multilocus haplotypes. Genet Epidemiol. 2003;25:115–121. doi: 10.1002/gepi.10252. [DOI] [PubMed] [Google Scholar]
- Edenberg HJ, Dick DM, Xuei X, Tian H, Almasy L, Bauer LO, Crowe RR, Goate A, Hesselbrock V, Jones K, Kwon J, Li TK, Nurnberger JI, Jr, O’Connor SJ, Reich T, Rice J, Schuckit MA, Porjesz B, Foroud T, Begleiter H. Variations in GABRA2, encoding the alpha 2 subunit of the GABA(A) receptor, are associated with alcohol dependence and with brain oscillations. Am J Hum Genet. 2004;74:705–714. doi: 10.1086/383283. [DOI] [PMC free article] [PubMed] [Google Scholar]
- Edenberg HJ, Xuei X, Chen HJ, Tian H, Wetherill LF, Dick DM, Almasy L, Bierut L, Bucholz KK, Goate A, Hesselbrock V, Kuperman S, Nurnberger J, Porjesz B, Rice J, Schuckit M, Tischfield J, Begleiter H, Foroud T. Association of alcohol dehydrogenase genes with alcohol dependence: a comprehensive analysis. Hum Mol Genet. 2006;15:1539–1549. doi: 10.1093/hmg/ddl073. [DOI] [PubMed] [Google Scholar]
- Fehr C, Sander T, Tadic A, Lenzen KP, Anghelescu I, Klawe C, Dahmen N, Schmidt LG, Szegedi A. Confirmation of association of the GABRA2 gene with alcohol dependence by subtype-specific analysis. Psychiatr Genet. 2006;16:9–17. doi: 10.1097/01.ypg.0000185027.89816.d9. [DOI] [PubMed] [Google Scholar]
- Feighner JP, Robins E, Guze SB, Woodruff RA, Jr, Winokur G, Munoz R. Diagnostic criteria for use in psychiatric research. Arch Gen Psychiatry. 1972;26:57–63. doi: 10.1001/archpsyc.1972.01750190059011. [DOI] [PubMed] [Google Scholar]
- Foroud T, Edenberg HJ, Goate A, Rice J, Flury L, Koller DL, Bierut LJ, Conneally PM, Nurnberger JI, Bucholz KK, Li TK, Hesselbrock V, Crowe R, Schuckit M, Porjesz B, Begleiter H, Reich T. Alcoholism susceptibility loci: confirmation studies in a replicate sample and further mapping. Alcohol Clin Exp Res. 2000;24:933–945. [PubMed] [Google Scholar]
- Foroud T, Wetherill LF, Liang T, Dick DM, Hesselbrock V, Kramer J, Nurnberger J, Schuckit M, Carr L, Porjesz B, Xuei X, Edenberg HJ. Association of alcohol craving with alpha-synuclein (SNCA) Alcohol Clin Exp Res. 2007;31:537–545. doi: 10.1111/j.1530-0277.2007.00337.x. [DOI] [PubMed] [Google Scholar]
- Goodwin DW. The cause of alcoholism and why it runs in families. Br J Addict Alcohol Other Drugs. 1979;74:161–164. doi: 10.1111/j.1360-0443.1979.tb02424.x. [DOI] [PubMed] [Google Scholar]
- Grant BF, Dawson DA, Stinson FS, Chou SP, Dufour MC, Pickering RP. The 12-month prevalence and trends in DSM-IV alcohol abuse and dependence: United States, 1991–1992 and 2001–2002. Drug Alcohol Depend. 2004;74:223–234. doi: 10.1016/j.drugalcdep.2004.02.004. [DOI] [PubMed] [Google Scholar]
- Guindalini C, Scivoletto S, Ferreira RG, Breen G, Zilberman M, Peluso MA, Zatz M. Association of genetic variants in alcohol dehydrogenase 4 with alcohol dependence in Brazilian patients. Am J Psychiatry. 2005;162:1005–1007. doi: 10.1176/appi.ajp.162.5.1005. [DOI] [PubMed] [Google Scholar]
- Heath AC, Bucholz KK, Madden PA, Dinwiddie SH, Slutske WS, Bierut LJ, Statham DJ, Dunne MP, Whitfield JB, Martin NG. Genetic and environmental contributions to alcohol dependence risk in a national twin sample: consistency of findings in women and men. Psychol Med. 1997;27:1381–1396. doi: 10.1017/s0033291797005643. [DOI] [PubMed] [Google Scholar]
- Hesselbrock M, Easton C, Bucholz KK, Schuckit M, Hesselbrock V. A validity study of the SSAGA–a comparison with the SCAN. Addiction. 1999;94:1361–1370. doi: 10.1046/j.1360-0443.1999.94913618.x. [DOI] [PubMed] [Google Scholar]
- Jocham G, Lezoch K, Muller CP, Kart-Teke E, Huston JP, de Souza Silva MA. Neurokinin3 receptor antagonism attenuates cocaine’s behavioural activating effects yet potentiates its dopamine-enhancing action in the nucleus accumbens core. Eur J Neurosci. 2006;24:1721–1732. doi: 10.1111/j.1460-9568.2006.05041.x. [DOI] [PubMed] [Google Scholar]
- Kendler KS, Neale MC, Heath AC, Kessler RC, Eaves LJ. A twin-family study of alcoholism in women. Am J Psychiatry. 1994;151:707–715. doi: 10.1176/ajp.151.5.707. [DOI] [PubMed] [Google Scholar]
- Lappalainen J, Krupitsky E, Remizov M, Pchelina S, Taraskina A, Zvartau E, Somberg LK, Covault J, Kranzler HR, Krystal JH, Gelernter J. Association between alcoholism and gamma-amino butyric acid alpha2 receptor subtype in a Russian population. Alcohol Clin Exp Res. 2005;29:493–498. doi: 10.1097/01.alc.0000158938.97464.90. [DOI] [PubMed] [Google Scholar]
- Luo X, Kranzler HR, Zuo L, Wang S, Blumberg HP, Gelernter J. CHRM2 gene predisposes to alcohol dependence, drug dependence and affective disorders: results from an extended case-control structured association study. Hum Mol Genet. 2005a;14:2421–2434. doi: 10.1093/hmg/ddi244. [DOI] [PubMed] [Google Scholar]
- Luo X, Kranzler HR, Zuo L, Yang BZ, Lappalainen J, Gelernter J. ADH4 gene variation is associated with alcohol and drug dependence: results from family controlled and population-structured association studies. Pharmacogenet Genomics. 2005b;15:755–768. doi: 10.1097/01.fpc.0000180141.77036.dc. [DOI] [PubMed] [Google Scholar]
- Martin ER, Bass MP, Kaplan NL. Correcting for a potential bias in the pedigree disequilibrium test. Am J Hum Genet. 2001;68:1065–1067. doi: 10.1086/319525. [DOI] [PMC free article] [PubMed] [Google Scholar]
- Martin ER, Monks SA, Warren LL, Kaplan NL. A test for linkage and association in general pedigrees: the pedigree disequilibrium test. Am J Hum Genet. 2000;67:146–154. doi: 10.1086/302957. [DOI] [PMC free article] [PubMed] [Google Scholar]
- Massi M, Panocka I, deCaro G. The psychopharmacology of tachykinin NK-3 receptors in laboratory animals. Peptides. 2000;21:1597–1609. doi: 10.1016/s0196-9781(00)00291-6. [DOI] [PubMed] [Google Scholar]
- O’Connell JR, Weeks DE. PedCheck: a program for identification of genotype incompatibilities in linkage analysis. Am J Hum Genet. 1998;63:259–266. doi: 10.1086/301904. [DOI] [PMC free article] [PubMed] [Google Scholar]
- Page NM. New challenges in the study of the mammalian tachykinins. Peptides. 2005;26:1356–1368. doi: 10.1016/j.peptides.2005.03.030. [DOI] [PubMed] [Google Scholar]
- Pickens RW, Svikis DS, McGue M, Lykken DT, Heston LL, Clayton PJ. Heterogeneity in the inheritance of alcoholism. A study of male and female twins. Arch Gen Psychiatry. 1991;48:19–28. doi: 10.1001/archpsyc.1991.01810250021002. [DOI] [PubMed] [Google Scholar]
- Reich T, Edenberg HJ, Goate A, Williams JT, Rice JP, Van EP, Foroud T, Hesselbrock V, Schuckit MA, Bucholz K, Porjesz B, Li TK, Conneally PM, Nurnberger JI, Jr, Tischfield JA, Crowe RR, Cloninger CR, Wu W, Shears S, Carr K, Crose C, Willig C, Begleiter H. Genome-wide search for genes affecting the risk for alcohol dependence. Am J Med Genet. 1998;81:207–215. [PubMed] [Google Scholar]
- Wang JC, Hinrichs AL, Stock H, Budde J, Allen R, Bertelsen S, Kwon JM, Wu W, Dick DM, Rice J, Jones K, Nurnberger JI, Jr, Tischfield J, Porjesz B, Edenberg HJ, Hesselbrock V, Crowe R, Schuckit M, Begleiter H, Reich T, Goate AM, Bierut LJ. Evidence of common and specific genetic effects: association of the muscarinic acetylcholine receptor M2 (CHRM2) gene with alcohol dependence and major depressive syndrome. Hum Mol Genet. 2004;13:1903–1911. doi: 10.1093/hmg/ddh194. [DOI] [PubMed] [Google Scholar]
- Williams JT, Begleiter H, Porjesz B, Edenberg HJ, Foroud T, Reich T, Goate A, Van EP, Almasy L, Blangero J. Joint multipoint linkage analysis of multivariate qualitative and quantitative traits. II. Alcoholism and event-related potentials. Am J Hum Genet. 1999;65:1148–1160. doi: 10.1086/302571. [DOI] [PMC free article] [PubMed] [Google Scholar]