

Abstract
Aminoglycoside antibiotics induce caspase-dependent apoptotic death in cochlear hair cells. Apoptosis, a regulated form of cell death, can be induced by many stressors, which activate signaling pathways that result in the controlled dismantling of the affected cell. The caspase family of proteases is activated in the apoptotic signaling pathway and is responsible for cellular destruction. The initiator caspase-9 and the effector caspase-3 are both activated in chick cochlear hair cells following aminoglycoside exposure. We have analyzed caspase activation in the avian cochlea during gentamicin-induced hair cell death to compare two different methods of caspase detection: caspase antibodies and CaspaTag kits. Caspase antibodies bind to the cleaved activated form of caspase-9 or caspase-3 in specific locations in fixed tissue. CaspaTag is a fluorescent inhibitor that binds to a reactive cysteine residue on the large subunit of the caspase heterodimer in unfixed tissue.
To induce cochlear hair cell loss, 1-2 week-old chickens received a single injection of gentamicin (300 mg/kg). Chicks were sacrificed 24, 30, 42, 48, 72, or 96 h after injection. Cochleae were dissected and labeled for activated caspase-9 or caspase-3 using either caspase-directed antibodies or CaspaTag kits. Ears were co-labeled with either phalloidin or myosin VI to visualize hair cells and to determine the progression of cochlear damage. The timing of caspase activation was similar for both assays; however, caspase-9 and caspase-3 antibodies labeled only those cells currently undergoing apoptotic cell death. Conversely, CaspaTag-labeled all the cells that have undergone apoptotic cell death and ejection from the sensory epithelium, in addition to those that are currently in the cell death process. This makes CaspaTag ideal for showing an overall pattern or level of cell death over a period of time, while caspase antibodies provide a snapshot of cell death at a specific time point.
Keywords: Apoptosis, Caspase, Avian, Aminoglycoside, Cochlea, Gentamicin, Hair cells
1. Introduction
A single systemic injection of a high dose of gentamicin (an aminoglycoside antibiotic) can create a consistent pattern of hair cell death in the avian cochlea, with cell loss beginning in the basal (proximal) end of the basilar papilla and progressing apically (distally) with time (Bhave et al., 1995; Janas et al., 1995; Park et al., 1998; Roberson et al., 2000; Mangiardi et al., 2004; Duncan et al., 2006). Many studies have characterized changes in avian cochlear hair cells following treatment with gentamicin both in vivo and in vitro. Redistribution of F-actin labeling (Mangiardi et al., 2004) and changes in myosin VI and VIIa distribution and intensity (Duncan et al., 2006) have been reported to occur in chick cochlear hair cells prior to and during the process of ejection from the basilar papilla following gentamicin exposure. Additionally, recent morphological and biochemical evidence suggests that a significant amount of aminoglycoside-induced hair cell death occurs via apoptosis (Forge, 1985; Li et al., 1995; Nakagawa et al., 1997; Torchinsky et al., 1999; Forge and Li, 2000; Cunningham et al., 2002; Matsui et al., 2002, 2003, 2004; Cheng et al., 2003; Mangiardi et al., 2004; Duncan et al., 2006; Sugahara et al., 2006). Apoptosis appears to be the main mechanism of hair cell death in the avian basilar papilla following a single large dose of aminoglycosides (Matsui et al., 2002, 2003, 2004; Cheng et al., 2003; Mangiardi et al., 2004; Duncan et al., 2006). In contrast, hair cell death in mammalian vestibular and cochlear sensory epithelia appears to arise from both apoptotic and non-apoptotic pathways (Forge, 1985; Li et al., 1995; Nakagawa et al., 1997; Jiang et al., 2006; Bohne et al., 2007). The pathway taken seems to be related to the mechanism of cell death (noise vs. aminoglycosides) and the method of aminoglycoside administration (single large dose injection vs. multiple lower dose injections). In our studies of the gentamicin-treated chick cochlea, we have focused on the apoptotic pathways involving caspase activation, as this is the primary means of hair cell death in this sensory epithelium (Cheng et al., 2003; Matsui et al., 2003; Mangiardi et al., 2004).
Likened to cellular suicide, apoptosis is an actively driven process with distinct morphological and biochemical features. Cell shrinkage, nuclear and cytoplasmic condensation, chromatin fragmentation, and cysteine-aspartate protease (caspase) activation are all hallmarks of apoptotic cell death. It is the activation of caspases that ultimately results in apoptotic cellular degradation. Caspases can be divided into two groups: initiators (caspases-2, -8, -9, and -10) and effectors (caspases-3, -6, and -7). All cells contain caspases that are present constitutively but synthesized in an inactive precursor form. Once caspases are cleaved from an inactive pro-caspase to an activated caspase, it is the effector caspases that are responsible for cellular destruction.
Caspase-3 is the major effector protease involved in the apoptotic process and it can be activated by several initiator caspases found upstream in the signal cascade. Two of these upstream initiator caspases, caspase-8 and caspase-9, have been shown to be activated in the cochlea following sound exposure (Nicotera et al., 2003) and following aminoglycoside treatment in vivo and in vitro (Cunningham et al., 2002; Cheng et al., 2003). Involved in the extrinsic apoptotic pathway, caspase-8 is initiated after the binding and trimerization of death receptors on the cell membrane. Once activated, caspase-8 cleaves downstream pro-caspases by activation of bid and inducing mitochondrial cytochrome c release (Cryns and Yuan, 1998). Conversely, caspase-9 is involved in an intrinsic pathway associated with mitochondria-mediated activation and cytochrome c release into the cytosol (Cryns and Yuan, 1998; Robertson and Orrenius, 2002). Although caspase-8 and caspase-9 represent two distinct apoptotic signaling pathways, both have been shown to activate caspase-3 (Cheng et al., 2003; Nicotera et al., 2003). However, inhibition of caspase-9 prevented the activation of downstream caspase-3, whereas the inhibition of caspase-8 did not (Cunningham et al., 2002). Subsequently, much research has focused on the activation of caspase-9 and caspase-3 and their interactions with each other in promoting hair cell death.
Several morphological and biochemical markers of apoptosis have been identified in cochlear and vestibular hair cells following administration of aminoglycoside antibiotics both in vivo and in vitro. This includes the translocation of T-cell restricted intracellular antigen-related protein (TIAR) from the nucleus to the cytoplasm (Mangiardi et al., 2004), release of mitochondrial cytochrome c (Mangiardi et al., 2004; Matsui et al., 2004), nuclear condensation (Matsui et al., 2004) and activation of caspase-3 (Cunningham et al., 2002; Cheng et al., 2003; Mangiardi et al., 2004; Matsui et al., 2004), caspase-8, and caspase-9 (Cunningham et al., 2002; Cheng et al., 2003; Sugahara et al., 2006).
Two main methods have been employed in order to visualize caspase activation in cochlear and vestibular hair cells following aminoglycoside treatment or noise damage: antibodies raised against activated caspases (Cunningham et al., 2002; Mangiardi et al., 2004) and fluorogenic caspase substrates (Hu et al., 2002; Cunningham et al., 2002; Cheng et al., 2003; Matsui et al., 2004; Sugahara et al., 2006). The caspase antibodies bind to the large fragment of the activated caspase that results from the cleavage of the pro-caspase form. Fluorogenic caspase substrates consist of a short peptide sequence conjugated to a fluorescent probe (Cheng et al., 2003). These substrates act as inhibitors by binding to a reactive cysteine residue on the large subunit of the active caspase heterodimer. Both of these methods have been shown to reliably label caspase activation in hair cells; however, there has not been a study performed to directly compare these two caspase detection methods in the same tissue.
The purpose of this study is to compare both caspase-directed antibodies and fluorogenic caspase substrates (commercially available as CaspaTag in situ assay kits) as a measure of gentamicin-induced apoptotic cell death in the avian basilar papilla. To do this, we examined the timing of caspase activation following gentamicin treatment using both detection methods and then quantified the number of caspase-labeled cells at three different time points during the cellular death process. Results from this study indicate that there are important similarities, as well as significant differences, between the two detection methods in their capacity to label caspase activation in cochlear hair cells. Both caspase-directed antibodies and CaspaTag kits reliably label apoptotic cells expressing activated caspase-9 and caspase-3 in the avian cochlea. Additionally, the timing of caspase-9 and caspase-3 activation following gentamicin treatment is similar for both detection methods. However, antibodies against caspase-9 and caspase-3 tend to label only those cells that are currently in the process of apoptotic cell death and ejection from the sensory epithelium. Conversely, CaspaTag labels all the cells that have undergone apoptotic cell death and ejection from the sensory epithelium, in addition to those that are currently in the cell death process. This makes CaspaTag ideal for showing an overall pattern or level of cell death over a period of time, while caspase antibodies provide a snapshot of cell death at a specific time point.
2. Methods and materials
2.1. Animals
White Leghorn chickens (Gallus domesticus) were obtained at one week of age from specific pathogen-free avian supply (Charles River SPAFAS, Preston, CT). Upon arrival at the Children’s Hospital animal care facility, chickens were housed in communal brooders with ad libitum access to food and water. All animal procedures were approved by the Children’s Hospital Institutional Animal Care and Use Committee (IACUC).
2.2. Gentamicin injections
To create cochlear hair cell death, 11-16 day-old chicks were given a single, subcutaneous injection of gentamicin sulfate (300 mg/kg, Sigma, St. Louis, MO), with the time of injection designated as time “0 h” after injection (AI). Injections were performed either in the morning or early afternoon, so that the nephrotoxic effects of gentamicin could pass before the evening (Roberson et al., 2000; Duncan et al., 2006). An additional group of age-matched birds did not receive a gentamicin injection and served as unmanipulated experimental controls.
2.3. Sacrifice and cochlear dissection
To determine the time course of caspase activation following gentamicin treatment, birds were killed 24, 30, 42, 48, 72, or 96 h AI. At the time of sacrifice, animals were euthanized with an intracardiac injection of Fatal Plus (390 mg/mL pentobarbital, Vortech Pharmaceuticals, Dearborn, MI) and heads were removed for cochlear dissection.
To harvest cochlear tissue, the tympanic membrane and columella were removed and the lagena was exposed. Forceps were used to chip away at the bones surrounding the middle ear to provide direct access to the oval window. The bony spur separating the round and oval windows was removed and bone was chipped away, exposing the entire length of the cochlea. Using forceps to grasp the lagena, cochlear tissue was gently lifted out of the temporal bone and placed into chilled HEPES-buffered Hank’s balanced salt solution (HHBSS, pH 7.4; Gibco, Grand Island, NY), where the lagena and the tegmentum vasculosum were removed. This resulted in a whole mount preparation that included the basilar papilla, the superior cartilaginous plate with the homogene cells still in place, and the inferior cartilaginous plate with the hyaline cells and cuboidal cells still intact. Since this whole mount preparation contains all the components of the cochlear duct except the tegmentum vasculosum and lagena, we refer to this as the cochlea. Contained within this cochlear tissue is the basilar papilla, the avian equivalent of the mammalian organ of Corti, which is composed of hair cells, supporting cells, and peripheral cochlear nerve processes.
2.3.1. Caspase-directed antibodies
All steps of the immunohistochemical procedure were performed at room temperature, unless otherwise indicated. Following fine dissection to remove the tegmentum vasculosum, cochleae were fixed in chilled 4% paraformaldehyde for one hour and stored in TBS or PBS at 4 °C. Cochleae were rinsed three times in Tris-buffered saline (TBS, pH 7.4; caspase-9) or phosphate-buffered saline (PBS, pH 7.4; caspase-3) for five minutes per rinse between each step. Cochleae were then permeabilized in 1.0% Triton X-100 for 10 min and blocked in 10% normal goat serum for 10 min. Following incubation in primary antibody solution (rabbit anti-activated caspase-9 (Asp315), 1:200 in TBS or rabbit anti-activated caspase-3 (Asp175), 1:200 in PBS; Cell Signaling Technology, Beverly, MA) overnight at 4 °C, cochleae were incubated in secondary antibody solution (Alexa Fluor 488 goat anti-rabbit IgG, 1:1000 in TBS or PBS, Invitrogen/Molecular Probes, Eugene, OR) for 2 h. Cochleae were then placed in Alexa Fluor 568 phalloidin (1:100 in TBS or PBS; Invitrogen/Molecular Probes, Eugene, OR) for 45 min. Upon completion of the immunohistochemical procedure, cochleae were mounted in Vectashield mounting medium (Vector Laboratories, Burlingame, CA) onto glass slides and sealed with clear fingernail polish.
2.3.2. CaspaTag in situ assay kit
All steps of the CaspaTag in situ assay kit were performed at room temperature, unless otherwise indicated. Cochleae were rinsed three times in the CaspaTag kit wash buffer or a standard PBS solution (10 min per rinse) between each step. Following fine dissection of the tegmentum vasculosum, cochleae were transferred into a 48 well plate containing chilled HHBSS. Using a very fine tipped transfer pipetter, HHBSS was removed and cochleae were incubated in Caspatag fluorescent reagent (caspase-9, FAMLEHD-FMK, product #APT429; caspase-3, SR-DEVD-FMK, product #APT423; Chemicon International, Temecula, CA) for 1 h. Following CaspaTag labeling, cochleae were placed in fixative (provided with the Caspatag kit or using standard 4% paraformaldehyde) for 2 h and permeabilized with 1% Triton X-100 for 10 min. For earlier experimental time points (30, 42, and 48 h), cochleae were co-labeled with Alexa Fluor 568 phalloidin (1:100 in PBS) for 45 min and mounted in Vectashield mounting medium. For later experimental time points (72 and 96 h) at which point phalloidin will no longer label ejected hair cells (Mangiardi et al., 2004), cochleae were co-labeled with myosin VI for hair cell visualization. Cochleae were blocked with 10% normal goat serum and incubated in primary antibody solution (rabbit anti-myosin VI, 1:200 in PBS; Proteus Biosciences, Inc., Ramona, CA) for 2 h. Following incubation in secondary antibody solution (Alexa Fluor 568 goat anti-rabbit IgG, 1:1000 in PBS; Invitrogen/Molecular Probes, Eugene, OR) for 2 h, cochleae were mounted in Vectashield mounting medium onto glass slides and sealed with clear fingernail polish.
2.4. Image acquisition and data analysis
Fluorescent digital images of whole mount surface preparations of the basilar papilla were obtained using a Leica TCS SP confocal laser-scanning microscope (Leica Microsystems, Heidelberg, Germany). A z-series of scans through the depth of the basilar papilla was made using a 20× (N.A. 0.75), 40× (N.A. 1.25), or 100× (N.A. 1.4) oil immersion objective. Z-series scans were compressed to produce a single digital image used to visualize caspase activation in cochlear hair cells following gentamicin treatment. Montages of the basilar papilla surface extending through the region damaged by gentamicin (determined by either phalloidin or myosin VI labeling) were made with Adobe Photoshop 7.0 (Adobe Systems, San Jose, CA) using the compressed digital images. All images were oriented so that the basal (proximal) end of the basilar papilla appeared on the left and the apical (distal) end on the right.
In order to determine the labeling potential of caspase-directed antibodies and the CaspaTag in situ assay kit, the number of caspase-3 positive cells was quantified for both detection methods (cas-3 Ab and Ctag-3) at 48, 72, and 96 h AI. Additionally, the number of CaspaTag-labeled caspase-9 and caspase-3 positive cells was quantified 48 h AI. The number of caspase-3 positive cells was also quantified 48 h AI following 15, 30, or 60 min of incubation in CaspaTag-3. Using Image J 1.36b software (National Institutes of Health, USA), caspase-9 and caspase-3 labeled cells were marked using the crosshair tool and the total number of caspase-9 and caspase-3 positive cells was recorded for quantification analyses. Statistical analyses were performed using Statview version 5.0.1 (SAS Institute, Inc.), with α = 0.05 for all analyses. All data analysis was performed in a blind manner, with the caspase detection method, the experimental time point, and the CaspaTag-3 incubation time unknown to the examiner.
3. Results
3.1. Labeling of caspase activation after gentamicin treatment
Confocal images of avian basilar papillae labeled for activated caspase-9 or caspase-3 (green) and phalloidin (red) at 48 h AI can be seen in Fig. 1. Both caspase-directed antibodies (Fig. 1, left) and the CaspaTag kit (Fig. 1, right) reliably label activated caspase-9 and caspase-3 in gentamicin-treated cochleae. Caspase-9 and caspase-3 positive cells appear only in regions of the basilar papilla damaged by gentamicin treatment, confirmed by phalloidin staining of F-actin in hair cell stereocilia. Caspase-labeled cells are not seen in undamaged regions of the sensory epithelium, in control cochleae, or in gentamicin-treated cochleae at 24 h AI (data not shown). Labeling of caspase activation is similar in that the cells labeled for caspase-9 or caspase-3 with either detection method appear as large, bright green spheres (Fig. 1, high magnification images).
Fig. 1.

Confocal images of cochleae labeled for either activated caspase-9 (green) or activated caspase-3 (green) and phalloidin (red) 48 h AI. Both the antibody (left) and the CaspaTag kit (right) reliably label caspase-9 and caspase-3 positive cells. Scale bar = 300 μm. High magnification images of caspase-9 or caspase-3 positive cells labeled with caspase antibodies or CaspaTag can be seen in the bottom row. For both detection methods, the caspase-9 label appears to be weaker than the caspase-3 label. Scale bar = 10 μm.
Another similarity between the two detection methods is that caspase-9 labeling appears to be much weaker than that of caspase-3. With the caspase-directed antibodies, caspase-9 labeling appears much less intense and somewhat grainy, with cells less clearly defined than when labeled for caspase-3 (Fig. 1, left). Additionally, background levels are fairly high for the caspase-9 antibody labeling. Similar to results seen with caspase-directed antibodies, labeling intensity for caspase-9 with the CaspaTag assay kit is weaker than that of caspase-3. While caspase-9 labeling intensity is better with the CaspaTag kit than it is with the antibodies, the label again appears to be more grainy for caspase-9 than it is for caspase-3 (Fig. 1, right).
To determine if there are any differences in the number of hair cells expressing the two caspase isoforms, the number of caspase-9 (n = 7) and caspase-3 (n = 8) labeled cells were counted for samples at 48 h AI. CaspaTag-labeled cochleae were used for quantification, as labeling intensity is slightly better for CaspaTag than it is for caspase-directed antibodies. The mean number of caspase-9 and caspase-3 positive cells can be seen in Fig. 2. The unpaired t-test examining the number of caspase-9 vs. caspase-3 positive cells 48 h AI was not statistically significant (P = 0.6079). This test showed that the difference in the number of caspase-9 and caspase-3 positive cells was not statistically different at 48 h AI.
Fig. 2.

Mean number of CaspaTag-labeled caspase-9 (n = 7) and caspase-3 (n = 8) cells 48 h AI (±SEM). Counts show that the number of caspase-9 and caspase-3 labeled cells is not statistically different at 48 h AI (P = 0.6079).
3.2. Timeline of caspase activation after gentamicin treatment
Previous studies have developed a timeline describing the apoptotic events that occur in avian hair cells following systemic gentamicin treatment. Of particular interest to this study, activation of caspase-3 following a single injection of gentamicin was first observed in the avian basilar papilla approximately 30 h AI and continued until 96 h AI, when caspase-3 labeled cells were no longer seen in cochlear preparations (Mangiardi et al., 2004). This activation of caspase-3 occurred concurrently with the process of hair cell ejection, which began to occur in the sensory epithelium at approximately 36 h AI, with the majority of damaged cells ejected by 48 h AI (Mangiardi et al., 2004; Duncan et al., 2006).
In this study, we were interested in examining the timing of caspase-9 and caspase-3 activation following gentamicin treatment using both caspase-directed antibodies, as well as CaspaTag in situ assay kits. Fig. 3 shows confocal images of basilar papillae labeled for activated caspase-3 (green) using a caspase-directed antibody and co-labeled with phalloidin (red). The montages are representative of cochleae 30, 42, 48, 72, and 96 h AI. Phalloidin labeling shows that hair cell loss begins in the very basal (proximal) tip of the basilar papilla around 30 h AI, and progress esapically (distally) with time, similar to previous results describing gentamicin-induced avian cochlear hair cell damage (Bhave et al., 1995; Janas et al., 1995; Park et al., 1998; Roberson et al., 2000; Mangiardi et al., 2004; Duncan et al., 2006). Caspase-3 activation is first detected between 30 and 42 h AI, corresponding with the time points where hair cell damage and loss are first seen (Fig. 3). By 48 h AI, there are many caspase-3 labeled cells scattered throughout the region of gentamicin-induced hair cell loss. However, there appears to be a decrease in the number of antibody-labeled caspase-3 positive cells 72 h AI, with a maintained lower level of caspase-3 positive cells 96 h AI. This indicates that caspase-3 antibody labeling decreases with time AI, after an initial peak at 48 h. Most hair cells are ejected by 54 h AI, so very few hair cells enter the apoptotic cell death cascade after 48 h AI.
Fig. 3.
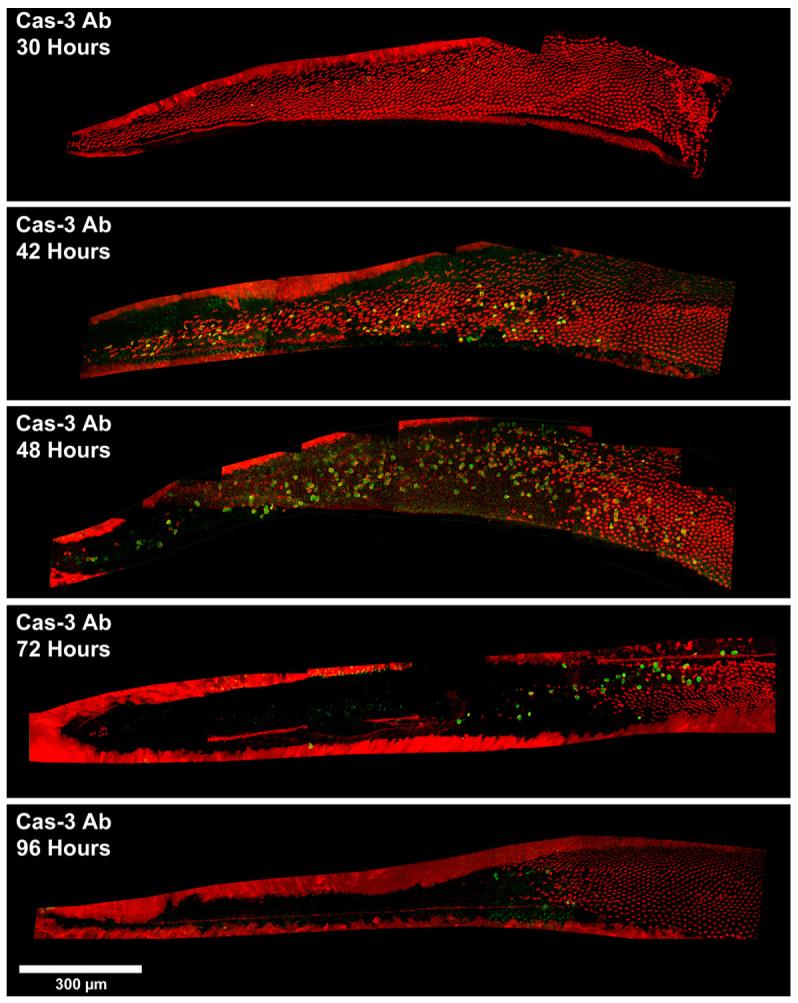
Confocal images of cochleae labeled for activated caspase-3 (green) using a caspase-directed antibody and co-labeled with phalloidin (red). Montages are of cochleae 30, 42, 48, 72, and 96 h AI. Caspase-3 activation is first detected between 30 and 42 h, with many labeled cells present 48 h AI. However, caspase antibody labeling appears to decrease 72 h AI, with a maintained lower level of caspase-3 positive cells 96 h AI. Scale bar = 300 μm.
Confocal images of basilar papillae labeled for activated caspase-3 (green) using a CaspaTag in situ assay kit 30, 42, 48, 72, and 96 h AI can be seen in Fig. 4. Early time points (30, 42, and 48 h AI) are co-labeled with phalloidin (red), while later time points (72 and 96 h) are co-labeled with myosin VI (red). Again, phalloidin and myosin VI labeling shows gentamicin-induced hair cell death beginning in the very basal tip approximately 30 h AI and progressing apically with time. Much like that seen with caspase-directed antibodies, the CaspaTag in situ kit first identifies caspase-3 labeled cells between 30 and 42 h AI. Additionally, as with antibody labeling, CaspaTag labels even more caspase-3 positive cells 48 h AI. This indicates that in early time points following gentamicin treatment (30, 42, and 48 h), CaspaTag detection of caspase-3 activation mirrors the temporal progression seen with caspase-directed antibodies. However, CaspaTag appears to label more caspase-3 positive cells at later time points after gentamicin treatment (72 and 96 h AI). This is in direct contrast to caspase-directed antibodies, which appear to show a decline in the number of caspase-3 positive cells 72 and 96 h AI. Also, many of these 72 and 96 hour CaspaTag-labeled cells are co-labeled with myosin VI (Fig. 4, yellow), and can be seen in the proximal tip, progressing distally. This same labeling pattern is not seen in time-matched antibody-labeled cochleae, as almost 1/3 of the proximal end of the cochlea is completely devoid of hair cells (Fig. 3). This is because the antibody-labeled cochleae have been co-labeled with phalloidin. Phalloidin staining of F-actin in stereocilia is lost 72 h AI (Mangiardi et al., 2004), when dying hair cells have been ejected out of the sensory epithelium. It is thought that caspase-3 activation may result in the breakdown of F-actin or that alterations in structural proteins may occur so that phalloidin no longer recognizes F-actin conformation (Mangiardi et al., 2004). While phalloidin no longer labels these cells, antibodies against hair cell specific myosins VI and VIIa do (Mangiardi et al., 2004; Duncan et al., 2006). The most commonly used and characterized antibodies for myosin VI and VIIa in hair cells are those made by Tama Hasson (Hasson and Mooseker, 1994; Hasson et al., 1995) and now produced commercially by Proteus Biosciences. Unfortunately, these are polyclonal antibodies made in rabbits, as are the caspase-3 and caspase-9 antibodies, thus making co-labeling of the two proteins difficult. Monoclonal antibodies to Myosin VI (Sigma) and Myosin VIIa (Developmental Hybridoma Bank, University of Iowa) are now available, but their ability to label as effectively and at the same time points of cell death and regeneration (Duncan et al., 2006) has not yet been tested in the chick basilar papilla. In contrast, the CaspaTag is a synthetic substrate not produced in rabbits, so we were able to use myosin VI to visualize caspase-labeled cells after they have already been ejected.
Fig. 4.
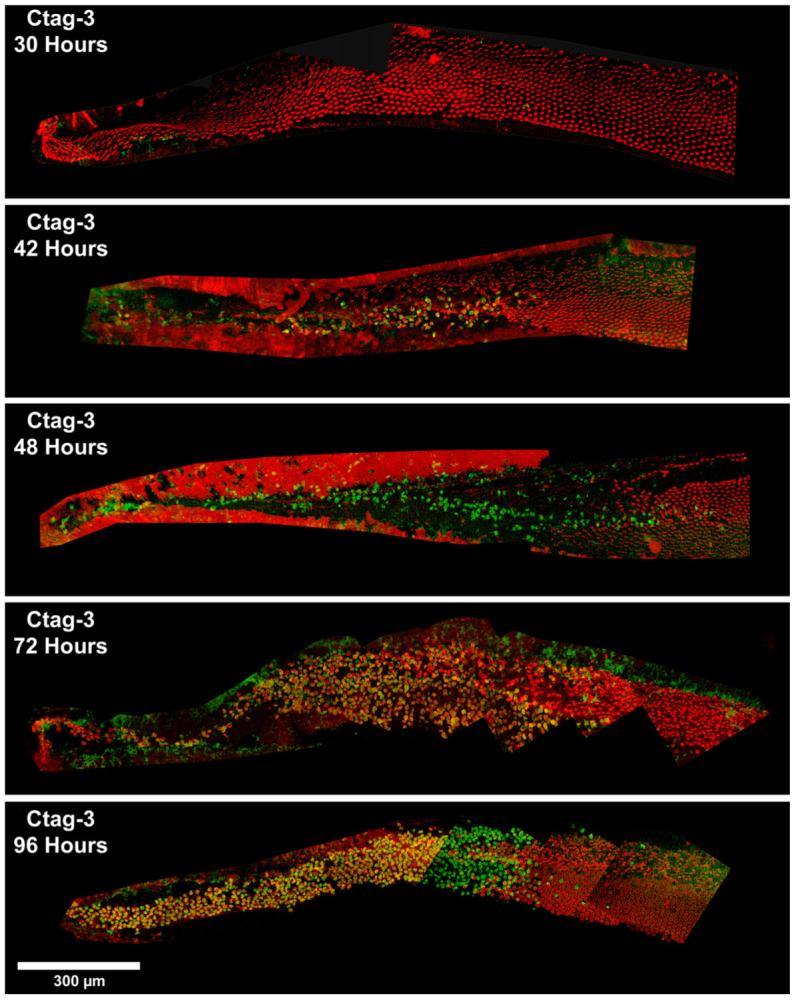
Confocal images of cochleae labeled for activated caspase-3 (green) using a CaspaTag in situ assay kit 30, 42, 48, 72, and 96 h AI. Early time points (30, 42, and 48 h) are co-labeled with phalloidin (red); later time points (72 and 96 h) are co-labeled with myosin VI (red). Overlap of the two labels appears in yellow. The timing of caspase-3 activation using CaspaTag mirrors that seen with caspase-directed antibodies, with labeling first occurring between 30 and 42 h AI. However, the CaspaTag assay appears to label more cells at the later time points, such as 72 and 96 h. Scale bar = 300 μm.
Fig. 5 shows higher magnification images of activated caspase-3 (green) labeled with either antibodies against caspase (top row) or CaspaTag (bottom row) at 48, 72, and 96 h AI. Cochleae were co-labeled with phalloidin (red) in all caspase antibody samples and in CaspaTag 48 h samples, while CaspaTag 72 and 96 h samples were co-labeled with myosin VI. Phalloidin labeling showed redistribution of F-actin on the apical surface to form a crescent-shaped area around the outer edge of the hair cell, previously reported by Mangiardi et al. (2004) to be an indication of the onset of ejection from the sensory epithelium (Fig. 5, all top panels and Ctag 48 h). A similar crescent-shaped pattern can be seen in myosin VI-labeled cochleae as well (Fig. 5, Ctag 72 and 96 h). Most caspase-positive cells also have a crescent-shaped F-actin or myosin VI co-label, indicating that caspase activation occurs just prior to and during the process of ejection from the sensory epithelium (Fig. 5). While few cells are seen in basilar papillae labeled with antibodies against caspase-3 at 72 and 96 h AI, many cells are seen in time-matched cochleae labeled with CaspaTag. This indicates that CaspaTag may be retaining the ability to label activated caspases long after ejection from the sensory epithelium, while antibodies against caspase-3 lose this ability soon after ejection. In previous studies, we have demonstrated that other cytoskeletal proteins (myosin VI, myosin VIIa, and cox1) retain the ability to label dead, ejected hair cells for up to 2 weeks after their ejection (Mangiardi et al., 2004; Duncan et al., 2006), so this observation is not without precedent. In the gentamicin-treated chick cochlea, the ejected hair cells are trapped within the catacombs of the overlying tectorial membrane and remain there for long periods of time (Epstein and Cotanche, 1995; Mangiardi et al., 2004; Duncan et al., 2006).
Fig. 5.

High magnification confocal images of cochleae labeled for activated caspase-3 (green) with either caspase-directed antibodies (top) or CaspaTag (bottom) and co-labeled with phalloidin (red; all Ab and Ctag at 48 h) or myosin VI (red; Ctag at 72 and 96 h). Both assays label caspase-positive cells as they are in the process of being ejected from the sensory epithelium. Scale bar = 75 μm.
While timelines were constructed for both caspase-9 and caspase-3 activation using both detection methods, only the caspase-3 data is presented here. The timelines for caspase-9 and caspase-3 activation are identical; both caspase antibodies and CaspaTag first label hair cells around 30 h AI, with similar numbers of caspase-positive cells seen at 48 h AI. Similar to that described for caspase-3 above, caspase-9 antibodies seem to label fewer cells than CaspaTag-9 at 72 and 96 h AI (data not shown). However, as previously described, the labeling for caspase-9 is weaker than that of caspase-3. Since the primary focus of this paper is to compare detection methods for caspase activation, and caspase-3 labeling is stronger for both antibody and CaspaTag, figures showing the timeline of caspase-9 activation have been omitted.
3.3. Quantification of caspase-3 labeled cells
To determine if there are any differences in the number of hair cells labeled by either caspase-3 directed antibodies or the CaspaTag in situ assay kit, the number of caspase-3 positive cells was counted 48 h (Ab, n = 8; Ctag, n = 8), 72 h (Ab, n = 5; Ctag, n = 5), and 96 h (Ab, n = 5; Ctag, n = 5) AI. The mean number of caspase-3 positive cells seen with either caspase-3 antibodies or the CaspaTag kit is detailed in Fig. 6. A two-way analysis of variance (ANOVA) was performed on these data to examine the number of caspase-3 positive cells in the basilar papilla following gentamicin treatment. This was done in regards to time point (48, 72, and 96 h), detection method (caspase-3 antibodies or CaspaTag kit), and their interaction with each other. The data indicates that the label type has a significant effect on the number of caspase-positive cells at 48, 72, and 96 h AI (P = <0.0001). While the detection method alone is also statistically significant (P = <0.0001), the effect of time point on the number of caspase-3 positive cells was not statistically significant (P = 0.1017). Fig. 6 shows no significant difference in the number of caspase-3 positive cells labeled with caspase antibody vs. CaspaTag at 48 h AI (P = 0.1975). However, there is a positive trend for the number of caspase-3 labeled cells with the CaspaTag kit over time and conversely, a negative trend for those labeled with caspase-3 antibodies. Although the two-way ANOVA failed to show significance in regards to time AI, this trend prompted two separate one-way ANOVAs to be performed based on the different label types. When looked at separately, the effect of time after injection is statistically significant for both caspase antibodies (P = 0.0010) and CaspaTag (P = 0.0010). Fisher’s protected least significant difference (PLSD) test identifies where the differences occur within the times AI for both detection methods. When using caspase antibodies as the detection method, fewer caspase-3 labeled cells are seen 72 h AI (P = 0.0010) and 96 h AI (P = 0.0017), compared to 48 h AI. There is no statistical difference in the number of caspase-3 positive cells between 72 and 96 h AI (P = 0.8051). In contrast, when using CaspaTag as the detection method, more caspase-3 labeled cells are seen 72 h AI (P = 0.0059) and 96 h AI (P = 0.0005), compared to 48 h AI. There is no difference in the number of caspase-3 labeled cells at 72 h vs. 96 h AI (P = 0.2723).
Fig. 6.
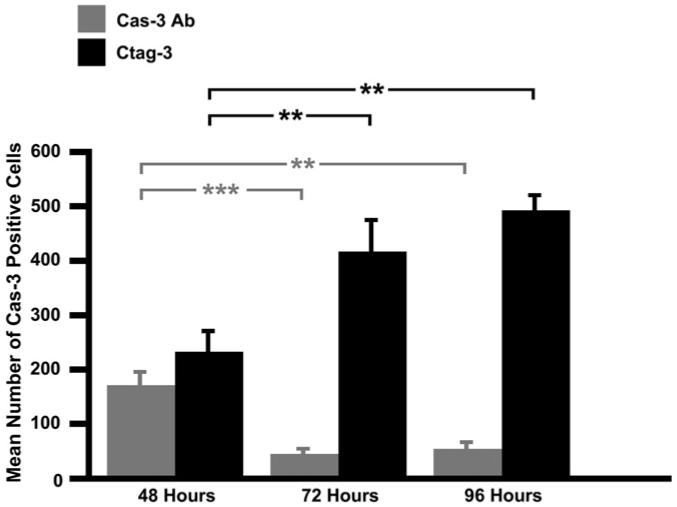
Mean number of caspase-3 positive cells following gentamicin injection (±SEM). Counts of caspase-3 labeled cells show that the two detection methods label similar numbers of cells 48 h AI (P > 0.05). The number of caspase-3 positive cells significantly decreases from 48 to 72 h when labeled with caspase-3 antibodies. Conversely, the number of caspase-3 positive cells significantly increases during this same time period when labeled with CaspaTag-3. (Ab, 48 h n = 8, 72 h n = 5, 96 h n = 5; Ctag, 48 h n = 8, 72 h n = 5, 96 h n = 5) **P < 0.01 ***P < 0.001.
When tested separately, the two detection methods appear to differ in their ability to detect activated caspase-3 at later time points. These results indicate that while both the caspase antibodies and CaspaTag label a similar number of cells up through 48 h AI, the two labeling methods differ in their ability to detect activated caspase-3 72 and 96 h AI, when caspase antibody labeling decreases as CaspaTag labeling increases.
3.4. Effect of CaspaTag incubation time on caspase-3 labeling
Unlike cochleae prepared for caspase antibody labeling, CaspaTag cochleae are unfixed prior to their placement in the CaspaTag substrate. Since the cochleae are incubated in the CaspaTag labeling substrate for 60 min prior to fixation, it is possible that this additional time before fixation allows more caspase-3 to be activated in these cochleae after the time of sacrifice. This could result in an increase in the number of cells labeling positive for activated caspase-3. To determine if longer incubation times in CaspaTag labeling substrate will increase the number of caspase-3 positive cells, cochleae harvested 48 h AI were placed in CaspaTag for different amounts of time and the number of caspase-3 labeled cells was counted. The mean number of caspase-3 labeled cells after 15, 30, or 60 min of incubation in CaspaTag can be seen in Fig. 7.
Fig. 7.

Mean number of caspase-3 labeled cells 48 h AI following different incubation times in CaspaTag (±SEM) Counts of caspase-3 labeled cells after 15 min (n = 7), 30 min (n = 8), or 60 min (n = 8) incubation in CaspaTag are not significantly different (P = 0.2846), indicating that longer incubation in CaspaTag does not yield significantly more caspase-labeled cells.
The one-way ANOVA examining the number of caspase-3 positive cells after 15 min (n = 7), 30 min (n = 8), or 60 min (n =8) of incubation in CaspaTag was not significantly different (P = 0.2846). Thus, statistical evidence suggests that incubation in CaspaTag for 60 min prior to fixation cannot be creating the increase in CaspaTag labeled caspase-3 positive cells in 72 and 96 h time points AI.
4. Summary and discussion
4.1. Summary of results
The purpose of this study was to compare both caspase-directed antibodies and fluorogenic caspase substrates (commercially available as CaspaTag in situ assay kits) as measures of gentamicin-induced apoptotic hair cell death in the avian basilar papilla. To do this, we examined the timing of caspase activation following gentamicin treatment using both detection methods and then counted the number of caspase-labeled cells at three different time points during the cellular death process. Results from this study indicate that there are important similarities, as well as significant differences, between the two detection methods in their capacity to label caspase activation in cochlear hair cells. Both the caspase-directed antibodies and the CaspaTag kits reliably labeled apoptotic cells expressing activated caspase-9 and caspase-3 in the chick basilar papilla. Additionally, the timing of caspase-9 and caspase-3 activation following gentamicin treatment was similar for both detection methods, with activation first observed 30 h AI. However, antibodies against caspase-9 and caspase-3 tended to label only those cells that were currently in the process of apoptotic cell death and ejection from the sensory epithelium. Conversely, CaspaTag-labeled all the cells that have undergone apoptotic cell death and ejection from the sensory epithelium, in addition to those that were currently in the cell death process. This makes CaspaTag ideal for showing an overall pattern or level of cell death over a period of time, while caspase antibodies provide a snapshot of cell death at a specific time point. From these results, we conclude that while both detection methods are useful in detecting apoptotic cell death in the avian cochlea, the two cannot be used interchangeably, particularly in later time points after gentamicin treatment. Thus, one must carefully consider the experimental question at hand in order to determine which detection method is appropriate.
4.2. Timeline of aminoglycoside-induced caspase activation
Many studies have investigated the timeline of specific cellular events in the apoptotic death cascade. The timing of apoptotic events in aminoglycoside-induced hair cell death is of great interest in the avian cochlea, as events in hair cell apoptosis are thought to initiate and regulate regeneration events in the adjacent supporting cells (Stone and Cotanche, 2007). Caspase activation has been of particular interest, as it is these proteases that ultimately result in hair cell degradation. In this study, we found that caspase-directed antibodies and CaspaTag kits can be used to identify aminogylcoside-induced caspase activation. Both detection methods produce a similar timeline of caspase activation following gentamicin administration. Caspase-9 and caspase-3 activation began 30 h AI, when the first caspase-positive labeled cells were seen in the basal tip of the basilar papilla. This corresponded with phalloidin labeling of F-actin that identified the first signs of hair cell damage and ejection in the cochlear base beginning 30 h AI. The number of caspase-positive cells appeared to increase from 42 to 48 h AI, regardless of the caspase detection method used. Both caspase-directed antibodies and CaspaTag continued to label caspase-positive cells at 72 and 96 h AI. However, the two detection methods produced strikingly different labeling patterns in these later time points. These differences will be discussed in more detail in Section 4.4 below.
Previous studies by Mangiardi et al. (2004) have provided a working timeline of several events in hair cell apoptosis in the avian cochlea following systemic gentamicin treatment in vivo. Our current results for caspase-9 activation and CaspaTag detection of both caspase-9 and caspase-3 support this timeline of hair cell apoptosis.
4.3. Activation of caspase-9 vs. activation of caspase-3
Apoptotic cell death is distinguished by the activation of a family of cysteine-aspartate proteases (caspases). Many investigations have determined the location of caspases in the apoptotic cell death cascade in various in vivo and in vitro cells and tissues. Current convention suggests that caspase-9 is located upstream of caspase-3, and, once activated, caspase-9 will signal downstream to activate pro-caspase-3 (Slee et al., 1999a,b; Hengartner, 2000; Robertson and Orrenius, 2002). Furthermore, studies have shown that inhibition of caspase-9 activity will prevent caspase-3 activation in cochlear and vestibular hair cells (Cunningham et al., 2002; Cheng et al., 2003). However, these experiments do not provide direct evidence that caspase-9 is activated prior to caspase-3.
In this set of experiments, we directly examined the activation of caspase-9 and caspase-3 in the avian cochlea following gentamicin treatment. Interestingly, we found that activation of both caspase-9 and caspase-3 occurred at approximately 30 h AI, regardless of the caspase detection method used. Additionally, when the number of caspase-9 and caspase-3 positive cells was counted 48 h AI, no statistical difference was found. These results suggest that caspase-9 activation may not occur prior to caspase-3 activation. To further support this claim, we found no clearly identifiable caspase activation gradients in the avian cochlea following gentamicin treatment. That is, caspase-3 positive cells were not found primarily in the cochlear base (indicating that these cells would have already expressed activated caspase-9 at an earlier time point), nor were caspase-9 positive cells found primarily towards the cochlear apex (indicating that these cells would be ear-marked for caspase-3 activation at a later time point). Cells containing activated caspase-9 or caspase-3 were found in the same regions of the cochlea at the same time points AI. Several factors could account for the apparent simultaneous expression of caspase-9 and caspase-3 seen in this experiment. First, it is possible that once caspases are activated in the cell, they remain so until the time of cellular degradation. Thus, caspase-9 and caspase-3 positive cells are seen together in the same region of the cochlea. Second, caspases may deactivate at some point during the cellular death process. If this hypothesis is true, then the caspase-9 positive cells seen at a given time could actually be additional hair cells entering the cell death cascade, while the caspase-3 positive cells would be hair cells that have already activated and turned off caspase-9 at an early time point. Finally, it is possible that caspase-9 is indeed activated upstream of caspase-3, but this activation may occur very rapidly, so that our detection methods or the timepoints we examined cannot separate the two activation periods. This could create the impression that caspase-9 activation is actually occurring simultaneously to that of caspase-3.
Additionally, we also found an interesting difference in labeling intensity between caspase-9 and caspase-3. Regardless of the detection method used (antibodies vs. CaspaTag), labeling intensity for caspase-3 was greater than that for caspase-9. If caspase-9 is indeed located upstream of caspase-3 in the apoptotic cell death cascade, it possible that the activated caspase-3 signal is amplified compared to that of the activated caspase-9, and thus labels more brightly. In fact, Slee et al. (1999a) suggested that caspase-3 might perform an important role in propagating the caspase cascade. It is also possible that the caspase-3 detection methods just work better than their caspase-9 counterparts. Either of these factors could account for the increase in labeling intensity seen with activated caspase-3.
4.4. Caspase antibodies vs. CaspaTag kits
Many different morphological and biochemical markers have been used to identify apoptotic cell death. Changes in cellular morphology, TUNEL labeling of DNA internucleosomal cleavage, DAPI labeling of nuclear morphology, and activation of cysteine-aspartate proteases (caspases) have all been used by researchers as markers of apoptotic cell death; however, these methods are not without limitations. While changes in cellular morphology, such as cell shrinkage, nuclear and cytoplasmic condensation, and chromatin fragmentation are known to occur during apoptotic cell death, identifying these changes can be somewhat subjective. Wilkins et al. (2001) used morphological evidence of cell death as a marker to determine if apoptotic cell death occurs in the Belgian Waterslager (BWS) canary. The BWS canary basilar papilla is known for being an auditory end organ in which there are abnormal hair cells and ongoing death, proliferation, and regeneration (Wilkins et al., 2001). Some hair cells in the BWS cochlea had very dark staining nuclei and cytoplasm and were identified as showing morphological evidence of cell death. However, identification of fragmented nuclei to confirm apoptotic cell death was not possible, as the dark staining made intracellular structure hard to visualize (Wilkins et al., 2001). Additionally, many hair cells in the BWS papillae were described as having an “abnormal shape,” but they did not contain any grossly discernable cytoplasmic or nuclear evidence of death (Wilkins et al., 2001). Thus, with strict classification of cell death types becoming less and less clear, subtle changes in cellular morphology are becoming less practical as a marker of the initiation of apoptosis.
The TUNEL assay is also limited in its usage as an apoptotic cell death marker. The TUNEL assay relies upon detection of cleaved DNA, which occurs only during a very finite time period in apoptosis. The Wilkins et al. (2001) study also used TUNEL labeling to identify apoptotic cells in the BWS cochlea. The TUNEL assay proved to be even more limited than the morphological criteria, as there were disparities between the results obtained with the two methods. The TUNEL assay labeled far fewer cells (mean = 6) than were detected morphologically (mean = 33) (Wilkins et al., 2001). Additionally, any cells that had already been extruded from the BWS sensory epithelium were TUNEL-negative (Wilkins et al., 2001). From these results, Wilkins et al. (2001) determined that the TUNEL assay may only label a subset of apoptotic cells in the BWS papilla, while the morphological data is more inclusive.
Torchinsky et al. (1999) also used TUNEL labeling to identify apoptotic hair cells in the chicken basilar papilla following gentamicin administration. Similar to the Wilkins et al. (2001) study, Torchinsky et al. (1999) found only a few hair cells could be labeled with the TUNEL technique at any given moment in time. Typically, only between 5 and 7 TUNEL-positive cells were seen in the chicken basilar papilla, although several TUNEL labeled cells could be seen trapped in the tectorial membrane overlying the sensory epithelium (Torchinsky et al., 1999). As with the Wilkins et al. (2001) study, Torchinsky et al. (1999) hypothesized that while apoptosis is a relatively rapid event, the TUNEL labeling method labels dying cells in a very narrow window of the apoptotic cascade.
DAPI labeling of hair cell nuclei can be used to identify condensed and fragmented nuclei (Collins et al., 1997; Torchinsky et al., 1999), but the early stages of this process are hard to distinguish from adjacent normal nuclei. Moreover, nuclear contents in ejected hair cells are degraded after ejection and can no longer be detected by DAPI or To-Pro labels by 72 h AI (Duncan et al., 2006).
Activation of caspases is regarded as a hallmark of the apoptotic cell death cascade. Detecting caspase activation is less subjective in identifying apoptotic cells, as one needs only to look for presence or absence of caspase-positive cells rather than looking for a set of gradual morphological changes. Detection of caspase activation has become a standard method for identifying apoptotic cells, using either antibodies raised against activated caspases or fluorogenic caspase substrates (CaspaTag). However, this study is the first to directly compare the two caspase detection methods in aminoglycoside-induced cochlear hair cell death.
5. Conclusions
From this set of experiments, we determined that caspase antibodies and CaspaTag kits are both very useful tools for studying apoptotic hair cell death. However, the detection method used should be tailored to suit the experimental question at hand. With the ability to label only hair cells that are actively undergoing apoptotic cell death, caspase antibodies are useful in providing a snapshot of cell death at a specific time point. Conversely, CaspaTag is ideal for showing the overall level of hair cell death in a tissue sample, as CaspaTag retains the ability to label all cells that have undergone apoptotic cell death, as well as those that are currently in the cell death process.
Acknowledgements
The authors thank Matthew Kramer, Andrew Kamien, and Dr. Jonathan Matsui for their expert technical assistance, Luke Duncan for help in developing the CaspaTag protocol, and Jeffrey Switchenko, Ph.D. candidate in the Department of Biostatistics, Emory University, for his help with statistical analyses. This work was supported by NIH NIDCD Grants R01 DC01689 (D.A.C.) and F32 DC008235 (C.L.K.) and the Sarah Fuller Fund.
Abbreviations
- TIAR
T-cell restricted intracellular antigen-related protein
- AI
after injection
- HHBSS
HEPES-buffered Hanks’ balanced salt solution
- TBS
Tris-buffered saline
- PBS
phosphate-buffered saline
- ANOVA
analysis of variance
- TUNEL
terminal uridine deoxynucleotidyl transferase nick end labeling
- DNA
deoxyribonucleic acid
- BWS
Belgian waterslager canary
- DAPI
4′6-diamidine-2-phenylindole diHCl
References
- Bhave SA, Stone JS, WRubel E, Coltrera MC. Cell cycle progression in gentamicin-damaged avian cochleas. J. Neurosci. 1995;15:4618–4628. doi: 10.1523/JNEUROSCI.15-06-04618.1995. [DOI] [PMC free article] [PubMed] [Google Scholar]
- Bohne B, Harding G, Lee S. Death pathways in noise-damaged outer hair cells. Hear. Res. 2007;223:61–70. doi: 10.1016/j.heares.2006.10.004. [DOI] [PubMed] [Google Scholar]
- Cheng AG, Cunningham LL, WRubel E. Hair cell death in the avian basilar papilla: characterization of the in vitro model and caspase activation. J. Assoc. Res. Otolaryngol. 2003;4:91–105. doi: 10.1007/s10162-002-3016-8. [DOI] [PMC free article] [PubMed] [Google Scholar]
- Collins J, Schiandi C, Young K, Vesely J, Willingham M. Major DNA fragmentation is a late event in apoptosis. J. Histochem. Cytochem. 1997;45:923–934. doi: 10.1177/002215549704500702. [DOI] [PubMed] [Google Scholar]
- Cryns V, Yuan J. Proteases to die for. Genes Dev. 1998;12:1551–1570. doi: 10.1101/gad.12.11.1551. [DOI] [PubMed] [Google Scholar]
- Cunningham LL, Cheng AG, WRubel E. Caspase activation in hair cells of the mouse utricle exposed to neomycin. J. Neurosci. 2002;22:8532–8540. doi: 10.1523/JNEUROSCI.22-19-08532.2002. [DOI] [PMC free article] [PubMed] [Google Scholar]
- Duncan LJ, Mangiardi DA, Matsui JI, Anderson JK, McLaughlin-Williamson K, Cotanche DA. Differential expression of unconventional myosins in apoptotic and regenerating chick hair cells confirms two regeneration mechanisms. J. Comp. Neurol. 2006;499:691–701. doi: 10.1002/cne.21114. [DOI] [PMC free article] [PubMed] [Google Scholar]
- Epstein JE, Cotanche DA. Secretion of a new basal layer of tectorial membrane following gentamicin-induced hair cell loss. Hear. Res. 1995;90:31–43. doi: 10.1016/0378-5955(95)00141-9. [DOI] [PubMed] [Google Scholar]
- Forge A. Outer hair cell loss and supporting cell expansion following chronic gentamicin treatment. Hear. Res. 1985;19:171–182. doi: 10.1016/0378-5955(85)90121-2. [DOI] [PubMed] [Google Scholar]
- Forge A, Li L. Apoptotic death of hair cells in mammalian vestibular sensory epithelia. Hear. Res. 2000;139:97–115. doi: 10.1016/s0378-5955(99)00177-x. [DOI] [PubMed] [Google Scholar]
- Hasson T, Mooseker MS. Porcine myosin-VI: characterization of a new mammalian unconventional myosin. J. Cell Biol. 1994;127:400–425. doi: 10.1083/jcb.127.2.425. [DOI] [PMC free article] [PubMed] [Google Scholar]
- Hasson T, Heintzelman MB, Santos-Sacchi J, Corey DP, Mooseker MS. Expression in cochlea and retina of myosin VIIa, the geneproduct defective in Usher syndrome type 1B. Proc. Natl. Acad. Sci. USA. 1995;92:9815–9819. doi: 10.1073/pnas.92.21.9815. [DOI] [PMC free article] [PubMed] [Google Scholar]
- Hengartner MO. The biochemistry of apoptosis. Nature. 2000;407:770–776. doi: 10.1038/35037710. [DOI] [PubMed] [Google Scholar]
- Hu B, Henderson D, Nicotera T. Involvement of apoptosis in progression of cochlear lesion following exposure to intense noise. Hear. Res. 2002;166:62–71. doi: 10.1016/s0378-5955(02)00286-1. [DOI] [PubMed] [Google Scholar]
- Janas JD, Cotanche DA, WRubel E. Avian cochlear hair cell regeneration: stereological analyses of damage and recovery from a single high dose of gentamicin. Hear. Res. 1995;92:17–29. doi: 10.1016/0378-5955(95)00190-5. [DOI] [PubMed] [Google Scholar]
- Jiang H, Sha S, Forge A, Schacht J. Caspase-independent pathways of hair cell death induced by kanamycin in vivo. Cell Death Differen. 2006;13:20–30. doi: 10.1038/sj.cdd.4401706. [DOI] [PMC free article] [PubMed] [Google Scholar]
- Li L, Nevill G, Forge A. Two modes of hair cell loss from the vestibular sensory epithelia of the guinea pig. J. Comp. Neurol. 1995;355:405–417. doi: 10.1002/cne.903550307. [DOI] [PubMed] [Google Scholar]
- Mangiardi DA, McLaughlin-Williamson K, May KE, Messana EP, Mountain DC, Cotanche DA. Progression of hair cell ejection and molecular markers of apoptosis in the avian cochlea following gentamicin treatment. J. Comp. Neurol. 2004;475:1–18. doi: 10.1002/cne.20129. [DOI] [PubMed] [Google Scholar]
- Matsui JI, Ogilvie JM, Warchol ME. Inhibition of caspases prevents ototoxic and ongoing hair cell death. J. Neurosci. 2002;22:1218–1227. doi: 10.1523/JNEUROSCI.22-04-01218.2002. [DOI] [PMC free article] [PubMed] [Google Scholar]
- Matsui JI, Haque A, Huss D, Messana EP, Alosi JA, Roberson DW, Cotanche DA, Dickman JD, Warchol ME. Caspase inhibitors promote vestibular hair cell survival and function after aminoglycoside treatment in vivo. J. Neurosci. 2003;23:6111–6122. doi: 10.1523/JNEUROSCI.23-14-06111.2003. [DOI] [PMC free article] [PubMed] [Google Scholar]
- Matsui JI, Gale JE, Warchol ME. Critical signaling events during the aminoglycoside-induced death of sensory hair cells in vitro. J. Neurobiol. 2004;61:250–266. doi: 10.1002/neu.20054. [DOI] [PubMed] [Google Scholar]
- Nakagawa T, Yamane H, Shibata S, Takayama M, Sunami K, Nakai Y. Two modes of auditory hair cell loss following acoustic overstimulation in the avian inner ear. ORL J. Otorhinol. Relat. Spec. 1997;59:303–310. doi: 10.1159/000276961. [DOI] [PubMed] [Google Scholar]
- Nicotera TM, Hu BH, Henderson D. The caspase pathway in noise-induced apoptosis of the chinchilla cochlea. J. Assoc. Res. Otolaryngol. 2003;4:466–477. doi: 10.1007/s10162-002-3038-2. [DOI] [PMC free article] [PubMed] [Google Scholar]
- Park DL, Girod DA, Durham D. Evidence for loss and recovery of chick brainstem auditory neurons during gentamicin-induced cochlear damage and regeneration. Hear. Res. 1998;126:84–98. doi: 10.1016/s0378-5955(98)00157-9. [DOI] [PubMed] [Google Scholar]
- Roberson DW, Alosi JA, Messana EP, Cotanche DA. Effect of violation of the labyrinth on the sensory epithelium in the chick cochlea. Hear. Res. 2000;141:155–164. doi: 10.1016/s0378-5955(99)00218-x. [DOI] [PubMed] [Google Scholar]
- Robertson JD, Orrenius S. Role of mitochondria in toxic cell death. Toxicology. 2002:491–496. doi: 10.1016/s0300-483x(02)00464-x. [DOI] [PubMed] [Google Scholar]
- Slee EA, Adrain C, Martin SJ. Serial killers: ordering caspase activation events in apoptosis. Cell Death Differen. 1999a;6:1067–1074. doi: 10.1038/sj.cdd.4400601. [DOI] [PubMed] [Google Scholar]
- Slee EA, Harte MT, Kluck RM, Wolf BB, Casiano CA, Newmeyer DD, Wang HG, Reed JC, Nicholson DW, Alnemri ES, Green DR, Martin SJ. Ordering the cytochrome c-initiated caspase cascade: hierarchical activation of caspases-2, -3, -6, -7, -8, and -10 in a caspase-9-dependent manner. J. Cell Biol. 1999b;144:281–292. doi: 10.1083/jcb.144.2.281. [DOI] [PMC free article] [PubMed] [Google Scholar]
- Stone JS, Cotanche DA. Hair cell regeneration in the avian auditory epithelium. Int. J. Dev. Neurosci. 2007;51:633–647. doi: 10.1387/ijdb.072408js. [DOI] [PubMed] [Google Scholar]
- Sugahara K, WRubel E, Cunningham LL. JNK signaling in neomycin-induced vestibular hair cell death. Hear. Res. 2006;221:128–135. doi: 10.1016/j.heares.2006.08.009. [DOI] [PMC free article] [PubMed] [Google Scholar]
- Torchinsky C, Messana EP, Arsura M, Cotanche DA. Regulation of p27Kip1 during gentamicin mediated hair cell death. J. Neurocytol. 1999;28:913–924. doi: 10.1023/a:1007082424477. [DOI] [PubMed] [Google Scholar]
- Wilkins HR, Presson JC, Popper AN, Ryals BM, Dooling RJ. Hair cell death in a hearing-deficient canary. J. Assoc. Res. Otolaryngol. 2001;2:79–86. doi: 10.1007/s101620010025. [DOI] [PMC free article] [PubMed] [Google Scholar]