

Abstract
Background
Fatigue and sleep deprivation are important safety issues for long-haul truck drivers.
Methods
We conducted round-the-clock electrophysiologic and performance monitoring of four groups of 20 male truck drivers who were carrying revenue-producing loads. We compared four driving schedules, two in the United States (five 10-hour trips of day driving beginning about the same time each day or of night driving beginning about 2 hours earlier each day) and two in Canada (four 13-hour trips of late-night-to-morning driving beginning at about the same time each evening or of afternoon-to-night driving beginning 1 hour later each day).
Results
Drivers averaged 5.18 hours in bed per day and 4.78 hours of electrophysiologically verified sleep per day over the five-day study (range, 3.83 hours of sleep for those on the steady 13-hour night schedule to 5.38 hours of sleep for those on the steady 10-hour day schedule). These values compared with a mean (±SD) self-reported ideal amount of sleep of 7.1±1 hours a day. For 35 drivers (44 percent), naps augmented the sleep obtained by an average of 0.45±0.31 hour. No crashes or other vehicle mishaps occurred. Two drivers had undiagnosed sleep apnea, as detected by polysomnography. Two other drivers had one episode each of stage 1 sleep while driving, as detected by electroencephalography. Forty-five drivers (56 percent) had at least 1 six-minute interval of drowsiness while driving, as judged by analysis of video recordings of their faces; 1067 of the 1989 six-minute segments (54 percent) showing drowsy drivers involved just eight drivers.
Conclusions
Long-haul truck drivers in this study obtained less sleep than is required for alertness on the job. The greatest vulnerability to sleep or sleep-like states is in the late night and early morning.
Each year, over 110,000 people are injured and more than 5000 are killed in the United States in motor vehicle accidents involving commercial trucks.1 Estimates of the percentage of crashes that are partially or completely attributable to fatigue range from 1 to 56 percent, depending on the data base examined and the level of detail available from crash investigations.2,3
There is increasing public and regulatory interest in the health consequences of fatigue, sleep deprivation, disruption of circadian rhythms, and sleep disorders.4 Driver fatigue was recently judged to be the number-one problem in commercial transportation.5 In 1988, Congress directed the Federal Highway Administration to study driver fatigue and its implications with respect to federal regulations that limit daily and weekly driving times for commercial truckers. The study consisted of 24-hour electrophysiologic and performance monitoring of 80 truck drivers who carried revenue-producing loads (loads carried in the course of their employers’ normal business) and who were working day, night, or irregular shifts on common North American routes. We report on the sleep and drowsiness data from that study.
METHODS
Design of the Study
Driving schedules that represented the most demanding operations permissible were selected from the U.S. and Canadian trucking industries. In both countries the longest time on duty per day (which includes the time spent driving plus all other time at work) for drivers is 15 hours, the shortest off-duty time is 8 hours, and the longest time on duty during a seven-day period is 60 hours. However, drivers can drive only a total of 10 hours without having 8 hours off in the United States and 13 hours without 8 hours off in Canada. We used a parallel-group design to compare four driving schedules, two in the United States and two in Canada. The design and the associated informed-consent form were reviewed and approved by the Federal Highway Administration of the U.S. Department of Transportation and by the Transportation Development Centre of Transport Canada. The trucking companies that contributed trucks and personnel asked not to be identified.
We studied two schedules for the route between St. Louis and Kansas City, Missouri: a “10-hour, steady day schedule” consisted of five trips beginning at 9 a.m. each day, and a “10-hour, advancing night schedule” consisted of five trips, with the first trip beginning at 9:30 a.m. and subsequent trips beginning 2 to 3 hours earlier on each of the following days. We studied two schedules for the route between Toronto and Montreal: a “13-hour, steady night schedule” consisted of four trips beginning at about 11 p.m. each evening, and a “13-hour, delaying evening schedule” consisted of four trips, with the first beginning at 11:30 a.m. and subsequent trips beginning 1 hour later each day. All four schedules involved trucks and drivers engaged in revenue-producing runs between these cities.
Subjects
The subjects were 80 male, licensed commercial drivers, 40 from the United States and 40 from Canada. Twenty were assigned to each schedule. The subjects were recruited through participating trucking companies. The drivers were told the purpose of the study and asked to participate. From among those who volunteered, drivers were selected so that the average age of the drivers on each schedule was similar. All drivers read and signed an informed-consent form that detailed the study procedures. All drivers followed their appointed routes and successfully completed the study. At any time, drivers were free to stop and rest or nap or to withdraw from the study. The drivers had no financial incentive or disincentive to take naps. There was a uniform pay scheme for all drivers, but individual rates of pay varied depending on such factors as seniority and geographic location. The drivers were also compensated for spending their principal sleep periods in our laboratories and for engaging in other study-related tasks.
Data were collected in the United States between June 14 and August 22, 1993, and in Canada between September 27 and December 3, 1993.
Each driver completed a questionnaire on demographic characteristics and sleep habits.6 The items on the questionnaire were similar to those of population-based surveys by the Gallup Organization7 and the American Cancer Society.8 Table 1 summarizes the drivers’ schedules, demographic characteristics, and perceived need for sleep as reported on the questionnaire. The estimate of perceived need for sleep indicated that our sample was representative. Respondents in a Gallup survey of the general population of the United States were asked, “How many hours of sleep do you feel you need each night in order to remain alert during the daytime?” The mean (±SD) was 7.2±1.2 hours.7
Table 1.
Driving Schedules and Characteristics of 80 Long-Haul Truck Drivers.*
| Driving Schedule | Description of Schedule | No. of Drivers | Age | Height | Weight | Body-Mass Index† | Perceived Amount of Sleep Needed‡ |
|---|---|---|---|---|---|---|---|
| yr | cm | kg | hr | ||||
| Steady day | 10 hours of driving beginning at about the same time each morning (9 a.m.) for 5 trips | 20 | 49±8 | 179±5 | 94±13 | 29.2±3 | 7.0±1 |
| Advancing night | 10 hours of driving beginning at 9:30 a.m. on day 1 and2 to 3 hours earlier on each subsequent day for 5 trips | 20 | 44±11 | 181±5 | 99±22 | 30.0±6 | 7.0±1 |
| Steady night | 13 hours of driving beginning at about the same time each evening (11 p.m.) for 4 trips | 20 | 40±11 | 180±8 | 92±16 | 28.6±6 | 6.9±1 |
| Delaying evening | 13 hours of driving beginning at 11:30 a.m. on day 1 and1 hour later on each subsequent day for 4 trips | 20 | 38±7 | 179±8 | 89±14 | 27.9±4 | 7.8±1 |
| All schedules | 80 | 43±10 | 180±5 | 94±17 | 28.9±5 | 7.1±1 |
Plus–minus values are means ±SD.
The body-mass index is calculated as the weight in kilograms divided by the square of the height in meters.
Drivers were asked to respond to the following: “My ideal amount of sleep is X hours.”
The electroencephalogram and eye movements were recorded continuously, yielding over 7500 hours of data.9 Each truck was equipped with an infrared video system that continuously recorded views of the driver’s face and the road ahead and a computer that recorded the truck’s speed and road position and allowed all data to be synchronized. The video recordings were sampled every half-hour, and various judgments were made, including whether the truck was moving and whether the driver appeared drowsy on the basis of drooping eyelids and a bobbing head.10 The results were entered into a relational data base that permitted assessment of episodes in which a driver appeared drowsy while driving in terms of their frequency during the four schedules and their distribution over the day and night.
Polysomnography during Principal Sleep Periods
Each driver determined his own bedtimes and awakening times according to his driving schedule. The principal period of sleep was defined as the longest period of sleep in a 24-hour period. Drivers slept in rooms near their travel routes. During sleep tin electrodes (Oxford Instruments, Abingdon, United Kingdom) were used for central and occipital electroencephalography, assessment of the movements of both eyes, and electromyography of the chin, for polysomnographic scoring.11 Respiratory air flow and effort were also monitored and pulse oximetry was performed. The instruments were hooked up 60 to 90 minutes before the first period of sleep. Bad leads were replaced and respiratory sensors reapplied as needed.
Polysomnographic data were gathered on Oxford Medilog 9000-II recorders12 and subsequently stored on optical disks. Oximetric measurements were processed by Profox software13 and then transferred to optical disks. The data obtained during principal sleep periods were scored on an Oxford 9200 system by experienced technologists using 30-second segments.11 For the sleep variables that we measured, the reliability of scoring and rescoring has previously been shown to exceed 0.90 for individual trained technologists and 0.80 between technologists.14 We ensured that scoring would be consistent by rescoring randomly selected records, having regular staff meetings, and reviewing the data. Although this study was not designed to measure the prevalence of sleep-disordered breathing in commercial drivers, we could identify sleep apnea by the presence of rapid, repeated periods of desaturation (a drop of more than 4 percent in the oxygen saturation value that lasted less than three minutes) on oximetry and scoring polysomnographic records using clinical criteria.15,16
Electrophysiologic Recording during Driving
After the principal periods of sleep, respiratory sensors were disconnected from the drivers and the remaining leads were checked. Scorers were unaware of the drivers’ activity or truck speed and, for finer temporal resolution, used 20-second scoring periods during hours in which drivers were supposed to be awake.11
Statistical Analysis
We examined the frequency distribution of the duration of sleep across all drivers and found that the homogeneity-of-variance assumption was tenable and that the distribution appeared unimodal and nonskewed. Univariate, repeated-measures analysis of variance17 was our basic analytic tool. All reported P values are two-tailed.
RESULTS
The 80 drivers had a total of 400 principal sleep periods (5 for each driver), 200 10-hour trips, and 160 13-hour trips. Over 96 percent of all data points from the principal sleep periods were collected. Our software required all data points, so missing data were replaced with means for the driver in question. The results of analyses of variance that replaced missing data with the grand means rather than means for the subject were similar.
Work and Rest Schedules
The drivers were given only general guidance about when they could rest during their schedules. However, we knew, from model patterns of work and rest, that it was possible to have eight hours off duty on any of the four schedules on most days. We estimated the lengths of time off during all 280 intervals between trips from the departure and return times of the trucks recorded by on-board computers or from our technicians’ notes. There were 33 intervals (12 percent) during which the drivers had less than 8 hours off duty (average time available, 7.4 hours), when they were not involved in job- or study-related matters (10 on the advancing night schedule, 12 on the steady night schedule, and 11 on the delaying evening schedule).
Sleep
The amount of sleep a subject could have was defined by the amount of time spent in bed plus the opportunity for napping. The average length of time spent in bed during principal sleep periods and the number of naps taken are shown in Table 2. Among all drivers, the average time spent in bed was 5.18 hours. There was a significant difference (P<0.001) between schedules, with the shortest times in bed occurring on the steady night schedule and the longest times on the steady day schedule. The younger drivers (average age, 36 years) spent more time in bed (5.34 vs. 5.03 hours, P=0.02) than the older drivers (average age, 50 years).
Table 2.
The Average Time Spent in Bed and the Total Number of Naps Taken during the Study, According to the Age and Schedule of the Drivers.*
| Driving Schedule | Younger Drivers | Older Drivers | All Drivers |
|---|---|---|---|
| All schedules | |||
| Average time in bed (hr) | 5.34 | 5.03† | 5.18 |
| No. of drivers | 40 | 40 | 80 |
| Age (yr) | 36±7 | 50±7 | 43±10 |
| No. of naps | 32 | 31 | 63 |
| Steady day | |||
| Average time in bed (hr) | 5.95 | 5.61 | 5.78‡ |
| No. of drivers | 10 | 10 | 20 |
| Age (yr) | 43±5 | 55±4 | 49±8 |
| No. of naps | 10 | 3 | 13 |
| Advancing night | |||
| Average time in bed (hr) | 5.27 | 4.93 | 5.10‡ |
| No. of drivers | 10 | 10 | 20 |
| Age (yr) | 34±6 | 53±5 | 44±11 |
| No. of naps | 3 | 10 | 13 |
| Steady night | |||
| Average time in bed (hr) | 4.58 | 4.16 | 4.37‡ |
| No. of drivers | 10 | 10 | 20 |
| Age (yr) | 32±6 | 49±7 | 40±11 |
| No. of naps | 11 | 11 | 22 |
| Delaying evening | |||
| Average time in bed (hr) | 5.55 | 5.40 | 5.47‡ |
| No. of drivers | 10 | 10 | 20 |
| Age (yr) | 33±4 | 43±5 | 38±7 |
| No. of naps | 8 | 7 | 15 |
Plus–minus values are means ±SD. A nap was defined as an episode of sleep outside the principal sleep period that could be scored with the use of electrographic criteria. The average age of the younger drivers was 36 years, and the average age of the older drivers was 50 years.
P=0.02 for the difference between age groups.
P<0.001 for the difference with the other driving schedules, by analysis of variance.
The periods of sleep latency (the length of time between turning off the lights and falling asleep) were 19.3 minutes for drivers on the steady day schedule, 12.9 minutes for drivers on the advancing night schedule, 7.4 minutes for drivers on the steady night schedule, and 14.8 minutes for drivers on the delaying evening schedule. The difference between the groups was significant (P<0.001). The overall average period of sleep latency was 13.6 minutes.
The drivers slept for an average of 4.78 hours, or about 2 hours less than their reported average ideal sleep (Table 1). Table 3 shows the duration of sleep according to the four driving schedules and the five principal periods of sleep. There was a significant effect of schedule on the duration of sleep (P<0.001), with the longest average durations (5.38 hours) on the steady day schedule and the shortest (3.83 hours) on the steady night schedule. The period of sleep also had a significant effect (P<0.001): the longest and the shortest sleep durations occurred in first sleep periods. There also was a significant interaction between schedule and sleep period (P<0.001). Although several interpretations are possible, the simplest is that the durations of sleep in periods 2 to 5 are typical of the various schedules, whereas the durations of sleep in period 1 vary because drivers were coming back to work after being off duty for at least 24 hours. The younger drivers slept for an average of 4.94 hours per principal sleep period, as compared with 4.61 hours for older drivers. Although significant (P=0.02), this difference was small and is attributable to the fact that younger drivers spent 0.32 more hours in bed per principal sleep period than older drivers.
Table 3.
Average Duration of Sleep during the Five Principal Sleep Periods, According to the Driving Schedule.*
| Driving Schedule | Period of Sleep | Overall Average | ||||
|---|---|---|---|---|---|---|
| 1 | 2 | 3 | 4 | 5 | ||
| hours of sleep | ||||||
| Steady day | 5.37 | 5.13 | 5.64 | 5.37 | 5.41 | 5.38 |
| Advancing night | 6.36 | 4.54 | 4.73 | 4.35 | 3.85 | 4.76 |
| Steady night | 3.22 | 3.88 | 4.41 | 4.28 | 3.38 | 3.83 |
| Delaying evening | 6.73 | 4.75 | 4.71 | 5.16 | 4.27 | 5.12 |
| Overall average | 5.42 | 4.57 | 4.87 | 4.79 | 4.23 | 4.78 |
There was a significant difference among driving schedules (P<0.001 by analysis of variance). The interaction between driving schedule and period of sleep was also significant (P<0.001).
Sleep efficiency (the ratio of the time asleep to the time spent in bed) exceeded 0.9 for all schedules. Sleep efficiency as well as other measures sensitive to sleep disturbance, such as the number of awakenings during the sleep period, indicated that sleep during principal periods was well consolidated (data not shown).
Naps
A nap was defined as an episode of sleep outside the principal sleep period that could be scored with the use of electrographic criteria. Drivers took 0 to 3 naps per day for a total of 63 naps (Table 2). Neither age nor schedule was predictive of the number of naps.18
Thirty-five drivers took at least one nap. Naps increased the total amount of sleep obtained by an average of 0.45±0.31 hour (range, 0 to 1.63 hours), or 11 percent.
Respiration during Sleep
Pulse oximetry disclosed repeated periods of desaturation in two drivers, who were 49 and 55 years of age. Both were on the steady day schedule. Polysomnography revealed that both drivers had sleep apnea, with 10 to 30 respiratory events per hour. However, the sleep data for these drivers were not substantially different from those of the other drivers.
Drowsiness or Sleep among On-Duty Drivers
To assess the frequency of drowsiness or sleep among drivers while they were driving, we focused on the times when the trucks were traveling faster than 72 km per hour (45 miles per hour), according to computer records. Using the same scoring criteria applied to the principal sleep periods,11 we identified one trip by a 30-year-old driver and one trip by a 25-year-old driver involving a total of seven episodes with electrographic features of drowsiness, such as slow, rolling eye movements and electroencephalographic alpha activity. These episodes qualified as stage 1 sleep.11 Stage 1 sleep, the lightest stage of non–rapid-eye-movement sleep, is characterized by a relatively low voltage, mixed-frequency electroencephalogram with prominent activity in the range of 2 to 7 Hz. There were other episodes of electroencephalographic slowing and slow, rolling eye movements of insufficient duration to be scored as stage 1 sleep.
The 30-year-old driver, who was on the steady night schedule, had five episodes of stage 1 sleep between 11:12 p.m. and 11:53 p.m. (duration, 20 to 520 seconds) during his first trip. The subject had been driving for 10 hours and 15 minutes when the first episode occurred. The 25-year-old driver, who was on the delaying evening schedule, had two stage 1 episodes at 2:24 a.m. (Fig. 1) and 4:38 a.m. (duration, 60 and 80 seconds, respectively) during his fourth trip after 9 hours off duty. The subject had been driving for 2 hours and 3 minutes when the first episode occurred. Neither driver showed evidence of sleep apnea.
Figure 1.
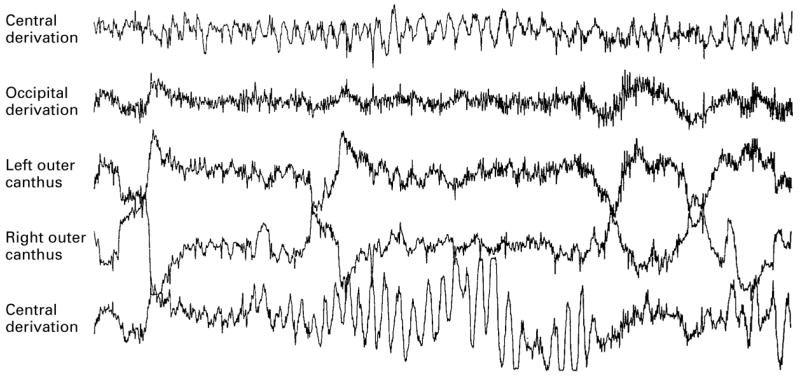
Electrographic Data Showing Sleep-Like Patterns in a 25-Year-Old Driver on the Delaying Evening Driving Schedule. This 20-second segment, recorded while the subject was driving, began at 2:24 a.m. There are slow, rolling eye movements (the large curves on the eye-movement tracings), a high level of alpha activity throughout the occipital tracing, and large peaks and troughs in the middle section of the central tracings, which are known as paroxysmal hypnagogic hypersynchrony.16
Of the total of 29,310 six-minute video recordings of the drivers’ faces that we analyzed, 1989 of the segments (7 percent) were judged to show a drowsy driver. Forty-five of the 80 drivers (56 percent) were judged to be drowsy in at least one segment, but 1067 of the 1989 segments (54 percent) showing drowsy drivers involved just 8 drivers. Five of these drivers were on the steady night schedule, two were on the delaying evening schedule, and one was on the advancing night schedule.
Table 4 shows the number of segments in which drivers were judged to be drowsy according to the driving schedule and time of day. Of the 1989 segments in which the driver was judged to be drowsy, 1646 (83 percent) occurred between 7 p.m. and 6:59 a.m. The average number of consecutive segments in which the driver was judged to be drowsy was 6.44 (range, 1 to 37; mode, 1; median, 4). The driver on the delaying evening schedule whose electroencephalograms showed stage 1 sleep while driving had video records in which he was judged to be drowsy at or near the time when stage 1 was recorded. The other driver in whom stage 1 sleep was recorded did not have any corresponding video records in which he was judged to be drowsy.
Table 4.
Six-Minute Segments of Video Recordings Judged to Show a Drowsy Driver, According to the Time of Day and Driving Schedule.*
| Driving Schedule | 7 a.m. to 6:59 p.m. | 7 p.m to 6:59 a.m. | Total | |||
|---|---|---|---|---|---|---|
| NO. OF SEGMENTS | PERCENT | NO. OF SEGMENTS | PERCENT | NO. OF SEGMENTS | PERCENT | |
| All schedules | ||||||
| Drowsy driver | 343 | 2.19 | 1,646 | 12.06 | 1,989 | 6.79 |
| Total | 15,660 | 13,650 | 29,310 | |||
| Steady day | ||||||
| Drowsy driver | 53 | 1.07 | 47 | 2.63 | 100 | 1.49 |
| Total | 4,940 | 1,785 | 6,725 | |||
| Advancing night | ||||||
| Drowsy driver | 91 | 2.08 | 222 | 8.04 | 313 | 4.38 |
| Total | 4,385 | 2,760 | 7,145 | |||
| Steady night | ||||||
| Drowsy driver | 151 | 4.79 | 739 | 16.37 | 890 | 11.61 |
| Total | 3,150 | 4,515 | 7,665 | |||
| Delaying evening | ||||||
| Drowsy driver | 48 | 1.51 | 638 | 13.90 | 686 | 8.82 |
| Total | 3,185 | 4,590 | 7,775 | |||
The total number of six-minute segments of driving for each entry in the table was used as a denominator. Since the video recordings were sampled every 30 minutes, we estimated the required number by counting, for each entry in the table, the number of these 30-minute sampling periods that occurred while the truck was moving at a normal speed (as opposed to being parked or stopped) and multiplying this number by 5, since 30 minutes equals five 6-minute segments. According to these calculations, there were 29,310 six-minute segments during which a driver could have been judged to be drowsy while driving.
DISCUSSION
Round-the-clock electrographic data were collected for four parallel groups of 20 long-haul truck drivers who were working 10-hour driving schedules in the United States or 13-hour schedules in Canada. Two of the 80 drivers had sleep apnea detected on the basis of polysomnographic criteria. Drivers averaged 5.18 hours in bed and 4.78 hours of sleep per day. This amount of sleep was about two hours less than their reported ideal.
One limitation of our study was that the drivers’ estimates of their ideal amount of sleep were obtained from questionnaires rather than recordings of the men’s sleep when they were not at work. However, only 19.3 percent of a representative sample of men reported sleeping less than five hours a night.7 The sleep durations we did observe were much shorter (4.78 hours) than most standards. Sleep-restriction experiments show that a person’s tendency to fall asleep during normal waking hours increases if he or she has slept less than six hours and also increases with successive days of restricted sleep.19,20 Psychomotor performance is impaired if sleep is limited to five hours for two or more consecutive nights.19,21 It is also known that getting fewer hours of sleep leads to inattention and increased error rates and that little sleep and circadian influences act synergistically.22 Night driving after relatively little sleep is a better predictor of fatigue-related accidents than is night driving alone.23 An analysis of accidents involving commercial trucks found that drivers in fatigue-related accidents had slept an average of 5.5 hours during their last sleep period, as compared with 8.0 hours of sleep for drivers in non–fatigue-related accidents.23
Another limitation of our study is related to sample size. Since we used a parallel-groups design, each driver could not be studied on all schedules. Nevertheless, the demographic characteristics and ideal sleep times reported by the drivers indicated that the four groups were comparable. The short times spent in bed, found in all schedules, are disturbing and are attributable in part to driver choice. Our study required no more than 50 to 60 minutes of the drivers’ time per day, and over 88 percent of all intervals between trips still allowed an opportunity for 8 hours off duty. Possible reasons for such short times in bed include duty-related demands, involvement in social activities, and time-of-day effects, which reduce one’s inclination to go to bed during daylight.
The short durations of sleep — the inevitable result of short times in bed — probably explain the findings suggesting that the drivers got too little sleep. We found high rates of sleep efficiency (the ratio of the time asleep to the time spent in bed), an observation that is consistently reported in sleep-restriction studies24 and indicates an increased tendency to sleep. Thirty-five of the 80 drivers took naps, which averaged 0.45 hour and augmented the amount of sleep obtained by 11 percent. Two drivers had episodes of stage 1 sleep while driving.
O’Hanlon and Kelley also found sleep-like patterns in electroencephalograms of subjects who were driving.25 In our study, the episodes of stage 1 sleep occurred while the subjects were driving between 11 p.m. and 5 a.m., suggesting a circadian influence. The observed nighttime increase in drowsiness, as assessed by analysis of video recordings of the drivers’ faces, was consistent with the expected effects of circadian influences, decreased stimuli during night driving, and too little sleep.
On the basis of available rates of accidents severe enough to be reported to the Department of Transportation,1,26 and making no adjustments for roads and schedules, one would expect one accident involving a combination truck (a tractor pulling one or more trailers) about every 1.9 million km (1.2 million miles). During this study the trucks involved were driven about 327,000 km (204,000 miles). Thus, we did not expect an accident, and in fact, none occurred. Since no episode of sleep-like electroencephalographic patterns was associated with a crash, the drivers were probably drowsy during these episodes but not actually asleep. During normal sleep, there is marked unresponsiveness to stimuli27 that would preclude safe driving. Thus, it may not be correct to use standard sleep-scoring criteria for records obtained when the subject is behaviorally active as opposed to lying in bed.28
Truck drivers in the study obtained less sleep than is required for alertness on the job and the greatest vulnerability to unwanted sleep or sleep-like states was during the late night and early morning, a finding that is consistent with published data on other industries.29 Other studies have shown a smaller midafternoon period of vulnerability to unwanted sleep.30,31 We may have missed detecting such a period because there was considerable irregularity in the times that drivers were on duty and there were only 20 drivers on any one schedule.
Since physicians are a primary source of information about fitness for duty and its relation to sleep, they should be alert to the possibility of sleep deprivation in people who engage in shift work. It is also important to recognize the deleterious synergistic effects on alertness of alcohol and other sedatives in the presence of sleep deprivation or medical conditions known to increase the tendency to fall asleep, such as sleep apnea.32–34 Our findings underscore the need to educate workers and schedulers about the importance of adequate sleep with respect to public safety.
Acknowledgments
Supported by contracts (DTFH61-89-C-096 to Essex Corporation and DTFH61-90-C-053 to the Trucking Research Institute) with the Federal Highway Administration, with subcontracts to the Scripps Clinic. Mr. Wylie was employed by Essex Corporation at the time of the study.
We are indebted to Ted Shultz and Joseph Assmus for expert technical assistance, and to J. Christian Gillin, M.D., at the University of California, San Diego, for editorial assistance.
Footnotes
The views expressed in this article are solely those of the authors.
References
- 1.Center for National Truck Statistics. Truck and bus accident factbook 1994. (Report no. UMTRI-96-40) Washington, D.C: Federal Highway Administration Office of Motor Carriers; 1996. [Google Scholar]
- 2.Knipling RR, Wang J. Crashes and fatalities related to driver drowsiness/fatigue: research note. Washington, D.C: National Highway Traffic Safety Administration; 1994. [Google Scholar]
- 3.Treat JR, Tumbas NS, McDonald ST, et al. Tri-level study of the causes of traffic accidents. [Publication no. DOT-HS-034-3-535-77 (TAC).] Indiana University; 1979. [Google Scholar]
- 4.National Institutes of Health. The National Sleep Disorders Research Plan. Bethesda, Md: National Center for Sleep Disorders Research; 1996. [Google Scholar]
- 5.1995 Truck and Bus Safety Summit: report of proceedings. Kansas City, Mo: Department of Transportation; 1995. [Google Scholar]
- 6.Douglass AB, Bornstein R, Nino-Murcia G, et al. The Sleep Disorders Questionnaire. I. Creation and multivariate structure of SDQ. Sleep. 1994;17:160–7. doi: 10.1093/sleep/17.2.160. [DOI] [PubMed] [Google Scholar]
- 7.Sleep in America II. Princeton, N.J: Gallup Organization; 1997. [Google Scholar]
- 8.Kripke DF, Simons RN, Garfinkel L, Hammond EC. Short and long sleep and sleeping pills: is increased mortality associated? Arch Gen Psychiatry. 1979;36:103–16. doi: 10.1001/archpsyc.1979.01780010109014. [DOI] [PubMed] [Google Scholar]
- 9.Miller JC. Batch processing of 10,000 h of truck driver EEG data. Biol Psychol. 1995;40:209–22. doi: 10.1016/0301-0511(95)05114-7. [DOI] [PubMed] [Google Scholar]
- 10.Wylie D, Miller JC, Shultz T, Mitler MM, Mackie RR. Commercial driver fatigue, loss of alertness, and countermeasures. Washington, D.C: Department of Transportation; 1996. [Google Scholar]
- 11.Rechtschaffen A, Kales A, editors. A manual of standardized terminology, techniques and scoring system for sleep stages of human subjects. (NIH publication no. 204) Bethesda, Md: National Institute of Neurological Diseases and Blindness; 1968. [Google Scholar]
- 12.Rosekind MR, Graeber RC, Dinges DF, et al. IX. Effects of planned cockpit rest on crew performance and alertness in long-haul operations. Moffett Field, Calif: NASA Ames Research Center; 1994. Crew factors in flight operations. [Google Scholar]
- 13.Timms RM, Dawson A, Taft R, Erman M, Mitler MM. Oxygen saturation by oximetry: analysis by microcomputer. J Polysomnogr Technol. 1988 Spring;:13–21. [Google Scholar]
- 14.Lessnau J, Erman M, Mitler M. Scoring reliability among the sensor-medics Somnostar system and two experienced polysomnographic technologists. Sleep Res. 1991;20:430. [Google Scholar]
- 15.Guilleminault C, editor. Sleeping and waking disorders: indications and techniques. Menlo Park, Calif: Addison–Wesley; 1982. [Google Scholar]
- 16.Walczak T, Chokroverty S. Electroencephalography, electromyography and electrooculography: general principles and basic technology. In: Chokroverty S, editor. Sleep disorders medicine: basic science, technical considerations, and clinical aspects. Boston: Butterworth–Heinemann; 1994. pp. 95–117. [Google Scholar]
- 17.Winer BJ. Statistical principles in experimental design. New York: McGraw-Hill; 1962. [Google Scholar]
- 18.Siegel S. Nonparametric statistics for the behavioral sciences. New York: McGraw-Hill; 1956. [Google Scholar]
- 19.Carskadon MA, Dement WC. Cumulative effects of sleep restriction on daytime sleepiness. Psychophysiology. 1981;18:107–13. doi: 10.1111/j.1469-8986.1981.tb02921.x. [DOI] [PubMed] [Google Scholar]
- 20.Idem. Nocturnal determinants of daytime sleepiness. Sleep. 1982;5(Suppl 2):S73–S81. doi: 10.1093/sleep/5.s2.s73. [DOI] [PubMed] [Google Scholar]
- 21.Wilkinson RT, Edwards RS, Haines E. Performance following a night of reduced sleep. Psychonomic Sci. 1966;5:471–2. [Google Scholar]
- 22.Fröberg JE. Sleep deprivation and prolonged working hours. In: Folkard S, Monk TH, editors. Hours of work: temporal factors in work scheduling. Chichester, England: John Wiley; 1985. pp. 67–75. [Google Scholar]
- 23.Factors that affect fatigue in heavy truck accidents. Vol. 1. Analysis. (Safety study no. NTSB/SS-95/01) Washington, D.C: National Transportation Safety Board; 1995. [Google Scholar]
- 24.Bonnet MH. Sleep deprivation. In: Kryger M, Roth T, Dement WC, editors. Principles and practice of sleep medicine. Philadelphia: W.B. Saunders; 1991. pp. 50–67. [Google Scholar]
- 25.O’Hanlon JF, Kelley GR. Comparison of performance and physiological changes between drivers who perform well and poorly during prolonged vehicular operation. In: Mackie RR, editor. Vigilance: theory, operational performance, and physiological correlates. New York: Plenum Press; 1977. pp. 87–110. [Google Scholar]
- 26.Gross M, Feldman RN. National transportation statistics 1996. (Publication no. DOT-BTS-VNTSC-95-4) Cambridge, Mass: Volpe National Transportation Systems Center; 1995. [Google Scholar]
- 27.Carskadon MA, Dement WC. Normal human sleep: an overview. In: Kryger MH, Roth T, Dement WC, editors. Principles and practice of sleep medicine. 2. Philadelphia: W.B. Saunders; 1994. pp. 16–25. [Google Scholar]
- 28.Torsvall L, Åkerstedt T. Sleepiness on the job: continuously measured EEG changes in train drivers. Electroencephalogr Clin Neurophysiol. 1987;66:502–11. doi: 10.1016/0013-4694(87)90096-4. [DOI] [PubMed] [Google Scholar]
- 29.Mitler MM, Carskadon MA, Czeisler CA, Dement WC, Dinges DF, Graeber RC. Catastrophes, sleep, and public policy: consensus report. Sleep. 1988;11:100–9. doi: 10.1093/sleep/11.1.100. [DOI] [PMC free article] [PubMed] [Google Scholar]
- 30.Dinges DF, Broughton RJ, editors. Sleep and alertness: chronobiological, behavioral and medical aspects of napping. New York: Raven Press; 1989. [Google Scholar]
- 31.Mitler MM, Miller JC. Methods of testing for sleeplessness. Behav Med. 1996;21:171–83. doi: 10.1080/08964289.1996.9933755. [DOI] [PMC free article] [PubMed] [Google Scholar]
- 32.Roehrs T, Zwyghuizen-Doorenbos A, Knox M, Moskowitz H, Roth T. Sedating effects of ethanol and time of drinking. Alcoholism Clin Exp Res. 1992;16:553–7. doi: 10.1111/j.1530-0277.1992.tb01416.x. [DOI] [PubMed] [Google Scholar]
- 33.Roehrs T, Claiborue D, Knox M, Roth T. Effects of ethanol, diphenhydramine, and triazolam after a nap. Neuropsychopharmacology. 1993;9:239–45. doi: 10.1038/npp.1993.60. [DOI] [PubMed] [Google Scholar]
- 34.Findley L, Unverzagt M, Guchu R, Fabrizio M, Buckner J, Suratt P. Vigilance and automobile accidents in patients with sleep apnea or narcolepsy. Chest. 1995;108:619–24. doi: 10.1378/chest.108.3.619. [DOI] [PubMed] [Google Scholar]