Abstract
MALDI tissue profiling and imaging have become valuable tools for rapid, direct analysis of tissues to investigate spatial distributions of proteins, potentially leading to an enhanced understanding of the molecular basis of disease. Sample preparation methods developed to date for these techniques produce protein expression profiles from predominantly hydrophilic, soluble proteins. The ability to obtain information about the spatial distribution of integral membrane proteins is critical to more fully understand their role in physiological processes, including transport, adhesion, and signaling. In this communication, a sample preparation method for direct tissue profiling of integral membrane proteins is presented. Spatially resolved profiles for the abundant lens membrane proteins aquaporin 0 (AQP0) and MP20, and the retinal membrane protein opsin, were obtained using this method. MALDI tissue profiling results were validated by analysis of dissected tissue prepared by traditional membrane protein processing methods. Furthermore, direct tissue profiling of lens membrane proteins revealed aged related post-translational modifications, as well as a novel modification that had not been detected using conventional tissue homogenization methods.
INTRODUCTION
Matrix-assisted laser desorption ionization (MALDI) mass spectrometry (MS) has become an important tool for proteomic analysis because it offers a rapid method for examining proteins and peptides with high sensitivity over a large mass range [1–4]. Recently, methods have been developed to use MALDI MS in the analysis of proteins and peptides directly from tissue sections [4–7]. These methods include both profiling - analysis of the spatial distribution of proteins and peptides from discrete locations on a tissue surface, and imaging - analysis of the spatial distribution of proteins and peptides throughout an entire tissue surface [7, 8]. Both tissue profiling and imaging have provided a way to examine proteins not only in their native location but also unaffected by traditional processing methods such as extraction, homogenization, and separation [8].
MALDI tissue profiling and imaging have been increasingly used to compare disease with non-disease tissue in order to determine potential disease biomarker proteins [4, 6, 7, 9, 10]. Yanagisawa et al. (2003) profiled resected non-small-cell lung tumors and were able to accurately distinguish histological tumor groups based on protein patterns, as well as to predict survival [10]. Additionally, a study that utilized MALDI tissue profiling to analyze human brain tissue and gliomas, demonstrated the ability of this technique to distinguish healthy tissue from tumor tissue and to accurately classify different grades of tumors [11]. Mouse brain sections have also been imaged using MALDI MS, and the results showed that protein distributions change among three anatomical regions: the corpus callosum, the striatum, and the cerebral cortex [6]. Moreover, when GL261 brain cancer cells were injected into mouse brain and allowed to grow, images of subsequently sectioned brain tissues revealed differences in tumor versus non-tumor areas, with histones distinctly marking tumor location [6].
MALDI tissue profiling and imaging have also been employed to study the molecular basis of physiological changes [5, 12] and the localization of drugs [4–8]. One study profiled and imaged regional protein changes throughout the mouse epididymus to advance the understanding of the processes involved in spermatozoa development [12]. Furthermore, MALDI MS tissue profiling and MALDI MS/MS tissue imaging were used to detect erlotinib in liver, spleen, and muscle tissue, and its distribution throughout liver and spleen sections [13]. MALDI imaging mass spectrometry (IMS) was also used to map the distribution of the lens soluble α-crystallins, revealing differential distributions of two α-crystallin subunits and their modified forms [14].
Although the use of MALDI tissue profiling and imaging of proteins has been and continues to be highly valuable, these techniques have been limited to the analysis of hydrophilic, soluble proteins [5, 8, 12] and thus, they omit a key part of the proteome, i.e. the hydrophobic integral membrane and membrane-associated proteins. Although sample preparation methods have been developed for the analysis of hydrophobic proteins [15–18], these methods have not been applied in imaging or profiling experiments. In this communication, a method is presented for the profiling of integral membrane proteins directly from thin tissue sections.
EXPERIMENTAL
Materials
Bovine lenses, and rabbit and pig eyes were obtained from Pel-Freeze Biologicals (Rogers, AR). Rat lenses were obtained from a Sprague Dawley rat (disease and treatment free, sacrificed with isofluorane) courtesy of Dr. Haujie Zhu, Laboratory of Drug Disposition and Pharmacogenetics, Medical University of South Carolina. TBS Tissue Freezing Medium was obtained through Triangle Biomedical Sciences (Durham, NC). HPLC grade water and acetonitrile, trifluoroacetic acid, urea, and ammonium citrate were all purchased through Fisher Scientific (Suwanne, GA); hexafluoroisopropanol, formic acid, 2,5-dihydroxybenzoic acid (DHB), and 3,5-dimethoxy-4-hydroxycinnamic acid matrix (sinapinic acid, SA) were purchased from Sigma-Aldrich (St. Louis, MO).
Tissue Sectioning
Bovine lenses (1–2 yrs) were received frozen. Rabbit (1–3 yrs), pig (2+ years), and rat eyes (7 months) were received fresh on wet ice; lenses, and regions of pig posterior ocular globe with attached retinal tissue were dissected from the eyes and frozen at −80 °C prior to sectioning. During lens sectioning, the posterior pole of each lens was bound to a chuck using TBS Tissue Freezing Medium. Lenses were sectioned equatorially starting from the anterior pole moving inward toward the equator at a temperature of −20 °C to −21 °C and at a thickness of 20 µm, using a Microm HM 550 cryostat (Walldorf, Germany). Sections used for analysis were taken from the equator region of the lens and transferred to conductive glass slides (Bruker Daltonics, Bremen Germany) covered with a thin layer of anhydrous ethanol. The anhydrous ethanol was used to fix the tissue and to prevent lens sections from cracking when landing on the slide [14]. Lens sections were prepared and analyzed immediately after sectioning or placed in a container, wrapped in parafilm, and frozen at −20 °C until used. For retinal preparations, tissue was mounted in the cryostat such that the outer surface of the retina faced up, and 12 µm thick sections were collected and stored as above.
MALDI Tissue Profiling
Tissue sections were thawed in a parafilm sealed dish at room temperature and then submerged in a water bath for 6 minutes (bovine, rabbit, pig lens, and pig retina) or 7.5 minutes (rat lens). Once removed from the bath, sections were allowed to completely dry at room temperature. For lens profiling, a gel loading tip was used to manually spot less than 0.25 µl of 7:3 formic acid:hexafluoroisopropanol (FA:HFIP), followed by 4–6 drops of less than 0.15 µl of saturated sinapinic acid (SA) matrix in 90% MeCN, 0.1% TFA. For retina profiling, 0.5 µl of FA:HFIP solution was applied manually, immediately followed by 2 drops of 0.5 µl 2,5-dihydroxybenzoic acid (DHB) matrix in 70% MeCN, 0.1% TFA. To investigate the effect of washing and of the 7:3 FA:HFIP treatment, some sections were washed but not treated with 7:3 FA:HFIP, while some were not washed and spotted with 7:3 FA:HFIP, and some received no treatment before application of the above matrix.
Lens Dissection and Homogenization
Whole, frozen bovine lenses were removed from −80 °C and placed on dry ice. The lenses were decapsulated by briefly running them under cold dI water. Lenses were kept on dry ice and manually dissected into four regions: outer cortex, inner cortex, outer core, and core. Each lens region was placed in a separate tube and covered with 500 µl of cold homogenization buffer: 500 mM NH4HCO3 (pH 8), 5 mM EDTA, 10 mM NaF. (Note that the large core region was divided into two tubes to obtain better homogenization). Tissue was homogenized manually with a Teflon pestel and covered with another 500 µl of homogenization buffer. Each tube was centrifuged at 109,000 × g for twenty minutes at 4 °C, and the supernatant was removed. The pellets were washed in 1 mL of 4M urea, 7M urea (x2), 10% formic acid in water (x2), and water (x2) for twenty minutes at the above conditions. After the final wash, the pellets were suspended in 1 mL of ethanol for delipidation and stored at −20 °C overnight. Each sample was centrifuged at 109,000 × g for twenty minutes at 4 °C. Finally, pellets were washed three times with water, and an amount equal to one twelfth of lens material was removed from each region. The aliquot was spun at 16,100 × g for 2 minutes and the supernatant was removed.
Lens Homogenate Profiling
Immediately prior to spotting, aliquotted pellets were resuspended in 3 µl of 7:3 FA:HFIP Sample, 0.5 µl, was mixed with 1.5 µl of saturated sinapinic acid matrix in 70% MeCN, 0.1% TFA. The sample/matrix mixture (0.5 µl) was spotted onto a MALDI plate
Mass Spectrometry
Lens sections and homogenates were analyzed using a Bruker Autoflex III TOF mass spectrometer (Bruker Daltonics), whereas retinal sections were analyzed using a Bruker Autoflex III TOF/TOF mass spectrometer (Bruker Daltonics). The instruments were operated in positive ion, linear mode and the data were manually acquired with either 350 shots/spectrum for lens sections and homogenates, or 2000 shots/spectrum for retina using the Autoflex Control III software. Autoflex Analysis III software was used to process the data for peak detection; however, post-acquisition smoothing and baseline subtraction were not performed. Samples were calibrated using Bruker protein calibration standard 1 (bovine insulin, equine cytochrome C, bovine ubiquitin I, equine myoglobin, Bruker Daltonics) or calibration mixture 3 (bovine insulin, E. coli thioredoxin, equine apomyoglobin) of the Applied Biosystems Sequazyme Peptide Mass Standards Kit (Applied Biosystems, Foster City, CA).
RESULTS AND DISSCUSSION
Much of the MALDI MS tissue profiling accomplished to date has been selective for abundant, soluble proteins [6, 7]. Many studies use a concentrated sinapinic acid matrix in 50% MeCN, 50% H2O, 0.1% TFA solution [4, 6–8]. This matrix and solvent composition has been found to produce the best crystallization and highest quality spectra [8] as it promotes co-crystrallization of soluble proteins with the matrix, leading to their detection by the mass spectrometer [6, 7]. Yet, the ability to also profile membrane proteins will provide a more complete knowledge of the spectrum of protein expression in a given tissue.
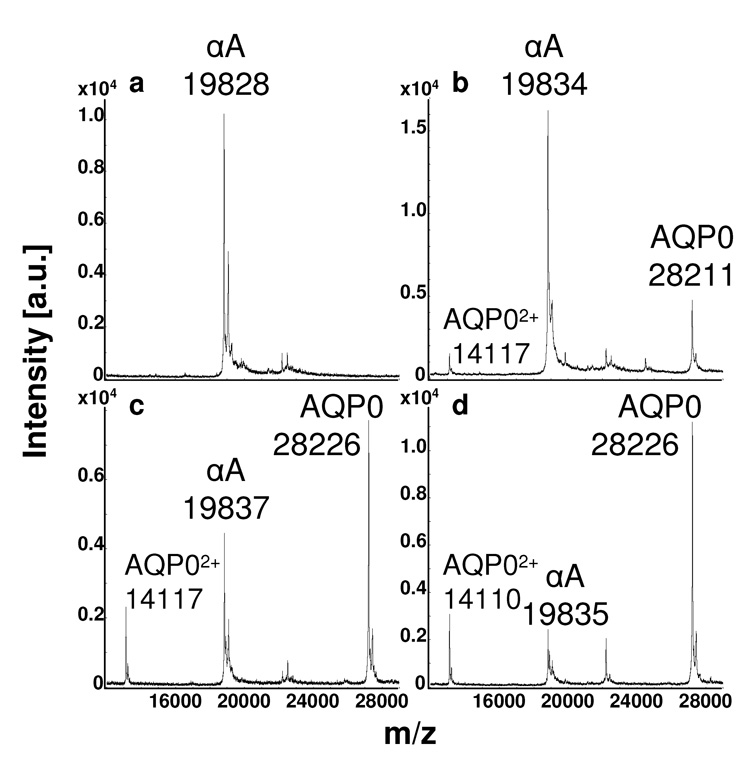
Therefore, to develop a sample preparation protocol for direct tissue profiling of membrane proteins, washing conditions were optimized for the removal of hydrophilic proteins and matrix solvent was selected for solubilization of hydrophobic proteins. Lens tissue sections of 20 µm thickness were submerged in a water bath to remove abundant lens crystallin proteins which, under standard MALDI conditions, produce large signals between 19 and 24 kDa. It was found that washing the tissue surface was essential for the removal of these abundant soluble proteins, which otherwise suppressed ion signals from the most abundant lens membrane protein, aquaporin 0 (AQP0, 28 kDa). Several washing solutions, composed of varying concentrations of formic acid, were tested, but HPLC grade water was found to produce the best results in terms of signal and resolution of the integral membrane proteins. After washing, the tissue was allowed to dry completely and then spotted with 7:3 FA:HFIP to improve solubilization of the membrane proteins and to aid their co-crystallization with the matrix [7, 15]. Figure 1 illustrates the optimization of profiling conditions from the outer cortical region of bovine lens sections. Note that prior to washing the dominant signal is the cytosolic protein αA crystallin at a mass to charge ratio (m/z) of 19,828 (Fig 1a). Application of 7:3 FA:HFIP to an unwashed lens section improves the signal for AQP0 at m/z 28,211 (Fig 1b), most likely by enabling its solubilization and therefore, co-crystallization with the matrix [6, 7]. However, the dominant signal in this spectrum is still αA crystallin. Following a water wash, much of the crystallin signal has been eliminated, and the signal for the membrane protein AQP0 at m/z 28,226 dominates the spectrum (Fig 1c). The combination of the water wash and application of 7:3 FA:HFIP reduces the crystallin signal and promotes solubilization of AQP0, yielding optimized signal for this membrane protein at m/z 28,226 (Fig 1d). Supplementary figure 1 illustrates the optimized effect of the water wash with the application of 7:3 FA:HFIP by comparing washed bovine sections profiled with or without applicaton of 7:3 FA:HFIP in six regions from the outer cortex to the core. See Table 1 for a list of the expected masses of the [M+H]+ ions of the proteins profiled. During method development, six matrix solutions were tested, including either saturated DHB in a solution of 50, 70, 80, or 90% MeCN, 0.1% TFA, or saturated SA in 70 or 90% MeCN, 0.1% TFA, with or without ammonium citrate. Saturated SA matrix in 90% MeCN, 0.1% TFA produced the best spectra with respect to high signal to noise ratio, low baseline, and resolved ion signals.
Figure 1.
MALDI tissue profiles of the outer cortex from bovine lens sections that were: a) unwashed and spotted without 7:3 FA:HFIP, b) unwashed and spotted with 7:3 FA:HFIP, c) washed with water and spotted without 7:3 FA:HFIP, or d) washed with water and spotted with 7:3 FA:HFIP. Application of 7:3 FA:HFIP prior to matrix deposition promotes solubilization of the membrane protein AQP0, and washing the tissue with water removes the signals due to soluble crystallin proteins (19–24 kDa), which would otherwise suppress the signal of AQP0. “αA” represents αA crystallin 1-173; AQP0 represents AQP0 1-263.
Table 1.
Expected masses of [M+H]+ ions of proteins observed in MALDI tissue profiling. Molecular weights of the proteins were obtained from Swiss-Prot/TrEMBL database (ExPASy Proteomics server) or the amino acid sequence was obtained from the NCBI protein database and entered into Peptide Mass (ExPASy Proteomics server) to determine the molecular weight. The accession numbers used for AQP0 were: ABO41863 (rabbit), NP_001099189 (rat), and P06624 (bovine). The accession numbers used for MP20 were: NP_001093432 (rabbit), and P20274 (bovine). Those used for αA crystallin were: P02493 (rabbit), NP_036666 (rat), and P02470 (bovine). A solid line indicates that the protein was not observed experimentally.
| Expected [M+H]+ of Profiled Lens Proteins | |||
|---|---|---|---|
| Rabbit | Rat | Bovine | |
| AQP0 | |||
| 1-263 | 28172 | 28210 | 28224 |
| 1-263P | 28252 | — | 28304 |
| 1-260 | 27859 | 27897 | — |
| 1-253 | 27063 | 27101 | — |
| 1-250 | 26847 | 26885 | — |
| 1-238 | 25651 | 25689 | — |
| 1-234 | 25210 | 25248 | — |
| MP20 | |||
| 1-173 | 19597 | — | 19685 |
| 1-173P | 19677 | — | 19765 |
| αA | |||
| 1-173 | 19880 | 19835 | 19833 |
| 1-173P | — | — | 19913 |
Using optimized conditions, regional profiles of the most abundant lens membrane protein AQP0 [19–21] were obtained by MALDI MS profiling. Signal for MP20 (20 kDa), the second most abundant membrane protein [22], was also seen in rabbit lens sections. The highest spatial resolution achieved was approximately 0.1 cm, which permitted profiling of five distinct lens regions from the outer cortex to the core in rabbit and pig lens sections (diameter = 1.1 cm). Spatial resolution in the bovine lens was approximately 0.13 cm. The spotting procedure was also applied to a smaller lens, the rat lens (diameter = 0.5 cm), and in this case 4–5 lens regions were profiled across the diameter of the tissue section. However, when matrix was applied to the outer core, it spread throughout the entire core due to the dryness of the tissue in this region. Thus, resolution of the outer core and core was not possible.
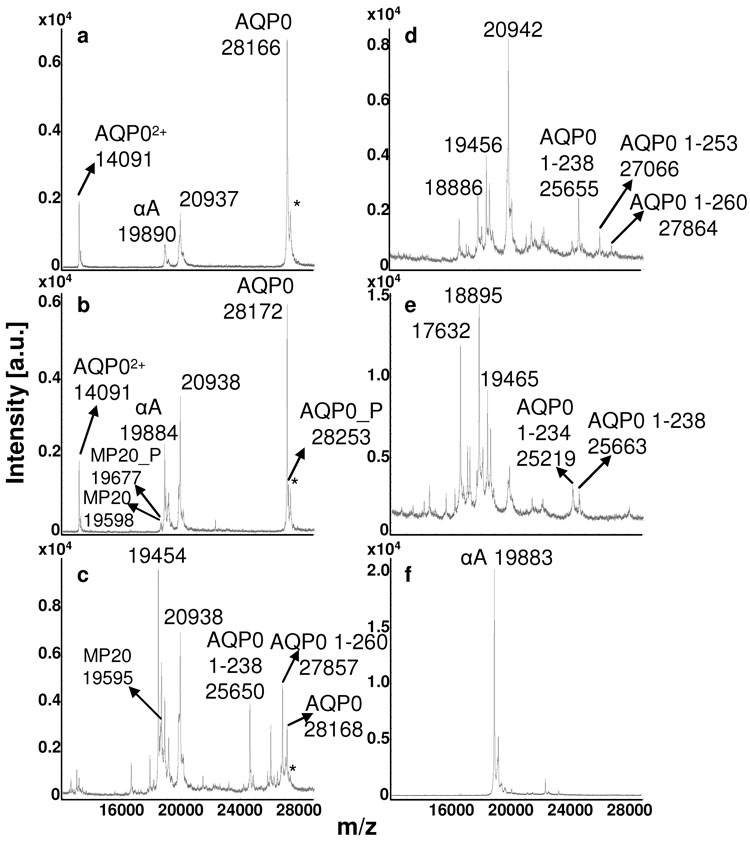
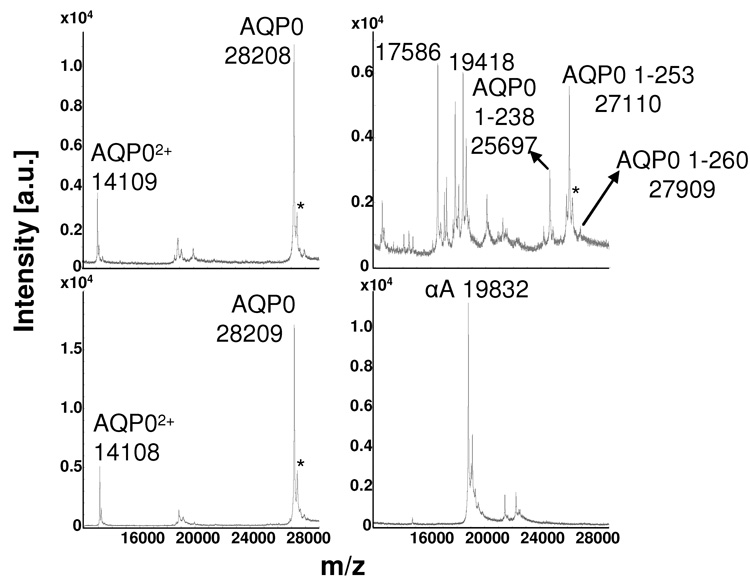
Direct tissue profiling of AQP0 from rabbit (Fig 2) and rat (Fig 3) lens sections revealed distinct age-related differences between the cortical regions and the core. Full length AQP0 (1-263) is the dominant signal in the outer cortex (Fig 2a, Fig 3a) and inner cortex (Fig 2b, Fig 3b), while profiles from the outer core (Fig 2c), inner core (Fig 2d), and core (Fig 2e, Fig 3c) regions display several AQP0 truncation products. In the rabbit, full length AQP0 is only detected from the outer cortex to the outer core (Fig 2a–c) and is absent in the very center of the lens (Fig 2d, e). The major truncation products observed in the rabbit core were AQP0 1-260, 1-253, and 1-238. Truncation after amino acid 234 is seen in the very center of the lens (Fig 2e). The major truncation products seen in the rat core (Fig 3c) were AQP0 1-253 and 1-238. AQP0 1-260, 1-250 and 1-234 were also detected at lower abundance. Direct tissue profiling of AQP0 from rabbit and rat lens sections demonstrates the change in abundance of intact AQP0 from the outer cortex to the core of the lens. This variation is not due to treatment of the tissue, as the entire section was treated in the same way and truncation is only seen in the core regions. Furthermore, the profiles from bovine lens sections (Fig 4), treated in the same manner as rabbit and rat lens sections, do not indicate a significant increase in truncation. The dramatic decrease in intact AQP0 and concurrent increase in AQP0 truncation products seen in the core profiles is likely due to calpain activity, as active m-calpain (calpain 2) has been observed in rat [23] and rabbit [24] lenses. Schey et al. determined that AQP0 1-238 resulted from in vitro proteolysis of AQP0 with m-calpain, suggesting that m-calpain may be responsible for the formation of this truncation product in vivo [25]. Furthermore, mRNA for lens specific calpain, Lp82, has also been observed in rat [26–28] and rabbit [26, 28] lenses, while Lp85 is a lens specific calpain found exclusively in rodents [28].
Figure 2.
MALDI tissue profiles of rabbit lens sections (diameter = 1.1 cm) from a) the outer cortex, b) inner cortex, c) outer core, d) inner core, and e) core regions. Truncation of AQP0 increases with fiber cell age. A profile of the outer cortical region after washing and 7:3 FA:HFIP treatment (a) can be compared to a profile from the outer cortical region before washing and 7:3 FA:HFIP treatment (f). “αA” represents αA crystallin 1-173; AQP0 represents AQP0 1-263; MP20 represents MP20 1-173. “P” indicates the phosphorylated forms of AQP0 and MP20. The asterisks mark sinapinic acid adducts (Δm = 206 Da) to the full length AQP0 protein.
Figure 3.
MALDI tissue profiles of rat lens sections (diameter = 0.5 cm) from a) the outer cortex, b) inner cortex, and c) core regions. Truncation of AQP0 increases with fiber cell age. A profile of the outer cortical region after washing and 7:3 FA:HFIP treatment (a) can be compared to a profile from the outer cortical region before washing and 7:3 FA:HFIP treatment (d). AQP0 represents AQP0 1-263; MP20 represents MP20 1-173. “P” indicates the phosphorylated form of MP20. The asterisks mark sinapinic acid adducts (Δm = 206 Da) to the full length AQP0 protein.
Figure 4.
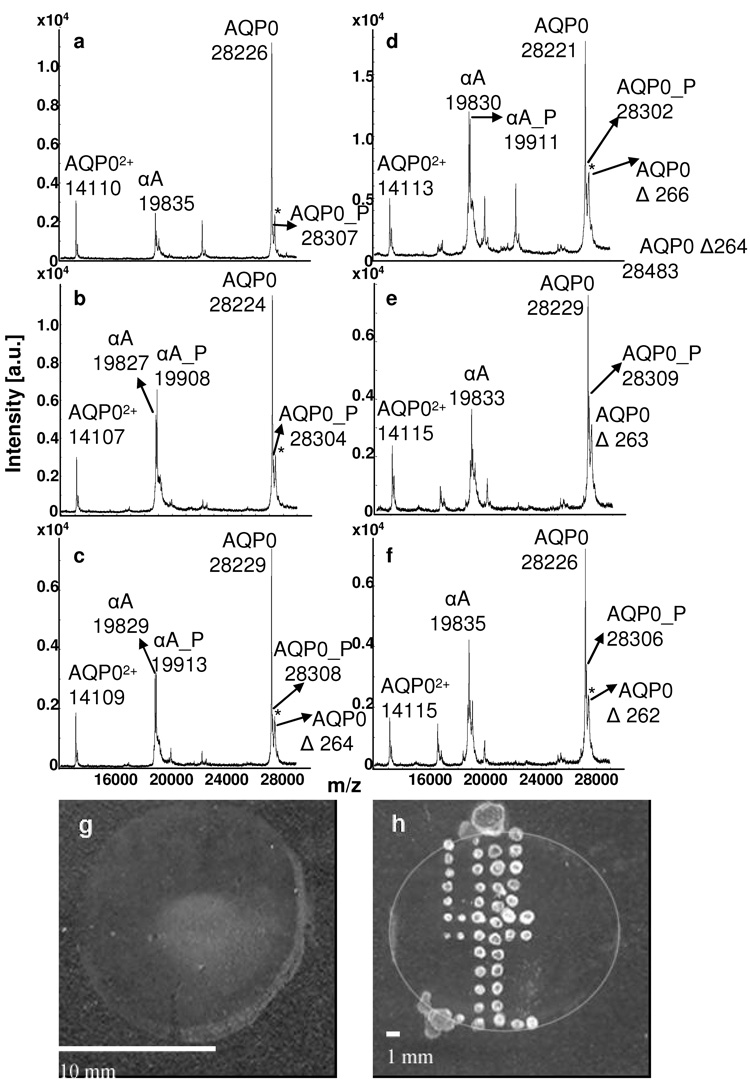
MALDI tissue profiles of bovine lens sections (diameter = 1.5 cm) from the a) outer cortex, b) inner cortex, c) deep cortex, d) outer core, e) inner core, and f) core regions. A novel modification to AQP0 localizes to deep cortical and core regions of the lens. “αA” represents αA crystallin 1-173; AQP0 represents AQP0 1-263; MP20 represents MP20 1-173. “P” indicates the phosphorylated forms of αA crystallin and AQP0. The asterisks mark sinapinic acid adducts (Δm = 206 Da) to the full length AQP0 protein. Also shown are scanned images of 20 µm bovine lens sections unwashed (g) or water washed and spotted with 7:3 FA:HFIP and saturated sinapinic acid matrix (h). A circle has been included in panel “h” to show the approximate outer edge of the lens section. The average spot size in panel “h” is 0.09 ± 0.01 mm.
MP20 1-173 was also detected from rabbit lens sections in the inner cortex and outer core regions (Fig 2b, c), but not in the inner core and core regions (Fig 2d, e). Interestingly, the phosphorylated form of MP20 localized to the inner cortex (Fig 2b).
Profiling of AQP0 from bovine (Fig 4) and pig (data not shown) lens sections revealed species differences when compared to rabbit and rat profiles. Unlike the profiles from the core regions of rabbit and rat lens sections, profiles from these regions of bovine (Fig 4 d–f) and pig lens sections did not display prominent signals for AQP0 truncation products. Interestingly, m-calpain and Lp82 were observed in fetal calf lenses, but their activity was found to be much lower than the activity of these proteases in rat lenses [29].
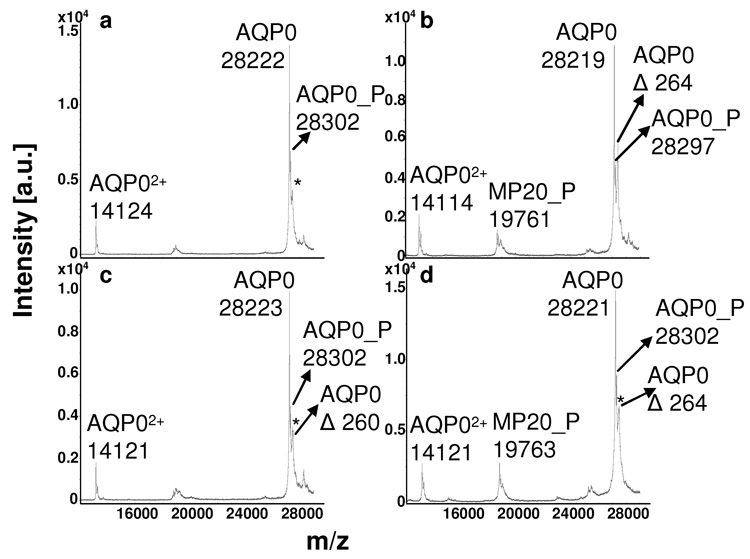
Of particular interest, is the localization of a shoulder to the full length AQP0 signal in the deep cortical and core regions of the bovine (Fig 4 c–f) and the core regions of pig lens. The shoulder is resolved from the sinapinic acid adduct and corresponds to a mass shift of ~265 Da. Based on preliminary data, this signal appears to be due to an as yet unidentified modification to AQP0, which has not been observed previously using conventional proteomics methods. Although the value for the doubly charged bovine AQP0 ion varies slightly from the expected signal of 14, 113, an average signal of 14, 112 ± 4 was calculated from 49 spectra. The average signal for the [M+H]+ ion was found to be 28, 227 ± 7; this difference in value from the expected signal of 28, 224 may be because the signal is outside of the calibration range (5–17 kDa).
The use of this optimized sample preparation protocol for selectively profiling membrane proteins directly from tissue was validated by comparing mass spectra obtained directly from tissue to mass spectra obtained from dissected, homogenized regions of bovine lenses (Fig 5). Comparison of MALDI mass spectra from tissue homogenates of dissected bovine lenses with those obtained via direct profiling from tissue sections confirms that the latter method provides an accurate profile of the membrane proteins within the tissue sample. Furthermore, the regional differences in modification to AQP0 displayed here, which indicate that truncation increases with fiber cell age (towards the center of the lens), concur with past findings [19, 30–34]. Profiles obtained from both methods show a dominant signal for intact AQP0 from the cortex to the core, with truncation products just beginning to appear in the core regions (compare Fig 4 and Fig 5). The profiles also show that phosphorylation of AQP0 occurs from the periphery to the core. The signal for phosphorylated AQP0 profiled from lens sections appears to increase from the outer cortex to the core, while this is not the case in profiles from lens homogenates. This is most likely due to the increase in spatial resolution achieved by directly profiling from the tissue, which allows for more discrete regions to be profiled than does manual dissection of lens tissue. Dissection and homogenization of the lens tissue does allow for more rigorous washing, increasing the removal of the soluble crystallin proteins, as evidenced by the resolution of MP20 in the homogenate profiles.
Figure 5.
MALDI profiles of bovine lens homogenates from the a) outer cortex, b) inner cortex, c) outer core, and d) core regions. AQP0 represents AQP0 1-263; MP20 represents MP20 1-173. “P” indicates the phosphorylated forms of MP20 and AQP0. The asterisks mark sinapinic acid adducts (Δm = 206 Da) to the full length AQP0 protein.
In this study, MALDI tissue profiling was accomplished by manual spotting. An automated spotting technique will permit a more highly resolved profiling of the distribution of AQP0 modifications across the lens tissue. Methods for this technique must overcome capillary clogging and matrix spreading, which are observed with the higher organic solvents [35] used for membrane proteins. Furthermore, high matrix concentrations require multiple spots to be placed, and the exact location must be reproducible. The use of an acoustic reagent microspotter, which eliminates problems due to clogging and permits reproducible, repetitive spotting [35], may enable high resolution profiling of lens tissue sections. Analysis of the lens tissue via direct tissue profiling enabled the detection of a new modification to AQP0 in bovine and pig lenses that was previously unseen with traditional analysis methods. This affirms the importance of directly profiling membrane proteins from their native environment, as modifications may be lost with extractions and purifications [8].
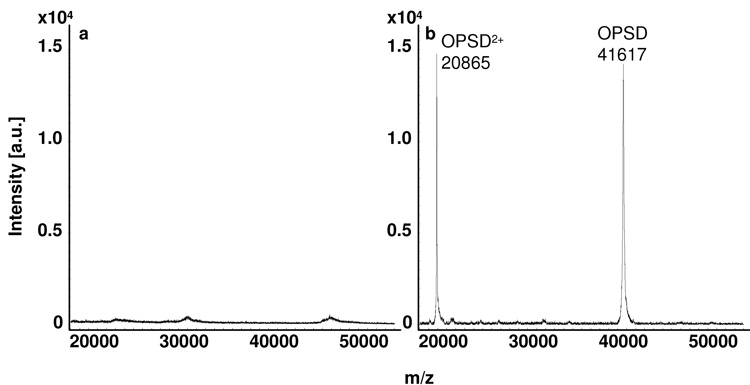
To demonstrate the applicability of this method to other tissues, pig retinal tissue was profiled according to the method presented here. Figure 6 shows that after a water wash and application of 7:3 FA:HFIP, the dominant signal can be assigned to opsin (OPSD), a signal which is not visible prior to the application of 7:3 FA:HFIP. Opsin, when combined with 11-cis retinal, forms the photopigment rhodopsin that is found in retinal photoreceptor disk membranes. Rhodopsin is a G-protein coupled receptor that spans the intradiscal membrane seven times [36]. Due to sample preparations in ambient light and treatment with strong organic solvents, we predict the loss of the retinal moiety during sample preparation. The calculated mass of the [M+H]+ ion for opsin, including normal carbohydrate modifications [37], is 41,689. This is in good agreement with the observed mass, considering the high mass of opsin and the mass range over which instrumentation was calibrated (5–17 kDa). The above results indicate that the method presented here can be applied to other tissues and proteins for successful profiling of membrane proteins.
Figure 6.
MALDI tissue profiles of pig retina from a) a water washed section not treated with FA:HFIP, and b) a water washed section treated with 7:3 FA:HFIP. OPSD represents full length opsin, OPSD 1-348.
Supplementary Material
MALDI tissue profiles from the outer cortex to the core of water washed bovine lens sections with or without application of 7:3 FA:HFIP. Application of the 7:3 FA:HFIP results in increased APQ0 signal relative to αA crystallin.
Acknowledgements
The authors acknowledge funding from NIH EY-13462, Cross Training Grant for Summer Undergraduate Research NIH T35 HL007769, and the Kilpatrick Medical Research Funds, and technical assistance from Dr. Baerbel Rohrer and Kioina Myers. We would also like to acknowledge use of the Medical University of South Carolina Mass Spectrometry Facility and support of the Vision Core Grant, NIH R24 EY14793.
Footnotes
Publisher's Disclaimer: This is a PDF file of an unedited manuscript that has been accepted for publication. As a service to our customers we are providing this early version of the manuscript. The manuscript will undergo copyediting, typesetting, and review of the resulting proof before it is published in its final citable form. Please note that during the production process errors may be discovered which could affect the content, and all legal disclaimers that apply to the journal pertain.
REFERENCES
- 1.Karas M, Hillenkamp F. Laser desorption ionization of proteins with molecular masses exceeding 10,000 daltons. Anal Chem. 1988;60:2299–2301. doi: 10.1021/ac00171a028. [DOI] [PubMed] [Google Scholar]
- 2.Roepstorff P. Mass spectrometry in protein studies from genome to function. Curr Opin Biotechnol. 1997;8:6–13. doi: 10.1016/s0958-1669(97)80151-6. [DOI] [PubMed] [Google Scholar]
- 3.Russell DH, Edmondson RD. High-resolution Mass Spectrometry and Accurate Mass Measurements with Emphasis on the Characterization of Peptides and Proteins by Matrix-assisted Laser Desorption/Ionization Time-of-flight Mass Spectrometry. Journal of Mass Spectrometry. 1997;32:263–276. [Google Scholar]
- 4.Caldwell RL, Caprioli RM. Tissue profiling by mass spectrometry: a review of methodology and applications. Mol Cell Proteomics. 2005;4:394–401. doi: 10.1074/mcp.R500006-MCP200. [DOI] [PubMed] [Google Scholar]
- 5.Chaurand P, Caprioli RM. Direct profiling and imaging of peptides and proteins from mammalian cells and tissue sections by mass spectrometry. Electrophoresis. 2002;23:3125–3135. doi: 10.1002/1522-2683(200209)23:18<3125::AID-ELPS3125>3.0.CO;2-#. [DOI] [PubMed] [Google Scholar]
- 6.Chaurand P, Schwartz SA, Caprioli RM. Profiling and Imaging Proteins in Tissue Sections by MS. Analytical Chemistry. 2004;76:86A–93A. [PubMed] [Google Scholar]
- 7.Chaurand P, Schwartz SA, Reyzer ML, Caprioli RM. Imaging mass spectrometry: principles and potentials. Toxicol Pathol. 2005;33:92–101. doi: 10.1080/01926230590881862. [DOI] [PubMed] [Google Scholar]
- 8.Schwartz SA, Reyzer ML, Caprioli RM. Direct tissue analysis using matrix-assisted laser desorption/ionization mass spectrometry: practical aspects of sample preparation. J Mass Spectrom. 2003;38:699–708. doi: 10.1002/jms.505. [DOI] [PubMed] [Google Scholar]
- 9.Chaurand P, Cornett DS, Caprioli RM. Molecular imaging of thin mammalian tissue sections by mass spectrometry. Current Opinion in Biotechnology. 2006;17:431. doi: 10.1016/j.copbio.2006.06.002. [DOI] [PubMed] [Google Scholar]
- 10.Yanagisawa K, Shyr Y, Xu BJ, Massion PP, Larsen PH, White BC, Roberts JR, Edgerton M, Gonzalez A, Nadaf S, Moore JH, Caprioli RM, Carbone DP. Proteomic patterns of tumour subsets in non-small-cell lung cancer. Lancet. 2003;362:433–439. doi: 10.1016/S0140-6736(03)14068-8. [DOI] [PubMed] [Google Scholar]
- 11.Schwartz SA, Weil RJ, Johnson MD, Toms SA, Caprioli RM. Protein Profiling in Brain Tumors Using Mass Spectrometry: Feasibility of a New Technique for the Analysis of Protein Expression. Clin Cancer Res. 2004;10:981–987. doi: 10.1158/1078-0432.ccr-0927-3. [DOI] [PubMed] [Google Scholar]
- 12.Chaurand P, Fouchecourt S, DaGue BB, Xu BJ, Reyzer ML, Orgebin-Crist MC, Caprioli RM. Profiling and imaging proteins in the mouse epididymis by imaging mass spectrometry. Proteomics. 2003;3:2221–2239. doi: 10.1002/pmic.200300474. [DOI] [PubMed] [Google Scholar]
- 13.Signor L, Varesio E, Staack RF, Starke V, Richter WF, Hopfgartner G. Analysis of erlotinib and its metabolites in rat tissue sections by MALDI quadrupole time-of-flight mass spectrometry. Journal of Mass Spectrometry. 2007;42:900–909. doi: 10.1002/jms.1225. [DOI] [PubMed] [Google Scholar]
- 14.Han J, Schey KL. MALDI tissue imaging of ocular lens alpha-crystallin. Invest Ophthalmol Vis Sci. 2006;47:2990–2996. doi: 10.1167/iovs.05-1529. [DOI] [PubMed] [Google Scholar]
- 15.Schey KL. Hydrophobic proteins and peptides analyzed by matrix-assisted laser desorption/ionization. Methods Mol Biol. 1996;61:227–230. doi: 10.1385/0-89603-345-7:227. [DOI] [PubMed] [Google Scholar]
- 16.Breaux GA, Green-Church KB, France A, Limbach PA. Surfactant-Aided, Matrix-Assisted Laser Desorption/Ionization Mass Spectrometry of Hydrophobic and Hydrophilic Peptides. Anal. Chem. 2000;72:1169–1174. doi: 10.1021/ac9907282. [DOI] [PubMed] [Google Scholar]
- 17.Blonder J, Goshe MB, Moore RJ, Pasa-Tolic L, Masselon CD, Lipton MS, Smith RD. Enrichment of Integral Membrane Proteins for Proteomic Analysis Using Liquid Chromatography-Tandem Mass Spectrometry. J. Proteome Res. 2002;1:351–360. doi: 10.1021/pr0255248. [DOI] [PubMed] [Google Scholar]
- 18.Loo RRO, Loo JA. Matrix-Assisted Laser Desorption/Ionization-Mass Spectrometry of Hydrophobic Proteins in Mixtures Using Formic Acid, Perfluorooctanoic Acid, and Sorbitol. 2007;Vol. 79:1115–1125. doi: 10.1021/ac061916c. [DOI] [PubMed] [Google Scholar]
- 19.Ball LE, Garland DL, Crouch RK, Schey KL. Post-translational modifications of aquaporin 0 (AQP0) in the normal human lens: spatial and temporal occurrence. Biochemistry. 2004;43:9856–9865. doi: 10.1021/bi0496034. [DOI] [PubMed] [Google Scholar]
- 20.Mulders SM, Preston GM, Deen PM, Guggino WB, van Os CH, Agre P. Water channel properties of major intrinsic protein of lens. J Biol Chem. 1995;270:9010–9016. doi: 10.1074/jbc.270.15.9010. [DOI] [PubMed] [Google Scholar]
- 21.Varadaraj K, Kushmerick C, Baldo GJ, Bassnett S, Shiels A, Mathias RT. The role of MIP in lens fiber cell membrane transport. J Membr Biol. 1999;170:191–203. doi: 10.1007/s002329900549. [DOI] [PubMed] [Google Scholar]
- 22.Louis CF, Hur KC, Galvan AC, TenBroek EM, Jarvis LJ, Eccleston ED, Howard JB. Identification of an 18,000-dalton protein in mammalian lens fiber cell membranes. J Biol Chem. 1989;264:19967–19973. [PubMed] [Google Scholar]
- 23.David LL, Shearer TR. Purification of calpain II from rat lens and determination of endogenous substrates. Experimental Eye Research. 1986;42:227. doi: 10.1016/0014-4835(86)90057-6. [DOI] [PubMed] [Google Scholar]
- 24.Fukiage C, Azuma M, Nakamura Y, Tamada Y, Shearer TR. Nuclear cataract and light scattering in cultured lenses from guinea pig and rabbit. Current Eye Research. 1998;17:623–635. [PubMed] [Google Scholar]
- 25.Schey KL, Fowler JG, Shearer TR, David L. Modifications to rat lens major intrinsic protein in selenite-induced cataract. Invest. Ophthalmol. Vis. Sci. 1999;40:657–667. [PubMed] [Google Scholar]
- 26.Nakajima T, Fukiage C, Azuma M, Ma H, Shearer TR. Different expression patterns for ubiquitous calpains and Capn3 splice variants in monkey ocular tissues. Biochimica et Biophysica Acta (BBA) - Gene Structure and Expression. 2001;1519:55. doi: 10.1016/s0167-4781(01)00212-3. [DOI] [PubMed] [Google Scholar]
- 27.Shearer TR, Ma H, Shih M, Hata I, Fukiage C, Nakamura Y, Azuma M. Lp82 calpain during rat lens maturation and cataract formation. Current Eye Research. 1998;17:1037–1043. doi: 10.1076/ceyr.17.11.1037.5232. [DOI] [PubMed] [Google Scholar]
- 28.Ma H, Shih M, Hata I, Fukiage C, Azuma M, Shearer TR. Lp85 calpain is an enzymatically active rodent-specific isozyme of lens Lp82. Current Eye Research. 2000;20:183–189. [PubMed] [Google Scholar]
- 29.Ueda Y, McCormack AL, Shearer TR, David LL. Purification and Characterization of Lens Specific Calpain (Lp82) from Bovine Lens. Experimental Eye Research. 2001;73:625. doi: 10.1006/exer.2001.1071. [DOI] [PubMed] [Google Scholar]
- 30.Horwitz J, Robertson NP, Wong MM, Zigler JS, Kinoshita JH. Some properties of lens plasma membrane polypeptides isolated from normal human lenses. Experimental Eye Research. 1979;28:359. doi: 10.1016/0014-4835(79)90098-8. [DOI] [PubMed] [Google Scholar]
- 31.Roy D, Spector A, Farnsworth PN. Human lens membrane: Comparison of major intrinsic polypeptides from young and old lenses isolated by a new methodology. Experimental Eye Research. 1979;28:353. doi: 10.1016/0014-4835(79)90097-6. [DOI] [PubMed] [Google Scholar]
- 32.Takemoto L, Takehana M, Horwitz J. Covalent changes in MIP26K during aging of the human lens membrane. Invest. Ophthalmol. Vis. Sci. 1986;27:443–446. [PubMed] [Google Scholar]
- 33.Schey KL, Little M, Fowler JG, Crouch RK. Characterization of Human Lens Major Intrinsic Protein Structure. Invest. Ophthalmol. Vis. Sci. 2000;41:175–182. [PubMed] [Google Scholar]
- 34.Ball LE, Little M, Nowak MW, Garland DL, Crouch RK, Schey KL. Water permeability of C-terminally truncated aquaporin 0 (AQP0 1-243) observed in the aging human lens. Invest Ophthalmol Vis Sci. 2003;44:4820–4828. doi: 10.1167/iovs.02-1317. [DOI] [PubMed] [Google Scholar]
- 35.Aerni HR, Cornett DS, Caprioli RM. Automated acoustic matrix deposition for MALDI sample preparation. Anal Chem. 2006;78:827–834. doi: 10.1021/ac051534r. [DOI] [PubMed] [Google Scholar]
- 36.Palczewski K. G Protein Coupled Receptor Rhodopsin. Annu. Rev. Biochem. 2006;75:743–767. doi: 10.1146/annurev.biochem.75.103004.142743. [DOI] [PMC free article] [PubMed] [Google Scholar]
- 37.Ablonczy Z, Goletz P, Knapp DR, Crouch RK. Mass spectrometric analysis of porcine rhodopsin. Photochem Photobiol. 2002;75:316–321. doi: 10.1562/0031-8655(2002)075<0316:msaopr>2.0.co;2. [DOI] [PubMed] [Google Scholar]
Associated Data
This section collects any data citations, data availability statements, or supplementary materials included in this article.
Supplementary Materials
MALDI tissue profiles from the outer cortex to the core of water washed bovine lens sections with or without application of 7:3 FA:HFIP. Application of the 7:3 FA:HFIP results in increased APQ0 signal relative to αA crystallin.


