Abstract
Calcineurin B homologous protein (CHP) 1 and 2 are Ca2+-binding proteins that modulate several cellular processes, including cytoplasmic pH by positively regulating plasma membrane-type Na+/H+ exchangers (NHEs). Recently another CHP-related protein, termed tescalcin or CHP3, was also shown to interact with the ubiquitous NHE1 isoform, but seemingly suppressed its activity. However, the precise physical and functional nature of this association was not examined in detail. In this study, biochemical and cellular studies were undertaken to further delineate this relationship. Glutathione S-transferase-NHE1 fusion protein pulldown assays revealed that full-length CHP3 binds directly to the proximal juxtamembrane C-terminal region (amino acids 505–571) of rat NHE1 in the same region that binds CHP1 and CHP2. The interaction was further validated by coimmunoprecipitation and coimmunolocalization experiments using full-length CHP3 and wild-type NHE1 in transfected Chinese hamster ovary AP-1 cells. Simultaneous mutation of four hydrophobic residues within this region (530FLDHLL535) to either Ala, Gln, or Arg (FL-A, FL-Q, or FL-R) abrogated this interaction both in vitro and in intact cells. The NHE1 mutants were sorted properly to the cell surface but showed markedly reduced (FL-A) or minimal (FL-R and FL-Q) activity. Interestingly, and contrary to an earlier finding, ectopic coexpression of CHP3 up-regulated the cell surface activity of wild-type NHE1. This stimulation was not observed with the CHP3 binding-defective mutants. Mechanistically, overexpression of CHP3 did not alter the H+ sensitivity of wild-type NHE1 but rather promoted its biosynthetic maturation and half-life at the cell surface, thereby increasing the steady-state abundance of functional NHE1 protein.
Monovalent cations such as Li+, Na+, and K+ are transported across biological membranes in exchange for H+ by a family of alkali cation/proton countertransporters, commonly referred to as Na+/H+ exchangers (NHE)2 or antiporters. Phylogenetic analyses and functional studies have revealed the existence of at least 11 mammalian NHE isoforms that display varied primary structure (∼13–70% identity), tissue distribution, subcellular compartmentalization, cation selectivity, and function (1–3). Structurally, the NHEs are composed of two major domains as follows: an N terminus that contains 12 predicted membrane-spanning segments responsible for cation permeation and a C terminus that faces the cytoplasm and serves to regulate transport activity, membrane targeting, anchorage to the underlying actin cytoskeleton, and as a scaffold for the assembly of other signaling complexes (1, 2, 4–7).
Of these isoforms, NHE1 has received considerable attention because it is widely expressed and plays a vital role in several physiological processes, notably cytoplasmic pH homeostasis and maintenance of cell volume, but also cell shape, migration, proliferation, differentiation, and apoptosis (7–13). Accordingly, diverse signals (e.g. hormones, mitogens, and physical stimuli such as mechanical stretch and hyperosmolality) that regulate such phenomena also acutely stimulate NHE1 activity, mainly by enhancing the affinity of the transporter for intracellular H+. Depending on the stimulus, this activation is often associated with direct phosphorylation of its C terminus by assorted serine/threonine protein kinases, including extracellular signal-regulated protein kinases 1 and 2 (14), p38 mitogen-activated protein kinase (15), p90 ribosomal S6 kinase (16, 17), Rho-associated coiled-coil containing protein kinase 1 (18), and Nck-interacting kinase (19). In turn, phosphorylation at certain sites has been shown to promote the binding of additional ancillary proteins such as carbonic anhydrase (20) and the scaffolding protein 14-3-3 (21). Conversely, protein phosphatases such as PP1 and PP2A act as negative regulators of NHE1 phosphorylation and activity (22, 23). However, other interacting partners can bind independently of NHE1 phosphorylation, including Ca2+-calmodulin (24), members of the calcineurin B homologous protein (CHP) family (25–29), phosphatidylinositol 4,5-bisphosphate (PIP2) (30), and the actin filament anchoring proteins ezrin, radixin, and moesin (31). In general, these associations are thought to elicit a change in the conformation of its C-terminal regulatory domain, thereby altering H+ affinity, but structural evidence supporting this conjecture is wanting.
Of the above mentioned regulatory molecules, the CHP family of proteins (CHP1–3) appear to be crucial partners for basal as well as regulated activity of NHE1 and other plasma membrane-resident NHE isoforms (25–29, 32, 33). CHPs are N-myristoylated, EF-hand Ca2+-binding proteins that exhibit ∼29–61% identity to each other and share ∼40% identity with the regulatory B subunit of the protein phosphatase calcineurin. Indeed, the CHPs can inhibit calcineurin activity (34, 35). CHP1 is present in most tissues, binds to the proximal region of the cytoplasmic C terminus of NHE1, and plays a significant role in setting the resting intracellular pH sensitivity of the transporter in the neutral range, and also its activation in response to various stimuli (26, 36). By comparison, the expression of CHP2 is largely restricted to normal intestinal epithelia (28), but it is significantly induced in different malignant cell types (27). CHP2 interacts with the same region of NHE1 as CHP1, but binds with severalfold higher affinity (27). Intriguingly, heterologous expression of CHP2 in fibroblasts appears to constitutively activate the transporter in the absence of external stimuli, resulting in a marked elevation in steady-state intracellular pH relative to cells expressing only CHP1 (27). This activation also appears to correlate with a significant reduction in the incidence of cell death upon prolonged serum withdrawal, implicating a role for NHE1/CHP2 and intracellular pH in the progression of cancerous cells (27, 37). By contrast, CHP3, originally isolated from the developing mouse testis and termed “tescalcin” (38), is detected predominantly in adult mouse heart, brain, and stomach (35), although in adult human tissues it appears to be restricted primarily to heart (29). Intriguingly, unlike CHP1 and -2, CHP3 was reported to bind to a unique site within the distal half of the cytoplasmic C terminus of NHE1 and to suppress the activity of the transporter in transfected cells (32). However, the precise binding location and molecular basis for the negative regulation were not examined extensively.
In this study, we further investigated the molecular interaction and mechanism of action of CHP3 on NHE1 function. Contrary to a previous finding (32), we found that CHP3 binds to the same juxtamembrane region of the cytoplasmic C terminus of NHE1 as CHP1 and CHP2. An intact CHP3-binding motif was found to be crucial for optimal Na+/H+ exchange. Furthermore, rather than suppressing exchanger activity, CHP3 was found to increase NHE1 abundance at the cell surface by facilitating its maturation along the biosynthetic pathway and enhancing its half-life at the plasma membrane.
EXPERIMENTAL PROCEDURES
Materials—Mouse monoclonal and rabbit polyclonal anti-hemagglutinin (HA) antibodies were purchased from Covance Inc. (Berkeley, CA); anti-Myc antibodies were obtained from Upstate Biotechnology, Inc. (Lake Placid, NY); a rabbit polyclonal anti-green fluorescent protein (anti-GFP) antibody was obtained from Invitrogen; and antibodies specific to glyceraldehyde 3-phosphate dehydrogenase (GAPDH) were purchased from Abcam Inc. (Cambridge, MA). Horseradish peroxidase-conjugated secondary IgG antibodies were purchased from Jackson ImmunoResearch (West Grove, PA). All Alexa Fluor®-conjugated goat anti-mouse and anti-rabbit IgG antibodies were purchased from Molecular Probes (Eugene, OR).
α-Minimum essential medium (α-MEM), fetal bovine serum, penicillin/streptomycin, geneticin (G418), and trypsin-EDTA and Lipofectamine™ 2000 transfection reagent were obtained from Invitrogen. Carrier-free 22NaCl and [35S]methionine were obtained from PerkinElmer Life Sciences. Amiloride hydrochloride, nigericin, and ouabain were purchased from Sigma, and complete protease inhibitor mixture tablets were obtained from Roche Diagnostics. All other chemicals and reagents used in these experiments were obtained from Bio-Shop Canada (Burlington, Ontario, Canada), Sigma, or Fisher and were of the highest grade available.
cDNA Construction and Mutagenesis—The construction of the mammalian expression vector containing the HA epitope-tagged form of the rat NHE1 cDNA (NHE1HA) was described previously (39). Previous experiments showed that when this modified NHE1 construct was expressed in AP-1 cells, no obvious effect was observed on basal activity or the functional properties of the exchanger (30). The full-length human CHP3/tescalcin cDNA was cloned using PCR methodology from a human heart Matchmaker™ cDNA library (Clontech), and it was engineered to include a myc epitope (EQKLISEEDL) at its extreme C terminus for immunological detection. This construct, henceforth termed CHP3myc, was inserted into the HindIII/XbaI sites of the mammalian expression vector pcDNA3 (Invitrogen), as well as the mammalian expression vector pCMV (40).
Mutations of the hydrophobic amino acids in NHE1HA crucial for interaction with CHP3myc were accomplished using a commercially available QuikChange™ site-directed mutagenesis kit (Stratagene, Cedar Creek, TX) according to the manufacturer's protocol. These amino acids (530FLDHLL535) were substituted for either Ala (530AADHAA535, FL-A), Glu (530QQDHQQ535, FL-Q), or Arg (530RRDHRR535, FL-R). Deletion of segments at the N-terminal juxtamembrane region of the cytoplasmic tail of NHE1HA (Δ505–540 and Δ505–566) was accomplished by PCR mutagenesis. All constructs were sequenced using the Sanger method (41) to validate the fidelity of the sequences.
Cell Culture and DNA Transfection—Chinese hamster ovary cells devoid of plasma membrane Na+/H+ exchange activity (AP-1 cells) (42) were maintained in α-MEM supplemented with 10% fetal bovine serum, penicillin (100 units/ml), streptomycin (100 μg/ml), and 25 mm NaHCO3 (pH 7.4) and incubated in a humidified atmosphere of 95% air, 5% CO2 at 37 °C. To generate AP-1 cells stably expressing NHE1HA and its derived mutants, plasmid DNA (0.5–1.0 μg/ml) was transfected into subconfluent cells in a 6-well plate using Lipofectamine™-2000 according to the manufacturer's recommended procedure. Twenty four hours post-transfection, cells were split (1:10 to 1:50, depending on cell density) into 10-cm dishes and selected for stably expressing clones over a 2-week period using repeated acid selection as described previously (40). NHE1HA and CHP3myc double expressing cells were obtained by transfecting a single clone expressing NHE1HA with CHP3myc using Lipofectamine™-2000, as described above, and selecting in α-MEM culture medium supplemented with geneticin (G418) (600 μg/ml) over a 2–4-week period.
Construction of Glutathione S-Transferase (GST) Fusion Protein and in Vitro Binding Assay—GST fusion proteins of segments of the C-terminal regulatory region of NHE1 were produced by PCR amplification using primers containing BamHI at the 5′ terminus and EcoRI at the 3′ terminus. These PCR products were subcloned in-frame into the bacterial expression vector pGEX-2T (Amersham Biosciences). Inserts were sequenced to confirm their fidelity, and then the plasmid constructs were transformed into the Epicurian Coli® BL21-CodonPlus™ strain (Stratagene, Cedar Creek, TX).
Individual colonies were cultured overnight, then diluted 1:25 in 50 ml of bacterial growth media, and incubated further at 37 °C with vigorous shaking to attain a sufficient population density. Protein expression was then induced with the addition of 0.4 mm isopropyl 1-thio-β-galactopyranoside, and cultures were incubated a further 2.5 h at 30 °C. The bacterial cultures were centrifuged, and the resulting pellets were resuspended in 500 μl of GST-lysis buffer (1 mm EDTA, 0.5% Nonidet P-40) and protease inhibitors in standard phosphate-buffered saline (PBS). Bacteria were subsequently lysed by sonication (model 100 Sonic Dismembrator, Fisher) on ice and cleared by centrifugation at 4 °C for 20 min. Proteins were then purified by incubating cell lysates with a reduced form of glutathione-Sepharose™ beads (Amersham Biosciences) for several hours at 4 °C. The purified GST fusion proteins bound to glutathione-Sepharose beads were washed six times with GST-lysis buffer and then incubated with either 2.5 μl of in vitro translated full-length 35S-labeled CHP3 or lysates from Chinese hamster ovary (CHO) cells transiently transfected with CHPmyc for several hours at 4 °C.
In vitro synthesis of CHP3 was accomplished by subcloning the CHP3 cDNA into a vector containing a T7 promoter to enable an in vitro transcription-translation coupling reaction using rabbit reticulocyte lysates (Promega, Madison, WI) in the presence of [35S]methionine. CHP3myc containing cell lysates were obtained by transfecting CHO cells with CHP3myc cDNA using Lipofectamine™-2000 following the manufacturer's recommended procedure. Twenty four hours post-transfection, cells were lysed on ice by washing two times with ice-cold PBS, followed by the addition of 1 ml of ice-cold RIPA buffer (150 mm NaCl, 0.25% deoxycholic acid, 50 mm Tris-HCl, pH 8.0, 0.5% Nonidet P-40, 1 mm EDTA, and protease inhibitors), scraping, and then incubating the cells on ice for 1 h. Cell lysates were then centrifuged for 10 min at 4 °C to remove cellular particulate debris.
NHE1 fusion protein complexes were washed six times with GST-lysis buffer, then eluted in SDS-sample buffer (50 mm Tris-HCl, pH 6.8, 1% SDS, 50 mm dithiothreitol, 10% glycerol, 1% bromphenol blue), and subjected to SDS-PAGE. Gels containing in vitro translated 35S-labeled CHP3 were dried, and the resulting bound 35S-labeled CHP3 was resolved using a PhosphorImager™ (GE Healthcare). Gels containing CHP3myc from CHO cell lysates were subject to electrophoretic protein transfer onto polyvinylidene fluoride membranes (Millipore, Nepean, Ontario, Canada) for Western blotting. Membranes were blocked with 5% nonfat powdered milk and exposed to 1:1000 dilution of mouse monoclonal antibody against the myc epitope, and a secondary goat anti-mouse antibody conjugated to horseradish peroxidase at a dilution of 1:5000. Immunoreactive bands were then visualized using ECL™ Western blotting detection reagents (Amersham Biosciences).
Coimmunoprecipitation—Immunoprecipitation of wild-type and mutant forms (FL-A, FL-Q, FL-R, Δ505–540, and Δ505–566) of NHE1HA were performed in 10-cm plates of CHO cells cotransfected with 5 μg of both NHE1HA and CHP3myc cDNA constructs. Transfections were performed using Lipofectamine™-2000 according to the manufacturer's recommended procedure. Twenty four to 36 h post-transfection, cells lysates were obtained by washing cells twice on ice with ice-cold PBS, followed by the addition of 1 ml of RIPA buffer. The cells were removed from the dish by scraping and then incubating for an additional 20 min at 4 °C. The lysates were then centrifuged for 20 min at 4 °C to pellet the cellular debris. The supernatants were pre-cleared with 100 μl of 50% protein G-Sepharose slurry (Amersham Biosciences) in RIPA buffer for 2 h at 4 °C. The protein G-Sepharose slurry was removed by brief centrifugation, and a fraction of each lysate was removed for Western blotting. Five μg of primary mouse monoclonal antibody against the HA epitope or 10 μg of polyclonal rabbit antibody against the myc epitope was added to the remaining lysates and incubated with gentle rocking overnight at 4 °C. One hundred μl of 50% protein G-Sepharose slurry was added to each tube and allowed to incubate for several hours at 4 °C with gentle rocking, followed by six washes in RIPA buffer. Protein conjugates were eluted by SDS-sample buffer and incubated for 30 min at room temperature without boiling to minimize aggregation of the NHE1 proteins. Samples were then subjected to SDS-PAGE and Western blotting as described previously. Blots from monoclonal anti-HA immunoprecipitates were detected with rabbit polyclonal antibodies against the HA and myc epitopes followed by incubation with goat anti-rabbit horseradish peroxidase-conjugated secondary antibody. Polyclonal anti-Myc immunoprecipitates were detected using mouse monoclonal antibodies to the respective epitopes followed by goat anti-mouse secondary antibody conjugated to horseradish peroxidase. All blots were visualized with ECL™ Western blotting detection reagents.
Immunocytochemistry—For colocalization studies of NHE1 and CHP3, AP-1 cells overexpressing wild-type and mutant NHE1HA were grown on glass coverslips in 6-well plates and transiently transfected with 1 μg of CHP3myc. Thirty six hours post-transfection, cells were fixed with 2% paraformaldehyde for 20 min at room temperature, rinsed several times with PBS (pH 7.4), and permeabilized and blocked in 0.2% saponin, 2% BSA in PBS for 30 min at room temperature. Cells were subsequently rinsed in PBS, and then incubated with a mouse monoclonal antibody against the HA epitope at a dilution of 1:1000, and a rabbit polyclonal antibody against the myc epitope at a dilution of 1:500 in 2% BSA in PBS for 2 h. Cells were then washed three times in 0.01% saponin in PBS, followed by incubation with anti-mouse Alexa Fluor™ 488 and anti-rabbit Alexa Fluor™ 568 secondary antibodies at a dilution of 1:2000 in 2% BSA in PBS for 1 h. Coverslips were subsequently washed several times with 0.01% saponin in PBS and mounted onto glass slides with Immuno-Fluor™ mounting medium (ICN Biomedicals, Aurora, OH). Transfected cells were analyzed by laser scanning confocal microscopy using a Zeiss LSM 510, and images were analyzed using LSM software and Corel® CorelDraw™ version 12.
Measurement of Na+/H+ Exchanger Activity—Cells were grown to confluence in 24-well plates. NHE activity was determined by preloading the cells with H+ using the NH4Cl technique (43) and then measuring the initial rates of 22Na+ influx essentially as described (40). Briefly, the cell culture medium was aspirated and replaced by isotonic NH4Cl medium (50 mm NH4Cl, 70 mm choline chloride, 5 mm KCl, 1 mm MgCl2, 2 mm CaCl2, 5 mm glucose, 20 mm HEPES-Tris, pH 7.4). Cells were incubated in this media for 30 min at 37 °C in a nominally CO2-free atmosphere. After acid loading, the monolayers were rapidly washed twice with isotonic choline chloride solution (125 mm choline chloride, 1 mm MgCl2, 2 mm CaCl2, 5 mm glucose, 20 mm HEPES-Tris, pH 7.4). 22Na+ influx assays were initiated by incubating the cells in isotonic choline chloride solution containing 1 mm ouabain and 1 μCi of 22NaCl (carrier-free)/ml (∼120 nm NaCl). The assay medium was K+-free and included ouabain to prevent the transport of 22Na+ by the Na+-K+-Cl- cotransporter and the Na+,K+-ATPase. Influx of 22Na+ was terminated by rapidly washing the cell monolayers three times with 4 volumes of ice-cold isotonic saline solution (130 mm NaCl, 1 mm MgCl2, 2 mm CaCl2, 20 mm HEPES-NaOH, pH 7.4). The washed cell monolayers were solubilized in 0.25 ml of 0.5 n NaOH, and the wells were washed with 0.25 ml of 0.5 n HCl. Both the solubilized cell extract and wash solutions were added to vials, and radioactivity was assayed using a liquid scintillation counter. Under the conditions of H+-loading used in this study, uptake of 22Na+ was linear with time for 8–10 min (at low Na+ concentrations, 22 °C). Therefore, 22Na+ uptakes were measured after 5 min. Measurements of 22Na+ influx specific to the Na+/H+ exchanger were determined as the difference between the initial rates of H+-activated 22Na+ influx in the absence and presence of 1 mm amiloride, an NHE antagonist. Protein content was determined using the Bio-Rad DC protein assay procedure.
To examine NHE activity as a function of the intracellular H+ concentration, the pHi was clamped at different concentrations over the range of 5.4–7.4 by suspending the cells in media of varying K+ concentrations containing the K+/H+ exchange ionophore nigericin as described previously (30).
Measurement of NHE1 Half-life—To determine the half-life of NHE1HA in the absence and presence of CHP3myc, AP-1 cells stably expressing NHE1HA alone or in conjunction with CHP3myc were grown on 10-cm dishes to near confluence. Plates were treated with cycloheximide (100 μg/ml) in α-MEM supplemented with 10% FBS and penicillin/streptomycin for up to 48 h. At appropriate time points, cell lysates were obtained, and equal volumes were subject to SDS-PAGE and immunoblotting. Spot densitometry of visualized bands obtained by immunoblotting was performed on an FC1000 gel imaging system and software (Alpha Innotech Corp., San Leandro, CA). Multiple exposures of the same blot were used to obtain relative band intensities to account for under- or oversaturation of individual bands on each film.
Cell Surface Biotinylation and Pulse-Chase Assay—A cell surface biotinylation assay (44) was used to measure the relative abundance of plasma membrane NHE1HA in the absence and presence of CHP3myc. AP-1 cells grown to subconfluence on 10-cm dishes were cotransfected with 8 μg of plasmid DNA containing NHE1HA and an increasing ratio of CHP3myc (0–2 μg) to empty vector (pCMV). Cells were also cotransfected with an expression plasmid (1 μg) that constitutively expresses green fluorescent protein (pGFP) as a control for transfection efficiency. Thirty six hours post-transfection, cells were washed quickly on ice with ice-cold PBS containing 1 mm MgCl2 and 0.1 mm CaCl2 (PBS-CM), and incubated for 20 min on ice with 0.5 mg/ml sulfo-NHS-SS-biotin (Pierce), a water-soluble, membrane-impermeable, thiol-cleavable, amine-reactive biotinylation reagent. Cells were quickly washed and incubated twice in quenching buffer (20 mm glycine in PBS-CM) for 7 min each on ice to remove excess biotin. After two more washes in ice-cold PBS-CM, cell lysates were harvested in RIPA buffer. A small fraction of the cell lysates was removed for immunoblotting, and the remainder was incubated with 200 μl of 50% Neutr-Avidin-Sepharose slurry (Pierce) in RIPA buffer overnight at 4 °C. The bound biotinylated protein complexes were washed six times in RIPA buffer and then eluted with SDS-sample buffer for 30 min at room temperature with gentle rocking. All samples were then subject to SDS-PAGE and immunoblotting analysis.
The half-life of NHE1HA in AP-1 cells in the absence and presence of CHP3myc was determined by growing AP-1 cells stably expressing either NHE1HA or both NHE1HA and CHP3myc to ∼90% confluence. Cells were biotinylated and quenched as described above, and after extensive washing to remove excess biotin, cells were returned to growth media at 37 °C, and then cell lysates were prepared at varying times over a 48-h period, with fresh media being added every 12 h to maintain cell viability. At each time point, a small fraction of the cell lysates was removed for immunoblotting, and the remainder was incubated with 200 μl of 50% NeutrAvidin-Sepharose beads to extract the biotinylated proteins. Cell lysates and extracted biotinylated proteins were subjected to SDS-PAGE and immunoblot analysis. Relative band intensities of Western blots were obtained through multiple exposures of the same blot to ensure that the signal was within the linear range of the x-ray film. Densitometry measurements were obtained using the FC1000 gel imaging system and software.
RESULTS
Delineation of the CHP3-binding Domain of NHE1—An earlier study (32) indicated that CHP3/tescalcin bound to a histidine-tagged fragment of NHE1 encompassing the distal half (amino acids 633 and 815) of its cytoplasmic C terminus using an in vitro affinity blotting assay. However, the precise binding site within this fragment was not delineated nor was the analysis extended to other regions of the cytoplasmic C terminus where its close paralogs, CHP1 and CHP2, were shown to bind (i.e. amino acids 516–540 of human NHE1) (26, 27, 36).
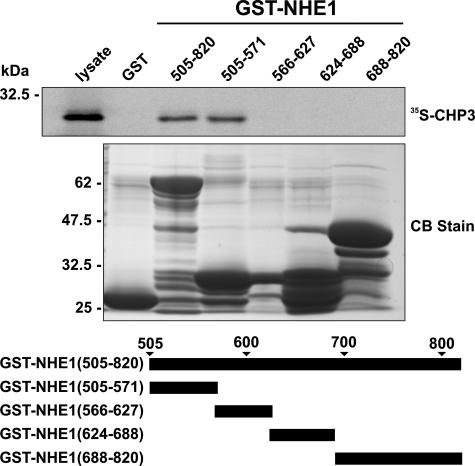
To provide a more comprehensive survey of potential CHP3-binding site(s) within the cytoplasmic C terminus of rat NHE1, we performed in vitro protein-binding pulldown assays. Purified GST fusion proteins containing the entire cytoplasmic C terminus of rat NHE1 (amino acids 505–820) as well as smaller segments spanning that region were incubated with 35S-labeled CHP3 protein synthesized in vitro using rabbit reticulocyte lysates. Complexes of GST-NHE1 and 35S-labeled CHP3 were isolated, subjected to SDS-PAGE, and analyzed using a PhosphorImager. Contrary to the study by Li et al. (32), CHP3 associated only with the juxtamembrane region of the C terminus between residues 505 and 571 (Fig. 1), similar to the binding region of CHP1 and CHP2.
FIGURE 1.
Mapping the CHP3-binding region of NHE1. Protein binding pulldown assays were used to delineate the site of interaction of CHP3 within the cytoplasmic C terminus of NHE1. GST fusion proteins containing full-length (amino acids 505–820) or partial segments spanning the length of the C terminus of NHE1 were generated in E. coli. Purified GST fusion proteins were incubated with 35S-labeled CHP3 protein synthesized in vitro in rabbit reticulocyte lysates using a transcription-translation coupling reaction in the presence of [35S]methionine. Complexes of GST-NHE1 and 35S-labeled CHP3 were isolated from the lysates using glutathione-Sepharose™ beads and subjected to SDS-PAGE, as described under “Experimental Procedures.” The radioactivity was analyzed using a PhosphorImager (upper panel). To verify equivalent gel loading of the GST fusion proteins, a parallel gel was stained with Coomassie Blue (CB) dye (lower panel). Data shown are representative of at least three independent experiments.
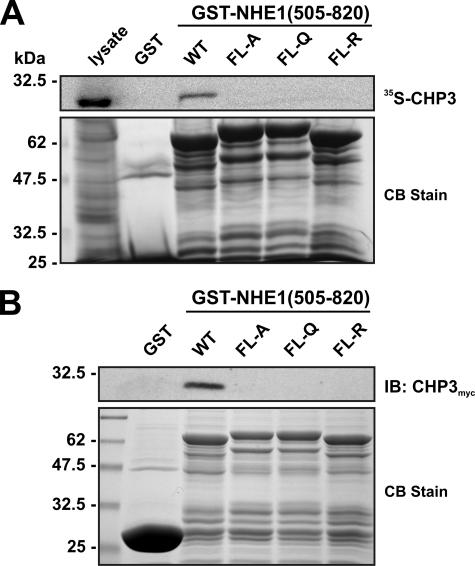
To further define the binding motif, four hydrophobic amino acids within this region of NHE1 (530FLDHLL535) that were shown previously to be crucial for direct binding of CHP1 and CHP2 (26, 27) were simultaneously mutated in the GST-NHE1(505–820) construct to either Ala, Gln, or Arg (FL-A, FL-Q, or FL-R). Mutation of these amino acids completely abolished the interaction of in vitro synthesized 35S-labeled CHP3 with GST-NHE1(505–820) (Fig. 2A). Because the 35S-labeled CHP3 protein synthesized in vitro using rabbit reticulocyte lysates may lack potential post-translational modifications important for binding to other potential sites in the NHE1 C terminus, we repeated the pulldown assay using whole cell lysates of transfected CHO cells expressing a Myc-tagged form of CHP3 (CHP3myc) and immunoblotting. As shown in Fig. 2B, CHP3myc bound to wild-type GST-NHE1(505–820) but not to the FL-A, -Q, or -R mutants.
FIGURE 2.
Mutational analysis of the CHP3-binding site of NHE1. Four hydrophobic amino acids within the juxtamembrane region of NHE1 (530FLDHLL535) that were shown previously to be crucial for direct binding of CHP1 and CHP2 were simultaneously mutated in the GST-NHE1(505–820) construct to either Ala, Gln, or Arg (FL-A, FL-Q, or FL-R). Purified wild-type (WT) and mutant GST-NHE1 fusion proteins were incubated with either rabbit reticulocyte lysates containing in vitro synthesized 35S-labeled CHP3 protein (A) or lysates of CHO cells transiently expressing exogenous CHP3myc (B). Complexes of GST-NHE1 and 35S-labeled CHP3 or CHP3myc were isolated using glutathione-Sepharose™ beads and subjected to SDS-PAGE. The levels of 35S-labeled CHP3 were analyzed using a PhosphorImager (A, upper panel), whereas the amounts of CHP3myc were detected by immunoblotting (IB) using a primary mouse monoclonal anti-Myc antibody and a secondary goat anti-mouse antibody conjugated to horseradish peroxidase (B, upper panel). To verify equivalent gel loading of the GST fusion proteins, parallel gels were stained with Coomassie blue (CB) dye (A and B, lower panel). Data shown are representative of at least three independent experiments.
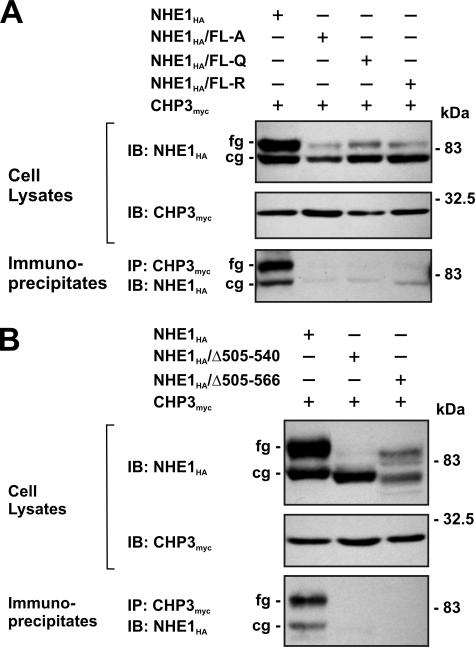
To verify the interaction between NHE1 and CHP3 in intact cells, a mutagenized CHO cell line that lacks endogenous NHE1 (i.e. AP-1 cells) was transiently transfected with either full-length wild-type or mutant forms (FL-A, -Q, or -R) of an HA epitope-tagged construct of NHE1 (NHE1HA) and CHP3myc. Following a 36-h incubation period, cell lysates were prepared and incubated with an anti-Myc antibody to precipitate CHP3myc, and aliquots of the initial lysates and resultant immunoprecipitates were resolved by SDS-PAGE and Western blotting. As shown in Fig. 3A, each of the cell lysates expressed similar amounts of CHP3myc, which migrated as a single band of ∼24 kDa, whereas the wild-type and mutant NHE1HA proteins migrated as two bands as described previously (45), i.e. a slower migrating, fully glycosylated form with an apparent molecular mass of ∼100 kDa that is present in the plasma membrane and a faster migrating, core-glycosylated form of ∼75 kDa that resides intracellularly, likely within the endoplasmic reticulum. Interestingly, each of the NHE1 mutants showed a noticeable reduction in expression of the fully glycosylated form relative to the core-glycosylated form, suggesting that processing of these mutants may be partially impaired. Probing of the blots containing the anti-Myc immunoprecipitates with an anti-HA antibody revealed strong immunoreactive bands corresponding to both the core- and fully glycosylated forms of wild-type NHE1HA, but negligible signals from lysates of cells expressing the NHE1HA/FL-A, -Q or -R mutants. The presence of both immature and mature forms of wild-type NHE1HA in the anti-Myc immunoprecipitates indicates that CHP3myc associates with NHE1HA at an early stage of the transporter's biosynthesis. The reciprocal experiment, whereby wild-type and mutant NHE1 proteins were immunoprecipitated with an anti-HA antibody, also demonstrated that CHP3myc associated only with wild-type NHE1HA (data not shown). In addition, internal deletion of segments of the C terminus of NHE1 encompassing the CHP3-binding domain, either Δ505–540 or Δ505–566, also resulted in the loss of interaction with CHP3myc when evaluated by coimmunoprecipitation (Fig. 3B).
FIGURE 3.
NHE1 forms a complex with CHP3 in transfected cells. Chinese hamster ovary AP-1 cells were transiently cotransfected with expression plasmids containing full-length CHP3myc and wild-type or mutant NHE1HA containing site-specific substitutions (FL-A, FL-Q, or FL-R) (A) or internal deletions (Δ505–540 and Δ505–566) of the CHP3-binding region (B), as indicated. After transfection (∼36 h), the cells were lysed, and a major fraction was used for immunoprecipitation (IP) analyses using a rabbit polyclonal anti-Myc antibody. Immunoblot (IB) analyses of the cell lysates and immunoprecipitates were performed as described under “Experimental Procedures.” Immunoreactive bands corresponding to the fully glycosylated (fg) and core-glycosylated (cg) forms of NHE1 are indicated beside the gels. Data shown are representative of three independent experiments.
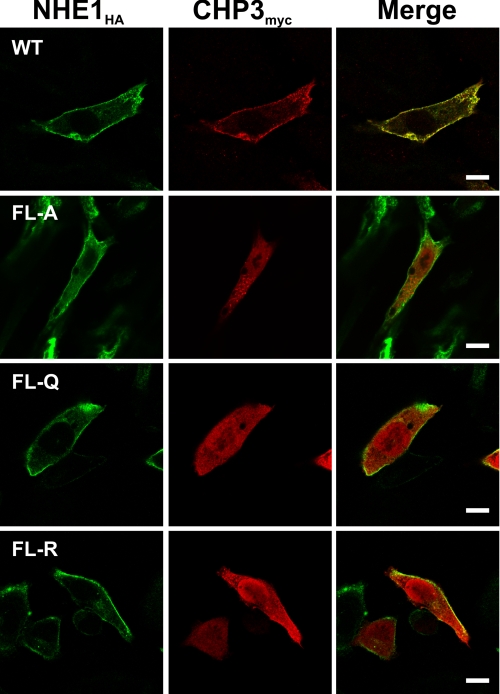
To further characterize the association of NHE1HA with CHP3myc, AP-1 cells stably expressing either wild-type or mutant forms (FL-A, -Q, or -R) of NHE1HA were transiently transfected with CHP3myc, and their subcellular distribution was compared by immunofluorescence confocal microscopy. As shown in Fig. 4, wild-type NHE1HA and CHP3myc showed low diffuse staining throughout the cell (non-nuclear) but strongly colocalized at the plasma membrane. By comparison, although the CHP3 binding-deficient mutants of NHE1HA also trafficked to the cell surface, CHP3myc was distributed largely throughout the cytoplasm and nucleus. CHP3 also displayed a diffuse distribution in transfected AP-1 cells that lack NHE1 expression (data not shown). Collectively, these analyses confirm that the juxtamembrane region of the C terminus of NHE1 serves as the principal site for binding CHP3. In addition, they indicate that the binding of CHP3 is not essential for targeting NHE1 to the plasma membrane but may facilitate the processing of the exchanger to its fully glycosylated state (as hinted by data in Fig. 3).
FIGURE 4.
Colocalization of NHE1 and CHP3 in intact cells. AP-1 cells were stably transfected with either wild-type (WT) or mutant forms (FL-A, -Q, or -R) of NHE1HA, followed by transient coexpression of CHP3myc, and their subcellular distribution was compared by immunofluorescence confocal microscopy. NHE1HA was detected with a primary mouse monoclonal anti-HA antibody and a secondary goat anti-mouse antibody conjugated to Alexa Fluor™ 488. CHP3myc was detected with a rabbit polyclonal anti-Myc antibody and a secondary goat anti-rabbit antibody conjugated to Alexa Fluor™ 568. The scale bar in the panels on the right represents 10 μm.
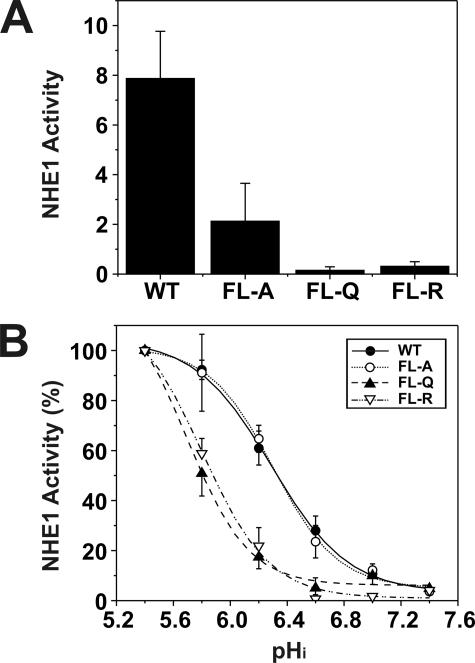
Having ascertained that the mutants were appropriately expressed and targeted to the cell surface, we proceeded to evaluate the effect of the mutations on the basal rate of transport. The expression level of the exchangers varied among the transfected lines, and meaningful comparison of their rates of transport required normalization with respect to the number of plasmalemmal exchangers. This was estimated from the relative intensities of the fully glycosylated NHE1 band in immunoblots of the stably expressing cell lines, as assessed by densitometry. Using this procedure, we compared the rates of Na+/H+ exchange in acid-loaded wild-type and mutant cells by measuring rates of H+-activated 22Na+ influx, expressed as picomoles/min/mg total cellular protein per unit density of plasmalemmal NHE1. A comparison of near maximal rates of transport is shown in Fig. 5A. Compared with wild type, the efficiency of transport of the FL-A, -Q, and -R mutants was markedly reduced to ∼26, 2, and 4%, respectively. Further examination of the rates of transport as a function of the H+ concentration (normalized to 100% at pH 5.4) showed that substitution of the critical Phe and Leu amino acids with polar residues (i.e. Glu or Arg) within the CHP3-binding region caused a profound acidic shift in the H+ sensitivity of the transporter, whereas substitution with the nonpolar Ala residue had no appreciable effect (Fig. 5B). Although the basis for the differential effects of the amino acid substitutions on H+ sensitivity is unclear, it is possible that the Gln and Arg substitutions, unlike Ala, may cause a more pronounced conformational change in the C terminus of NHE1 that significantly compromises H+ sensitivity independent of their effects on the maximal transport velocity (Vmax) of the transporter. Not withstanding, the results indicate that the motif capable of binding CHP3 (as well as other CHP isoforms) is essential for optimal Na+/H+ exchange, but the nature of the mutations that disrupt CHP binding can also autonomously affect the kinetic properties of the transporter (i.e. Vmax alone or both Vmax and H+ affinity).
FIGURE 5.
Comparative analysis of rates of H+-activated 22Na+ influx of AP-1 cells transfected with wild-type or mutant forms of NHE1. AP-1 cells stably transfected with wild-type (WT) or mutant forms (FL-A, -Q, or -R) of NHE1HA were grown to confluence in 24-well plates. Initial rates of amiloride-inhibitable H+-activated 22Na+ influx were measured at various intracellular H+ concentrations over the range of pHi 5.4 to 7.4. The pHi was adjusted by the K+-nigericin method, as described under “Experimental Procedures.” To facilitate comparison of the effects of mutating the CHP-binding site, the rates of 22Na+ influx (pmol/min/mg total cellular protein) of wild-type and mutant forms of NHE1HA were normalized to their respective plasmalemmal (fully glycosylated) protein levels, as determined by densitometry. A, comparison of the near-maximal velocities of the various NHE1 constructs. B, percentage of the transport velocities of WT and mutant NHE1 as a function of the intracellular H+ concentration, each normalized to their respective maximal rates of uptake. Values represent the mean ± S.E. of three experiments, each performed in triplicate. Error bars smaller than the symbol are absent.
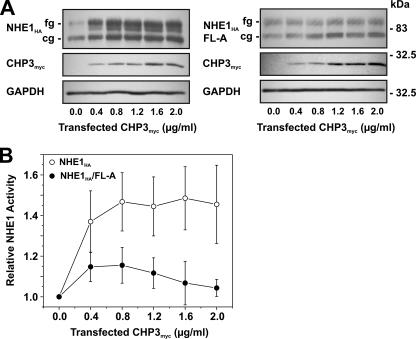
CHP3 Promotes the Maturation and Cell Surface Activity of NHE—As mentioned earlier, the data presented in Fig. 3 suggest that the binding of CHP3 may also influence the maturation of NHE1. To further examine this possibility, AP-1 cells stably expressing either wild-type NHE1HA or the mildly active NHE1HA/FL-A mutant were transiently transfected with increasing amounts of the CHP3myc-containing expression plasmid (Fig. 6A). Increasing levels of CHP3myc resulted in a corresponding increase in the abundance of both the core- and fully glycosylated forms of wild-type NHE1HA, whereas the abundances of both forms of NHE1HA/FL-A were largely unchanged. The increased abundance of wild-type NHE1HA as a function of CHP3myc expression also closely correlated with an elevation in its transport activity (Fig. 6B). By contrast, the effect of CHP3myc on NHE1HA/FL-A activity was marginal.
FIGURE 6.
Effect of overexpression of CHP3 on NHE1 abundance and activity. AP-1 cells stably expressing either wild-type NHE1HA or CHP3-binding defective mutant NHE1HA/FL-A were cultured to subconfluence in 6-well plates (10-cm2/well) for immunoblot analyses (A) or 24-well plates (2-cm2/well) for measurement of NHE1 activity (B), and then transiently transfected with empty vector or increasing amounts of the CHP3myc-containing expression plasmid relative to empty vector. The total concentration of the transfected plasmid DNA remained constant at 2 μg of DNA/ml serum-free culture medium (2.5 ml per 10-cm2 dish or 0.5 ml per 2-cm2 dish). A, following transfection (24 h), cell lysates were prepared and analyzed for NHE1HA and CHP3myc expression by SDS-PAGE and immunoblotting. Immunoreactive bands corresponding to the fully glycosylated and core-glycosylated forms of NHE1HA and CHPmyc were detected using a primary mouse monoclonal anti-HA and anti-Myc antibody, respectively, and a secondary goat anti-mouse antibody conjugated to horseradish peroxidase. As a control for protein loading, the blots were stripped and reprobed for expression of endogenous GAPDH using a primary mouse monoclonal anti-GAPDH antibody and a secondary goat anti-mouse antibody conjugated to horseradish peroxidase. B, Na+/H+ exchange activity of cells expressing wild-type NHE1HA and mutant NHE1HA/FL-A were measured as a function of CHP3 abundance. NHE activity was determined as the initial rates of amiloride-inhibitable 22Na+ influx following an acute intracellular acid load induced by prepulsing with NH +4, as described under “Experimental Procedures.” To facilitate comparison, the data were normalized to cells that do not express CHP3. Values represent the mean ± S.E. of three experiments, each performed in triplicate.
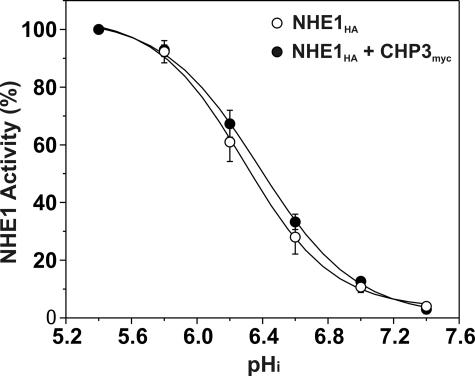
Previous studies have reported that the interaction of CHP2, but not CHP1, with wild-type NHE1 increased the exchanger's affinity for intracellular H+ in the absence of hormonal or mitogenic stimulation (27). To determine whether the activation of NHE1 in the presence of CHP3 could also reflect a change in H+ affinity, CHP3myc was stably coexpressed in the established AP-1/NHE1HA cell line. As shown in Fig. 7, the pH profile and calculated half-maximal activity or H+ affinity (KH) of NHE1HA in the presence of CHP3myc (KH = 6.39 ± 0.04) was not markedly different from NHE1HA alone (KH = 6.29 ± 0.04). Collectively, the above data support the notion that CHP3 promotes the maturation and accumulation of wild-type NHE1 at the cell surface.
FIGURE 7.
Effect of CHP3 on affinity of NHE1 for intracellular protons. AP-1 cells stably expressing wild-type NHE1HA alone or stably coexpressing NHE1HA and CHP3myc were cultured to confluence in 24-well plates. Initial rates of amiloride-inhibitable H+-activated 22Na+ influx were measured at various intracellular H+ concentrations over the range of pHi 5.4 to 7.4. The pHi was adjusted by the K+-nigericin method, as described under “Experimental Procedures.” To facilitate comparison of the effects of CHP3, the data were normalized to their respective maximal rates of uptake. Values represent the mean ± S.E. of three experiments, each performed in triplicate. Error bars smaller than the symbol are absent.
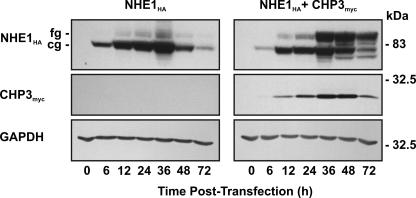
To further explore a potential role for CHP3 in the maturation of NHE1, we examined the processing of newly synthesized NHE1 in the absence or presence of CHP3 as a function of time. To this end, NHE1HA alone or in combination with CHP3myc was transiently transfected into AP-1 cells, and their expression was analyzed at various time points over a 72-h period. As shown in Fig. 8, cells expressing NHE1HA alone showed a gradual increase in the formation of both the core- and fully glycosylated forms of the exchanger, with the production of the latter lagging expectedly behind the former, but both peaking at 36 h. By comparison, cells coexpressing NHE1HA and CHP3myc showed a similar time course for production of the core- and fully glycosylated forms, but the abundance of the fully glycosylated form was markedly increased relative to the core-glycosylated form and correlated closely with the relative abundance of CHP3myc.
FIGURE 8.
Effect of CHP3 on biosynthetic maturation of NHE1. AP-1 cells were transiently cotransfected with NHE1HA and empty vector or CHP3myc. Cell lysates were prepared at the indicated time points following transfection and subjected to SDS-PAGE and immunoblotting to detect expression of fully glycosylated (fg) and core-glycosylated (cg) forms of NHE1HA and CHP3myc as described in the legend to Fig. 6. Blots were stripped and reprobed for expression of endogenous GAPDH as a control for protein loading. Data shown are representative of three independent experiments.
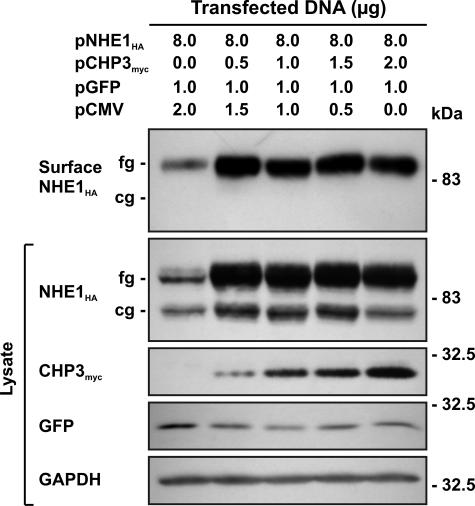
To verify that the CHP3-mediated increase in production of fully glycosylated NHE1 protein and transport activity also paralleled its accumulation at the cell surface, we performed an analogous experiment to that described in Fig. 6. AP-1 cells were transiently cotransfected with fixed amounts of NHE1HA and an increasing ratio of CHP3myc to empty vector (pCMV). The cells were also cotransfected with an expression plasmid (pGFP) that constitutively expresses green fluorescent protein as a control for transfection efficiency. Thirty six hours post-transfection, a cell surface biotinylation method (44) was used to selectively extract the plasma membrane proteins for analysis of NHE1 abundance by immunoblotting. As illustrated in Fig. 9, the fully glycosylated form of NHE1HA was the predominant species detected at the cell surface and increased as a function of the level of CHP3myc.
FIGURE 9.
Effect of CHP3 on abundance of the cell surface fully glycosylated form of NHE1. AP-1 cells were transfected with a fixed amount of expression plasmid DNA containing NHE1HA and an increasing ratio of CHP3myc to empty expression vector (pCMV). Cells were also cotransfected with a plasmid that constitutively expresses green fluorescent protein (pGFP) as a control for transfection efficiency. At 36 h post-transfection, cells were subjected to surface biotinylation as described under “Experimental Procedures,” and whole cell lysates were prepared. A major fraction of the lysates was subsequently incubated with NeutrAvidin-Sepharose beads to isolate the biotinylated cell surface proteins. Aliquots of the whole cell lysates and biotinylated cell surface proteins were subjected to SDS-PAGE and immunoblotting. Expression of fully glycosylated (fg) and core-glycosylated (cg) forms of NHE1HA and CHP3myc were detected as described in Fig. 6. GFP was detected using a primary rabbit polyclonal anti-GFP antibody and a secondary goat anti-rabbit antibody conjugated to horseradish peroxidase. Immunoblots of the lysates were stripped and reprobed for endogenous GAPDH as a control for protein loading. Data shown are representative of three independent experiments.
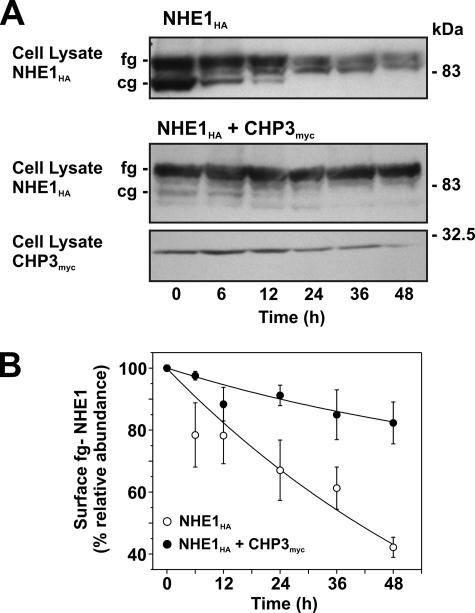
Role for CHP3 in Cell Surface Half-life of NHE1—Mechanistically, the CHP3-mediated increase in fully glycosylated NHE1 levels could arise from accelerated processing of newly translated NHE1 along the biosynthetic pathway, as suggested by the data in Fig. 8, but could also reflect increased stability of the mature protein at the cell surface, albeit these processes are not necessarily mutually exclusive. To test the latter hypothesis, the half-life of fully glycosylated NHE1HA at the cell surface was measured in the absence and presence of CHP3myc using two different approaches as follows: (i) monitoring the disappearance of fully glycosylated NHE1 over time following cycloheximide blockage of de novo protein synthesis, and (ii) measuring the longevity of fully glycosylated NHE1HA by tagging the cell surface transporter with biotin (to facilitate its isolation) and tracking its existence as a function of time. For these assays, we generated AP-1 cells that stably express either NHE1HA alone or both NHE1HA and CHP3myc.
With respect to the first approach (presented in Fig. 10A), it is noteworthy that in untreated AP-1/NHE1HA cells, the relative fractions of core- and fully glycosylated NHE1HA are similar, whereas in AP-1/NHE1HA+CHP3myc cells, the bulk of NHE1HA exists in its fully glycosylated state. These relative shifts in the proportions of the two glycosylated states of NHE1HA closely parallel the patterns observed using transiently transfected cells. Upon treatment with cycloheximide (100 μg/ml), the core-glycosylated form of NHE1HA in AP-1/NHE1HA cells gradually decreased with time, presumably reflecting maturation to the fully glycosylated form and/or protein degradation. Similarly, the fully glycosylated pool of NHE1HA was also markedly reduced by ∼58% over the 48-h treatment period, as quantitated by densitometry (Fig. 10B). In AP-1 cells stably coexpressing both NHE1HA and CHP3myc, the minor levels of core-glycosylated NHE1HA also diminished as a function of time in the presence of cycloheximide. On the other hand, the level of the fully glycosylated form appeared more stable, decreasing modestly by ∼18% at 48 h of treatment (Fig. 11, A and B), and paralleled the gradual decline in CHP3myc levels. These data are consistent with a role for CHP3 in stabilizing the fully glycosylated form of NHE1HA.
FIGURE 10.
Effect of CHP3 expression on half-life of NHE1 upon arrest of cellular protein synthesis. A, AP-1 cells stably expressing either NHE1HA alone or coexpressing both NHE1HA and CHP3myc were grown to subconfluence and then subjected to treatment with cycloheximide (100 μg/ml) to block de novo protein synthesis. At the indicated time points, cell lysates were prepared and fractionated by SDS-PAGE, followed by immunoblotting to visualize fully glycosylated (fg) and core-glycosylated (cg) NHE1HA and CHP3myc. B, fully glycosylated bands of NHE1HA presented in A were quantified by densitometry and displayed as a percentage of their maximal levels as a function of time following cycloheximide treatment. Values represent the mean ± S.E. of four experiments.
FIGURE 11.
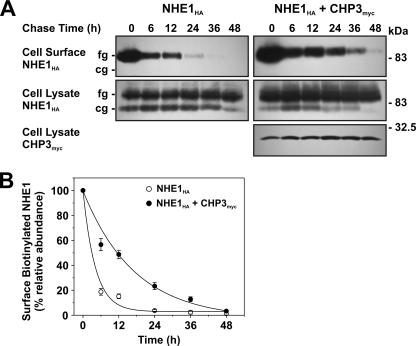
Effect of CHP3 on half-life of cell surface NHE1 tagged by biotinylation. A, AP-1 cells stably expressing NHE1HA or stably coexpressing NHE1HA and CHP3myc were subject to cell surface biotinylation, as described under “Experimental Procedures.” The cells were returned to growth media at 37 °C, and then cell lysates were prepared at varying times over a 48-h period. At each time point, a small fraction of the cell lysates was removed for immunoblotting, and the remainder was incubated with 200 μl of NeutrAvidin-Sepharose beads to extract the biotinylated proteins. Total cellular levels of fully glycosylated (fg) and core-glycosylated (cg) NHE1HA and CHP3myc as well as levels of surface biotinylated, fully glycosylated NHE1HA were monitored as a function of time by SDS-PAGE and immunoblotting, as described in the legend to Fig. 6. B, data represent densitometric analysis of the cell surface biotinylated NHE1HA presented in A, normalized as a percentage of its maximal abundance at time 0 h. Values represent the mean ± S.E. of four experiments. Error bars smaller than the symbol are absent.
To provide a more direct measure of the half-life of fully glycosylated NHE1HA present at the plasma membrane, we also performed a pulse-chase assay. Cell surface proteins were labeled with biotin using the membrane-impermeant reagent, sulfo-NHS-SS-biotin, for 30 min on ice. The excess reagent was then removed by quenching with glycine-enriched buffer and extensive washing, followed by incubation in regular culture media over a 48-h period. At each time point, the biotinylated proteins were extracted from the various cell lysates using NeutrAvidin™-Sepharose beads, fractionated by SDS-PAGE, and analyzed by immunoblotting. As shown in Fig. 11, A and B, the half-life of biotinylated, fully glycosylated NHE1HA was 3-fold higher in the presence of CHP3myc than in its absence (12.3 ± 1.5 h versus 4.1 ± 0.3 h, respectively). For each time point, the total cellular steady-state levels of NHE1HA, or NHE1HA and CHP3myc, were constant. These results corroborate the findings using cycloheximide and validate the hypothesis that CHP3 enhances the stability of NHE1 at the plasma membrane.
DISCUSSION
This study delineates the site of interaction and functional relevance of the association between the ubiquitously expressed NHE1 isoform and the third member of the CHP family of EF-hand Ca2+-binding proteins, CHP3/tescalcin. Using a combination of biochemical, immunological, and cellular techniques, we demonstrate that CHP3 binds to the same juxtamembrane segment of the cytoplasmic C terminus of NHE1 (amino acids 516–540 of human or 520–544 of rat NHE1, which are identical between these two species as well as other mammals) as CHP1 and CHP2. Recent high resolution structural analyses have revealed that this segment forms an amphipathic α-helix whose apolar face is embraced by an extended hydrophobic cavity present in both CHP1 (46, 47) and CHP2 (48). Because the same amino acids of NHE1 that confer binding to CHP1 and CHP2 are also important for the interaction with CHP3, it is likely that a similar NHE1-CHP3 complex is formed.
Functional analyses have revealed that overexpression of CHP3 enhances wild-type NHE1 activity at the cell surface chiefly by enhancing its biosynthetic maturation and stability at the plasma membrane, while having little detectable impact on its intracellular H+ sensitivity. Mutations of NHE1 (FL-A, -R, and -Q) that disrupt the binding of CHP3 (as well as other CHPs) also appeared to impede (see Fig. 3A), but not prevent, the trafficking of fully glycosylated NHE1 to the cell surface. Interestingly, these mutations also caused a pronounced reduction in intrinsic NHE1 activity. In the case of the FL-A mutant, loss of CHP3 binding markedly reduced its maximal rate of transport (Vmax) but did not appreciably alter its affinity for intracellular H+. However, for the FL-Q and FL-R mutants, drastic reductions were observed not only in Vmax but also in H+ sensitivity. These more radical substitutions, aside from disrupting CHP3 binding and NHE1 stability, may cause a more dramatic change in the conformation of the C terminus that is sufficient to broadly perturb cation translocation. Despite these differences, collectively the results indicate that the binding of CHP3 (as well as other CHP isoforms) is essential for optimal Na+/H+ exchange, both in terms of protein stability and catalysis.
Our findings are in contrast to an earlier study (32) showing that CHP3/tescalcin bound to the distal half of the C-terminal NHE1 and suppressed NHE1 activity in transfected CHO cells. The apparent discrepancies between the two studies are difficult to reconcile but may reflect differences in experimental approaches. For instance, in the former report (32), the binding of CHP3 was tested only on a single fragment derived from the extreme C terminus of human NHE1 (between amino acids 633–815; equivalent to amino acids 638–820 of rat NHE1) using an in vitro affinity blotting assay. Under the conditions employed, this technique may have revealed a low affinity binding site for CHP3 that was not readily detected using the more stringent approaches applied in this study. Alternatively, amino acid differences in this region (18 of 183 amino acids) between human and rat NHE1 could also be a factor. However, these sites are not highly conserved among mammalian species, suggesting they are unlikely to play a major role in the binding of critical regulatory proteins such as CHP. Because the precise location of this distal C-terminal site in human NHE1 was not delineated further nor manipulated experimentally, its functional relevance remains obscure. A more difficult issue to resolve between the two studies is the opposing effects of CHP3 on NHE1 activity. Although different assays methods were used to assess NHE1 activity, i.e. fluorimetric measurements of Na+-dependent H+ efflux using the pH-sensitive dye 2′,7′-bis(carboxyethyl)-5,6-carboxyfluorescein (32) versus radioisotopic measurements of H+-activated 22Na+ influx used herein, they are complementary techniques and in principal should provide equivalent outcomes. Further investigation will be required to resolve these disparities.
In comparison to CHP3, earlier studies indicated that CHP1 and CHP2 were primarily involved in regulating the H+ sensitivity of NHE1 as well as other plasma membrane-type NHEs (26, 27, 36), albeit in subtly different ways. CHP1 appeared critical for setting the resting intracellular H+ sensitivity of the exchanger in the neutral pH range and modulating its responsiveness to various stimuli (26, 33, 36). By contrast, CHP2 bound NHE1 with severalfold higher affinity than CHP1 and appeared to constitutively activate the transporter in the absence of external stimuli, resulting in marked alkalinization of steady-state intracellular pH relative to cells expressing only CHP1 (27). However, more recent evidence indicates that CHP1 may also influence NHE1 protein stability (49). Analyses of chicken B lymphoma DT40 cells containing null mutations of CHP1 showed a significant reduction in the total cellular abundance of NHE1 protein without affecting its mRNA expression, an effect consistent with either a decreased rate of translation and/or reduced post-translational processing and stability of NHE1 (49). Whether CHP2 also regulates NHE1 protein stability is unknown. Taken together, these data suggest that members of the CHP family act as positive regulators of NHE1 (and possibly other plasmalemmal NHEs) by enhancing its post-translational maturation and stability, maximal velocity, and/or intrinsic sensitivity to intracellular H+ in a manner that is dependent on the CHP isoform. In cells that express multiple CHP isoforms, it is conceivable that these ancillary proteins could act in a temporal and spatial manner to control different facets of NHE1 biosynthesis and function.
Other studies have also highlighted the critical importance of the proximal cytoplasmic C terminus for the proper functioning of the exchanger. In addition to binding CHP, this region contains two positively charged amino acid clusters that immediately flank the CHP-binding site and interact directly with the inositol phospholipid PIP2 located in the inner leaflet of the plasma membrane (30). Mutations of NHE1 that disrupt the binding of PIP2 or biochemical manipulations that sequester or deplete PIP2 in intact cells greatly reduce the transport capability of NHE1. In addition, the distal positively charged amino acid cluster has also been shown to bind the actin binding proteins ezrin, radixin, and moesin, an association that appears vital for proper organization of focal adhesions, actin stress fibers, and cell shape (31). Thus, although the precise structural basis for these functional effects is uncertain, the binding of CHP1, -2, or -3, PIP2, and ezrin/radixin/moesin, operating separately or in conjunction, may act to orient the juxtamembrane cytoplasmic C terminus of NHE1 in tight apposition with the inner membrane surface. Such a configuration may support enhanced protein maturation, stability, and optimal transport at the cell surface.
In addition to their effects on the NHEs, the CHPs also regulate other cellular processes. CHP1 (also referred to as p22) was found to play a significant role in constitutive transcytotic targeting of apical membrane proteins in epithelial cells (50). Subsequent analyses revealed that CHP1/p22 interacts with several proteins linked to the movement of vesicles along microtubules, including the kinesin-related motor protein KIF1Bβ2 (51) and the multifunctional enzyme glyceraldehyde-3-phosphate dehydrogenase (52). Moreover, CHP1/p22 expression was shown to modulate the assembly and dynamics of the microtubule cytoskeleton and endoplasmic reticulum network (53). Thus, CHP1 appears to play a broad role in the movement of membrane proteins along the biosynthetic pathway. With regard to CHP3/tescalcin, up-regulation of this isoform was found to be essential for the expression of members of the Ets family of transcription factors (i.e. Fli-1, Ets-1, and Ets-2) that promote differentiation of hematopoietic progenitor cells along the megakaryocyte lineage (54). Whether this phenomenon is linked to changes in cellular pH or through an independent pathway is unknown.
In summary, these data provide new insight into the importance of CHP3 for the optimal functioning of the Na+/H+ exchanger NHE1 isoform. CHP3 positively regulates NHE1 activity by promoting its rate of biosynthetic maturation and half-life at the cell surface as well as its maximal rate of transport.
This work was supported by grants from the Canadian Institutes for Health Research. The costs of publication of this article were defrayed in part by the payment of page charges. This article must therefore be hereby marked “advertisement” in accordance with 18 U.S.C. Section 1734 solely to indicate this fact.
Footnotes
The abbreviations used are: NHE, Na+/H+ exchanger; CHP, calcineurin B homologous protein; PIP2, phosphatidylinositol 4,5-bisphosphate; GAPDH, glyceraldehyde 3-phosphate dehydrogenase; GST, glutathione S-transferase; CHO, Chinese hamster ovary cell line; AP-1, chemically mutagenized CHO cell line devoid of plasma membrane Na+/H+ exchange activity; α-MEM, α-minimum essential medium; PBS, phosphate-buffered saline; HA, hemagglutinin; BSA, bovine serum albumin.
References
- 1.Brett, C. L., Donowitz, M., and Rao, R. (2005) Am. J. Physiol. 288 C223-C239 [DOI] [PubMed] [Google Scholar]
- 2.Orlowski, J., and Grinstein, S. (2007) Curr. Opin. Cell Biol. 19 483-492 [DOI] [PMC free article] [PubMed] [Google Scholar]
- 3.Xiang, M., Feng, M., Muend, S., and Rao, R. (2007) Proc. Natl. Acad. Sci. U. S. A. 104 18677-18681 [DOI] [PMC free article] [PubMed] [Google Scholar]
- 4.Orlowski, J., and Grinstein, S. (2004) Pfluegers Arch. 447 549-565 [DOI] [PubMed] [Google Scholar]
- 5.Bobulescu, I. A., Di Sole, F., and Moe, O. W. (2005) Curr. Opin. Nephrol. Hypertens. 14 485-494 [DOI] [PMC free article] [PubMed] [Google Scholar]
- 6.Donowitz, M., and Li, X. (2007) Physiol. Rev. 87 825-872 [DOI] [PubMed] [Google Scholar]
- 7.Meima, M. E., Mackley, J. R., and Barber, D. L. (2007) Curr. Opin. Nephrol. Hypertens. 16 365-372 [DOI] [PubMed] [Google Scholar]
- 8.Stock, C., and Schwab, A. (2006) Acta Physiol. (Oxf.) 187 149-157 [DOI] [PubMed] [Google Scholar]
- 9.Malo, M. E., and Fliegel, L. (2006) Can. J. Physiol. Pharmacol. 84 1081-1095 [DOI] [PubMed] [Google Scholar]
- 10.Wu, K. L., Khan, S., Lakhe-Reddy, S., Wang, L., Jarad, G., Miller, R. T., Konieczkowski, M., Brown, A. M., Sedor, J. R., and Schelling, J. R. (2003) Am. J. Physiol. 284 F829-F839 [DOI] [PubMed] [Google Scholar]
- 11.Wu, K. L., Khan, S., Lakhe-Reddy, S., Jarad, G., Mukherjee, A., Obejero-Paz, C. A., Konieczkowski, M., Sedor, J. R., and Schelling, J. R. (2004) J. Biol. Chem. 279 26280-26286 [DOI] [PubMed] [Google Scholar]
- 12.Sun, H. Y., Wang, N. P., Halkos, M. E., Kerendi, F., Kin, H., Wang, R. X., Guyton, R. A., and Zhao, Z. Q. (2004) Eur. J. Pharmacol. 486 121-131 [DOI] [PubMed] [Google Scholar]
- 13.Konstantinidis, D., Koliakos, G., Vafia, K., Liakos, P., Bantekas, C., Trachana, V., and Kaloyianni, M. (2006) Cell. Physiol. Biochem. 18 211-222 [DOI] [PubMed] [Google Scholar]
- 14.Malo, M. E., Li, L., and Fliegel, L. (2007) J. Biol. Chem. 282 6292-6299 [DOI] [PubMed] [Google Scholar]
- 15.Khaled, A. R., Moor, A. N., Li, A. Q., Ferris, D. K., Muegge, K., Fisher, R. J., Fliegel, L., and Durum, S. K. (2001) Mol. Cell. Biol. 21 7545-7557 [DOI] [PMC free article] [PubMed] [Google Scholar]
- 16.Takahashi, E., Abe, J., Gallis, B., Aebersold, R., Spring, D. J., Krebs, E. G., and Berk, B. C. (1999) J. Biol. Chem. 274 20206-20214 [DOI] [PubMed] [Google Scholar]
- 17.Cuello, F., Snabaitis, A. K., Cohen, M. S., Taunton, J., and Avkiran, M. (2007) Mol. Pharmacol. 71 799-806 [DOI] [PubMed] [Google Scholar]
- 18.Tominaga, T., Ishizaki, T., Narumiya, S., and Barber, D. L. (1998) EMBO J. 17 4712-4722 [DOI] [PMC free article] [PubMed] [Google Scholar]
- 19.Yan, W. H., Nehrke, K., Choi, J., and Barber, D. L. (2001) J. Biol. Chem. 276 31349-31356 [DOI] [PubMed] [Google Scholar]
- 20.Li, X., Liu, Y., Alvarez, B. V., Casey, J. R., and Fliegel, L. (2006) Biochemistry 45 2414-2424 [DOI] [PubMed] [Google Scholar]
- 21.Lehoux, S., Abe, J., Florian, J. A., and Berk, B. C. (2001) J. Biol. Chem. 276 15794-15800 [DOI] [PubMed] [Google Scholar]
- 22.Misik, A. J., Perreault, K., Holmes, C. F., and Fliegel, L. (2005) Biochemistry 44 5842-5852 [DOI] [PubMed] [Google Scholar]
- 23.Snabaitis, A. K., D'Mello, R., Dashnyam, S., and Avkiran, M. (2006) J. Biol. Chem. 281 20252-20262 [DOI] [PubMed] [Google Scholar]
- 24.Bertrand, B., Wakabayashi, S., Ikeda, T., Pouysségur, J., and Shigekawa, M. (1994) J. Biol. Chem. 269 13703-13709 [PubMed] [Google Scholar]
- 25.Lin, X., and Barber, D. L. (1996) Proc. Natl. Acad. Sci. U. S. A. 93 12631-12636 [DOI] [PMC free article] [PubMed] [Google Scholar]
- 26.Pang, T., Su, X., Wakabayashi, S., and Shigekawa, M. (2001) J. Biol. Chem. 276 17367-17372 [DOI] [PubMed] [Google Scholar]
- 27.Pang, T., Wakabayashi, S., and Shigekawa, M. (2002) J. Biol. Chem. 277 43771-43777 [DOI] [PubMed] [Google Scholar]
- 28.Inoue, H., Nakamura, Y., Nagita, M., Takai, T., Masuda, M., Nakamura, N., and Kanazawa, H. (2003) Biol. Pharm. Bull. 26 148-155 [DOI] [PubMed] [Google Scholar]
- 29.Mailander, J., Muller-Esterl, W., and Dedio, J. (2001) FEBS Lett. 507 331-335 [DOI] [PubMed] [Google Scholar]
- 30.Aharonovitz, O., Zaun, H. C., Balla, T., York, J. D., Orlowski, J., and Grinstein, S. (2000) J. Cell Biol. 150 213-224 [DOI] [PMC free article] [PubMed] [Google Scholar]
- 31.Denker, S. P., Huang, D. C., Orlowski, J., Furthmayr, H., and Barber, D. L. (2000) Mol. Cell 6 1425-1436 [DOI] [PubMed] [Google Scholar]
- 32.Li, X., Liu, Y., Kay, C. M., Muller-Esterl, W., and Fliegel, L. (2003) Biochemistry 42 7448-7456 [DOI] [PubMed] [Google Scholar]
- 33.Di Sole, F., Cerull, R., Babich, V., Quinones, H., Gisler, S. M., Biber, J., Murer, H., Burckhardt, G., Helmle-Kolb, C., and Moe, O. W. (2004) J. Biol. Chem. 279 2962-2974 [DOI] [PubMed] [Google Scholar]
- 34.Lin, X., Sikkink, R. A., Rusnak, F., and Barber, D. L. (1999) J. Biol. Chem. 274 36125-36131 [DOI] [PubMed] [Google Scholar]
- 35.Gutierrez-Ford, C., Levay, K., Gomes, A. V., Perera, E. M., Som, T., Kim, Y. M., Benovic, J. L., Berkovitz, G. D., and Slepak, V. Z. (2003) Biochemistry 42 14553-14565 [DOI] [PubMed] [Google Scholar]
- 36.Pang, T., Hisamitsu, T., Mori, H., Shigekawa, M., and Wakabayashi, S. (2004) Biochemistry 43 3628-3636 [DOI] [PubMed] [Google Scholar]
- 37.Jin, Q., Kong, B., Yang, X., Cui, B., Wei, Y., and Yang, Q. (2007) In Vivo (Athens) 21 593-598 [PubMed] [Google Scholar]
- 38.Perera, E. M., Martin, H., Seeherunvong, T., Kos, L., Hughes, I. A., Hawkins, J. R., and Berkovitz, G. D. (2001) Endocrinology 142 455-463 [DOI] [PubMed] [Google Scholar]
- 39.Orlowski, J., and Kandasamy, R. A. (1996) J. Biol. Chem. 271 19922-19927 [DOI] [PubMed] [Google Scholar]
- 40.Orlowski, J. (1993) J. Biol. Chem. 268 16369-16377 [PubMed] [Google Scholar]
- 41.Sanger, F., Nicklen, S., and Coulson, A. R. (1977) Proc. Natl. Acad. Sci. U. S. A. 74 5463-5467 [DOI] [PMC free article] [PubMed] [Google Scholar]
- 42.Rotin, D., and Grinstein, S. (1989) Am. J. Physiol. 257 C1158-C1165 [DOI] [PubMed] [Google Scholar]
- 43.Boron, W. F., and De Weer, P. (1976) J. Gen. Physiol. 67 91-112 [DOI] [PMC free article] [PubMed] [Google Scholar]
- 44.Le Bivic, A., Real, F. X., and Rodriguez-Boulan, E. (1989) Proc. Natl. Acad. Sci. U. S. A. 86 9313-9317 [DOI] [PMC free article] [PubMed] [Google Scholar]
- 45.Shrode, L. D., Gan, B. S., D'Souza, S. J., Orlowski, J., and Grinstein, S. (1998) Am. J. Physiol. 275 C431-C439 [DOI] [PubMed] [Google Scholar]
- 46.Naoe, Y., Arita, K., Hashimoto, H., Kanazawa, H., Sato, M., and Shimizu, T. (2005) J. Biol. Chem. 280 32372-32378 [DOI] [PubMed] [Google Scholar]
- 47.Mishima, M., Wakabayashi, S., and Kojima, C. (2007) J. Biol. Chem. 282 2741-2751 [DOI] [PubMed] [Google Scholar]
- 48.Ammar, Y. B., Takeda, S., Hisamitsu, T., Mori, H., and Wakabayashi, S. (2006) EMBO J. 25 2315-2325 [DOI] [PMC free article] [PubMed] [Google Scholar]
- 49.Matsushita, M., Sano, Y., Yokoyama, S., Takai, T., Inoue, H., Mitsui, K., Todo, K., Ohmori, H., and Kanazawa, H. (2007) Am. J. Physiol. 293 C246-C254 [DOI] [PubMed] [Google Scholar]
- 50.Barroso, M. R., Bernd, K. K., DeWitt, N. D., Chang, A., Mills, K., and Sztul, E. S. (1996) J. Biol. Chem. 271 10183-10187 [DOI] [PubMed] [Google Scholar]
- 51.Nakamura, N., Miyake, Y., Matsushita, M., Tanaka, S., Inoue, H., and Kanazawa, H. (2002) J. Biochem. (Tokyo) 132 483-491 [DOI] [PubMed] [Google Scholar]
- 52.Andrade, J., Pearce, S. T., Zhao, H., and Barroso, M. (2004) Biochem. J. 384 327-336 [DOI] [PMC free article] [PubMed] [Google Scholar]
- 53.Andrade, J., Zhao, H., Titus, B., Timm, P. S., and Barroso, M. (2004) Mol. Biol. Cell 15 481-496 [DOI] [PMC free article] [PubMed] [Google Scholar]
- 54.Levay, K., and Slepak, V. Z. (2007) J. Clin. Investig. 117 2672-2683 [DOI] [PMC free article] [PubMed] [Google Scholar]


