Abstract
Hepatic fatty acid elongase-5 (Elovl-5) plays an important role in long chain monounsaturated and polyunsaturated fatty acid synthesis. Elovl-5 activity is regulated during development, by diet, hormones, and drugs, and in chronic disease. This report examines the impact of elevated Elovl-5 activity on hepatic function. Adenovirus-mediated induction of Elovl5 activity in livers of C57BL/6 mice increased hepatic and plasma levels of dihomo-γ-linolenic acid (20:3,n-6) while suppressing hepatic arachidonic acid (20:4,n-6) and docosahexaenoic acid (22:6,n-3) content. The fasting-refeeding response of peroxisome proliferator-activated receptor α-regulated genes was attenuated in mice with elevated Elovl5 activity. In contrast, the fasting-refeeding response of hepatic sterol-regulatory element binding protein-1 (SREBP-1)-regulated and carbohydrate-regulatory element binding protein/Max-like factor X-regulated genes, Akt and glycogen synthase kinase (Gsk)-3β phosphorylation, and the accumulation of hepatic glycogen content and nuclear SREBP-1 were not impaired by elevated Elovl5 activity. Hepatic triglyceride content and the phosphorylation of AMP-activated kinase α and Jun kinase 1/2 were reduced by elevated Elovl5 activity. Hepatic phosphoenolpyruvate carboxykinase expression was suppressed, while hepatic glycogen content and phosphorylated Gsk-3β were significantly increased, in livers of fasted mice with increased Elovl5 activity. As such, hepatic Elovl5 activity may affect hepatic glucose production during fasting. In summary, Elovl5-induced changes in hepatic fatty acid content affect multiple pathways regulating hepatic lipid and carbohydrate composition.
Keywords: fatty acid synthesis, gene transcription, PPARα
The type and quantity of fat ingested affects hepatic lipid and carbohydrate metabolism. Feeding rodents a high-fat diet promotes obesity, increases hepatic triglyceride content, and activates stress-responsive signaling pathways (1–5). These events are linked to insulin resistance (6–8). In contrast, diets containing n-3 PUFAs, like eicosapentaenoic acid (20:5,n-3) and docosahexaenoic acid (22:6,n-3), lower hepatic and blood triglycerides and improve insulin sensitivity (9–11). The liver adapts rapidly to changes in dietary fat composition, and much of this adaptation involves changes in the expression of genes involved in glycolysis, de novo lipogenesis, fatty acid elongation, desaturation, and oxidation (12). Many of the adaptive changes in these metabolic pathways involve the fatty acid-regulated transcription factors peroxisome proliferator-activated receptor α (PPARα), sterol-regulatory element binding protein-1 (SREBP-1), and the carbohydrate-regulatory element binding protein (ChREBP)/Max-like factor X (MLX) heterodimer (12–14).
Recent studies have established that key enzymes involved in lipid synthesis are equally important in lipid metabolism, hepatic triglyceride content, insulin resistance, and dyslipidemia. Acetyl-CoA carboxylase 1 and 2 and FAS are the major enzymes involved in de novo lipogenesis; palmitate (16:0) is the end product of this pathway. The expression of these enzymes is regulated by SREBP-1, liver X receptor (LXR), and ChREBP/MLX (13, 15). Studies with the FAS-null mouse (FASKO) establish that end products of de novo lipogenesis regulate hepatic PPARα activity (16). PPARα regulates many enzymes involved in fatty acid oxidation, desaturation, and elongation (12, 17, 18). One in particular is stearoyl-CoA desaturase-1 (SCD1). SCD1 converts saturated fatty acids, like palmitate (16:0) and stearate (18:0), to monounsaturated fatty acids, like palmitoleic acid (16:1,n-7) and oleic acid (18:1,n-9), respectively. In addition to PPARα, ChREBP/MLX, LXR, and SREBP-1 regulate SCD1 expression (17, 19). In livers of SCD1-null mice, triglyceride synthesis is impaired while AMP-activated kinase (AMPK) activity is elevated. SCD1 deficiency protects mice from obesity, insulin resistance, and dyslipidemia (20–25). Finally, the hepatic fatty acid elongase, elongase-6 (Elovl-6), elongates saturated fatty acids like myristate (14:0) and 16:0 to 18:0 (26). Elovl-6 expression is regulated by SREBP-1 (27–29), an insulin- and PUFA-regulated transcription factor (30–32). Elovl-6 deficiency protects mice from obesity-induced insulin resistance (33).
Enzymes in PUFA synthesis might be equally important regulators of hepatic gene expression and lipid composition (17, 34, 35). PUFA synthesis involves fatty acid elongases and desaturases as well as peroxisomal β-oxidation (36–39). These enzymes convert essential fatty acids [linoleic acid (18:2,n-6) and α-linolenic acid (18:3,n-3)] to the end products of PUFA synthesis, arachidonic acid (20:4,n-6) and 22:6,n-3. Linoleic acid, 20:4,n-6, and 22:6,n-3 are the main PUFAs accumulating in most tissues. Twenty carbon PUFAs are robust activators PPARα, while C22 PUFAs are robust suppressors of SREBP-1 (32, 34). Both n-3 and n-6 PUFAs suppress ChREBP and MLX function, and this control process appears to be independent of PUFA chain length or desaturation status (32, 34, 40, 41). PUFA synthesis requires two fatty acid elongases (Elovl-2 and Elovl-5), two fatty acid desaturases (Δ5-desaturase and Δ6-desaturase), and peroxisomal β-oxidation (17, 35–39). PPARα and SREBP-1, but not ChREBP/MLX, control the expression of these enzymes. As such, dietary PUFAs are feedback regulators of fatty acid elongases and desaturases and feed-forward inducers of fatty acid oxidation (17).
This report focuses on hepatic fatty acid elongases. Of the seven fatty acid elongase subtypes identified in the mouse and human genomes, five elongase subtypes are expressed in human and rodent liver (35, 42). Our interest in elongases is based on studies in which rat primary hepatocytes were found to rapidly convert 20 carbon PUFAs to 22 carbon PUFAs (34). 20:5,n-3 is a robust PPARα agonist, while 22 carbon PUFAs, like 22:5,n-6 or 22:6,n-3, are weak PPARα agonists (34). At least two hepatic fatty acid elongases convert 20 carbon PUFAs to 22 carbon PUFAs: Elovl-2 and Elovl-5. Elovl-2 is a low-abundance constitutively expressed elongase, while Elovl-5 is both abundant and well regulated in liver (35, 40). Elovl-5 elongates both monounsaturated and polyunsaturated fatty acyl-CoA substrates ranging in length from 16 to 20 carbons (35). In the n-6 PUFA pathway, Elovl-5 converts 18:3,n-6 to dihomo-γ-linolenic acid (20:3,n-6), a precursor for series 1 eicosanoids. Δ6-desaturation of 20:3,n-6 generates arachidonic acid (20:4,n-6), a precursor for series 2 eicosanoids. In the n-3 PUFA pathway, Elovl-5 elongates 18:4,n-3 to 20:4,n-3; Δ5-desaturation of 20:4,n-3 generates eicosapentaenoic acid (20:5,n-3). Elovl-2 or Elovl-5 converts 20:5,n-3 to docosapentaenoic acid (22:5,n-3), which is subsequently desaturated by Δ6-desaturase and chain shortened in the peroxisome to generate 22:6,n-3. 22:6,n-3 is the end product of n-3 PUFA synthesis and a precursor to regulatory docosanoids (43). Diets enriched in 20 to 22 carbon n-3 PUFAs inhibit PUFA synthesis by suppressing Elovl-5, Δ5-desaturase, and Δ6-desaturase expression while enhancing peroxisomal β-oxidation (35, 44). High-fat diets promote glucose intolerance and suppress hepatic Elovl-5 expression. Hepatic Elovl-5 expression, however, is induced during postnatal development, in leptin deficiency, and by pharmacological ligands for PPARα (17).
Since changes in hepatic lipid composition alter PPARα-, SREBP-1-, and ChREBP/MLX-regulated gene expression (12), we suggest that changes in elongase activity will alter hepatic lipid composition and affect fatty acid-regulated gene expression. To test this hypothesis, we developed recombinant adenoviruses expressing several fatty acid elongases, including Elovl-2, Elovl-5, and Elovl-6 (17). In this report, cultured rat primary hepatocytes were used to establish the effect of recombinant adenovirus on lipid composition and gene expression following treatment with PUFAs. Studies with C57BL/6 mice were used to evaluate the effect of elevated hepatic Elovl-5 activity on gene expression and carbohydrate and lipid metabolism in a fasting and refeeding model. The outcome of these studies establishes that Elovl-5 affects the fasting and refeeding response of several pathways controlling hepatic lipid and carbohydrate composition.
MATERIALS AND METHODS
Recombinant adenovirus
Recombinant adenovirus expressing luciferase (Ad-Luc) and β-galactosidase (Ad-β-Gal) were obtained from C. Rhodes (Pacific Northwest Research Institute, Seattle, WA) (45) and L. K. Olson (Department of Physiology, Michigan State University, East Lansing, MI). Cloning and construction of recombinant adenovirus expressing Elovl-2 (Ad-Elovl2), Elovl-5 (Ad-Elovl5), and Elovl-6 (Ad-Elovl6) were described previously (17, 35). The recombinant adenovirus expressing acyl-CoA synthetase-4 was constructed using the following primers (5′ end, 5′-GTCGACATGGCAAAGAGAATAAAAGCTAAG-3′; 3′ end, 5′-AATCTTTTATTTGCCCCCATACATCCGCTC-3′) in a quantitative real-time PCR to generate the coding region of the enzyme. The cDNA was inserted into the pShuttle-CMV (Stratagene), recombined in BJ5188 cells, and propagated in XL10 Gold ultra competent cells. Ad-DNA was packaged into adenoviral particles in Ad-293 cells. The resulting adenovirus was amplified in Hek293 cells. Recombinant adenoviruses used for in vivo studies were twice purified by cesium chloride density ultracentrifugation. After centrifugation, viral particles were dialyzed against PBS + 10% sucrose, resuspended to ∼2 × 10¹² viral particles/ml in PBS + 10% sucrose, and stored at −80°C. Adenovirus was titered using the Adeno-X Rapid Titer Kit (Clontech).
Rat primary hepatocytes and C57BL/6 mice
All procedures for the use and care of animals for laboratory research were approved by the All University Committee for Animal Use and Care at Michigan State University.
For rat primary hepatocytes, male Sprague-Dawley rats were maintained on Harlan-Teklad laboratory chow (No. 8640) and water ad libitum. Rat primary hepatocytes were prepared from Teklad chow-fed (ad libitum) male Sprague-Dawley rats and cultured on BioCoat (type 1 collagen) plates (Beckon Dickinson, Belford, MA.). Cells were treated with insulin (Invitrogen, Carlsbad, CA) or fatty acids (Nu-Chek Prep, Elysian, MN) as described previously (46). 14C-labeled fatty acids ([14C]16:0, [14C]20:4,n-6 and [14C]20:5,n-3) were obtained from Perkin-Elmer. Fatty acid metabolism in rat primary hepatocytes involving lipid extraction and reverse-phase (RP)-HPLC analysis was preformed as described previously (17, 34).
Confluent primary hepatocytes were routinely infected with virus at 5 plaque-forming units/cell. This dose of virus was sufficient to infect >95% of hepatocytes, based on green fluorescent protein (Ad-GFP) expression at 24 h after infection. The medium for the infection period was Williams E medium, 10 mM lactate, 1 μM insulin, and 10 nM dexamethasone. The next morning, the medium was changed to Williams E medium, 25 mM glucose, 1 μM insulin, 10 nM dexamethasone, and 50 μM BSA in the absence or presence of fatty acids at 100–250 μM. Cells were harvested for extraction of RNA or lipid or for analysis of fatty acid elongase enzyme activity at 6 or 24 h after fatty acid treatment (17, 32, 40).
Infection of C57BL/6 mice with recombinant adenovirus
Male C57BL/6 mice (Charles River, Kalamazoo, MI; 20–22 g; ∼2 months of age) were maintained on a Harlan-Teklad (No. 8640) diet ad libitum throughout all studies. Mice were injected with recombinant adenovirus by a retro-orbital route at a dose of 2 × 10¹⁰ viral particles (cesium-purified) per mouse while under isoflurane anesthesia. Mice injected with PBS + 10% sucrose served as a “saline” control. Body weight, food intake, and water intake were monitored daily. All animals displayed no adverse effects from the saline or adenovirus injection and gained weight equally for the 4 day period after injection (see supplementary data).
Fasting and refeeding
Four days after adenoviral infection, food was removed from all animal cages at 6:00 PM for an overnight fast. The next morning (8:00 AM), food was returned to 50% of the animals in each group. Fasted and refed animals were euthanized (CO2 inhalation) at 8:00 AM and noon, respectively, for blood and tissue collection.
RNA extraction, Northern blotting, and quantitative real-time polymerase chain reaction
Total RNA was extracted from rat primary hepatocytes or mouse liver. Transcript levels were measured by Northern analysis or quantitative real-time PCR (17, 35, 40). Specific primers for each gene were described previously (17) or are listed in Table 1. Primers were designed using Primer Express software (Applied Biosystems, Foster City, CA). First-strand cDNA was synthesized using the SuperScript II RNase H reverse transcriptase (Invitrogen). Synthesized cDNA was mixed with 2× SYBR Green PCR Master Mix (Applied Biosystems) and various sets of gene-specific forward and reverse primers and subjected to real-time PCR quantification using the ABI PRISM 7700 Sequence Detection System (Applied Biosystems). All reactions were performed in triplicate. The relative amounts of mRNAs were calculated by using the comparative threshold cycle method (User Bulletin 2; Applied Biosystems). Cyclophilin was used as a control, and all results were normalized to the abundance of cyclophilin mRNA.
TABLE 1.
Primer pairs for quantitative real-time PCR
| Enzyme | Accession Number | Forward | Reverse |
|---|---|---|---|
| Mouse | |||
| Acetyl-CoA carboxylase-1 | NM_133360 | TGTCCGCACTGACTGTAACC | ATTTCCATAGCCGACTTCCA |
| Acyl-CoA oxidase | NM_015729 | CCCAACTGTGACTTCCATCA | ACGGATAGGGACAACAAAGG |
| ATP binding cassette A1 | NM_013454 | TCATGGAGAACAGCCAAGAG | GGGCAGTCCAATCTAATCCA |
| Cyclophilin | NM_008907.1 | CTTCTTGCTGGTCTTGCCATTCCT | TGGATGGCAAGCATGTGGTCTTTG |
| Cytochrome P450 4A10 | NM_010011 | TGTTTGACCCTTCCAGGTTT | CAATCACCTTCAGCTCACTCA |
| Cytochrome P450 7A | NM_007824 | GGGATTGCTGTGGTAGTGAG | AGCCCAGGTATGGATCAAC |
| Fatty acid synthase | NM_007988 | CAAATACAATGGCACCCTGA | TGGCGAAGCCGTAGTTAGTT |
| Glucokinase | NM_010292 | GAGATGGATGTGGTGGCAAT | ACCAGCTCCACATTCTGCAT |
| Glucose transporter-2 | NM_031197 | GAGGAAGTCAGGGCAAAGAA | AAGAGCTGGATCACGGAGAC |
| Interleukin 6 | NM_031168 | AGACAAAGCCAGAGTCCTTCA | AGGAGAGCATTGGAAATTGG |
| L-pyruvate kinase | NM_013631 | AGGAGTCTTCCCCTTGCTCT | ACCTGTCACCACAATCACCA |
| HMG-CoA synthase-2 | NM_008256 | CCTTGAACGAGTGGATGAGA | CAGATGCTGTTTGGGTAGCA |
| Phosphoenolpyruvate carboxykinase | NM_011044 | ACATTGCCTGGATGAAGTTTG | GGCATTTGGATTTGTCTTCAC |
| Sterol-regulatory element binding protein-1 | NM_011480 | AGGAGAACCTGACCCTACGA | GGTAAGCGTCTCCACCACTT |
| Stearoyl-CoA desaturase-1 | NM_009127 | TCAACTTCACCACGTTCTTCA | CTCCCGTCTCCAGTTCTCTT |
| Rat | |||
| Cytosolic fatty acyl thioesterase I | NM_031315 | AGTTCCTGGGTTCAATCTCC | AAGAGTGTTTACTCATGGTTCCTTT |
Lipid extraction and analysis of fatty acids
Total lipids were extracted from liver in chloroform-methanol (2:1) plus 1 mM butylated hydroxytoluene (35). 7-Nonadecenoic acid (19:1) was added as a recovery standard at the time of extraction. Protein (Bio-Rad, Hercules, CA) was measured in extracts after the initial homogenization step in 40% methanol. Total lipids were saponified, fractionated, and quantified by RP-HPLC using a YMC J-Sphere (ODS-H80) column and a gradient starting at 77.5% acetonitrile + acetic acid (0.1%) and ending at 100% acetonitrile + acetic acid (0.1%) over 90 min with a flow rate of 1.0 ml/min using a Waters 600 controller. Fatty acids were detected using ultraviolet light absorbance at 192 nm (Waters model 2487) and evaporative light scatter (Waters model 2420) and/or β-scintillation counting (INUS, IN/US Systems, Tampa, FL) (17, 34). Fatty acid standards for RP-HPLC were obtained from Nu-Chek Prep.
Elovl-5 antibody
Elovl-5 is a 28 kDa microsomal enzyme. A rabbit polyclonal antibody raised against mouse Elovl-5 was prepared by GenWay Biotech, Inc. (San Diego, Ca) using the peptide GASRRKDHLKGHQNGSV representing amino acids 258–274 of Elovl-5. The sequence has high homology to rat, mouse, and human Elovl-5. The antibody is an immunoaffinity-purified IgG. The antibody was used to detect Elovl-5 in the microsomal fraction by immunoblotting (dilution, 1:5,000).
Immunoblotting
Extracts of rat liver were prepared as described previously (35, 47) and included both a protease (Roche Diagnostics, Indianapolis, IN) and phosphatase inhibitors (1.0 mM β-glycerol phosphate, 2.5 mM Na-pyrophosphate, and 1 mM Na3VO4). Proteins (25–100 μg) extracted from cytosolic, microsomal, or nuclear fractions were separated electrophoretically by SDS-PAGE (NuPAGE 4–12% polyacrylamide Bis-Tris; Invitrogen) and transferred to nitrocellulose (BA83) membranes. Antibodies used in these studies included AMPKα (No. 2532), phospho-AMPKα (Thr172; No. 2535L), phospho-Gsk-3α/β (Ser21/9; No. 9331), and glycogen synthase kinase-3β (Gsk-3β; 27C10; No. 9315) from Cell Signaling (Danvers, MA); hepatic nuclear factor-4α (HNF-4α; H-171; No. sc-8987), extracellular receptor kinase 1 (Erk1; K-23; No. sc-94), Na,K-ATPase (No. sc-21712), phospho-Erk (E-4; No. sc-7383), phospho-JNK (Thr182/Tyr 185; No. sc-12882), JNK1 (FL; No. sc-571), p38 (A-12; No. sc-7972), phospho-p38 (D8; No. sc-7973), AKT1 (C20; No. sc-1618), phospho-AKT1/2/3 (Ser 473-R; No. sc-7985-R), MLX (N-17), and PPARα (H98) from Santa Cruz Biotechnology (Santa Cruz, CA); SREBP-1 (2A4; No. ab3259) from Abcam, Inc. (Cambridge, MA); luciferase (G7451) from Promega (Madison WI); and ChREBP (NB400135) from Novus Biologicals (Littleton, CO). The IRDye 680 and IRDye 800 secondary antibodies (anti-mouse, anti-rat, and anti-donkey) were obtained from LiCor, Inc. (Lincoln, NE). Antigen-antibody reactions were detected and quantified using a LiCor Odyssey scanner and software, respectively.
Measurement of plasma glucose, triglyceride, and cholesterol
Plasma glucose, triglyceride, and cholesterol were measured using kits from Wako (Richmond, VA). The glucose and lipid standards for the assays were included in the kits.
Measurement of hepatic glycogen and triglyceride content
Hepatic glycogen content was measured by a modification of a protocol described by others (48, 49). Briefly, liver (∼0.1 g) was homogenized in PBS, adjusted to 0.5 N KOH, and heated to 95°C for 1 h. The sample was cooled and adjusted to 0.6% Na2SO4; 3 volumes of ethanol was added to precipitate the glycogen (−20°C for ∼1 h), followed by collection of the precipitate by centrifugation (5,000 rpm for 10 min). The pellet was washed with 70% ethanol, drained, and dried. The dried pellet was resuspended in water and adjusted to 50 mM Na-acetate, pH 5. The sample was treated with amylo α-1,4-α-1,6 glucosidase (EC 3.2.1.3; Sigma) to enzymatically degrade glycogen. The released glucose was quantified by glucose oxidase using a Wako glucose assay kit.
Total hepatic lipids were extracted with chloroform-methanol (2:1) as described above. Triglyceride content in the samples was measured prior to saponification using the L-type TG H triglyceride assay kit (Wako).
Statistical analysis
The statistical analyses performed in this study included Student's t-test and ANOVA (one- and two-way) plus post hoc Tukey's honestly significant difference test http://faculty.vassar.edu/lowry/VassarStats.html). P < 0.05 was considered statistically different.
RESULTS
The cloning of hepatic elongases, development of recombinant adenoviral expression systems, and expression of elongase in rat primary hepatocytes were described previously (17, 35). Infection of rat primary hepatocytes with recombinant adenovirus expressing specific fatty acid elongases elevated elongase activity in a substrate-specific manner. Elongase enzyme activity increased by 3- to 8-fold in infected hepatocytes (17). The effects of four recombinant adenoviruses on hepatocyte lipid profiles were examined. These viruses include a control virus expressing luciferase (Ad-Luc) and viruses expressing Elovl-2, Elovl-5, and Elovl-6 (i.e., Ad-Elovl2, Ad-Elovl5, and Ad-Elovl6). After infection, cells were treated with 14C-labeled 16:0, 20:4,n-6, or 20:5,n-3 for 24 h. Total lipids were extracted, saponified, fractionated, and quantified by RP-HPLC in a system equipped with an in-line β-scintillation counter. Quantified products are presented in Table 2, while representative HPLC profiles are illustrated in supplementary Fig. I.
TABLE 2.
Effects of overexpressed fatty acid elongase on the fatty acid elongation in rat primary hepatocytes
| Recombinant Adenovirus
|
||||||||
|---|---|---|---|---|---|---|---|---|
| 14C Substrate | 14C Product | Ad-Luc | Ad-Elovl2 | Ad-Elovl5 | Ad-Elovl6 | |||
| % conversion of substrate to product | ||||||||
| 16:0 | 18:0 | 15 ± 3 | 12 ± 2 | 15 ± 3 | 51 ± 5 | |||
| 20:4,n-6 | 22:4,n-6 | 12 ± 2 | 25 ± 3 | 33 ± 5 | 12 ± 2 | |||
| 20:5,n-3 | 22:5,n-3 | 36 ± 4 | 33 ± 5 | 50 ± 5 | 33 ± 5 | |||
| 20:5,n-3 | 24:5,n-3 | <1 ± 1 | 37 ± 5 | <1 ± 1 | <1 ± 1 | |||
Rat primary hepatocytes were treated with 14C-labeled fatty acids (substrates, 100 μM; 1.6 Ci/mol) and BSA (25 μM) for 24 h. Afterward, total lipids were extracted, saponified, fractionated, and quantified by reverse-phase HPLC using a system equipped with an in-line β-scintillation counter (see supplementary Fig. I). Results are represented as percentage conversion of substrate to product, mean ± range of two or more independent assays.
Fatty acid elongation products produced in cells infected with Ad-Luc were not different from unaffected cells. Cells infected with Ad-Luc elongated 15% of 16:0 to 18:0, 12% of 20:4,n-6 to 22:4,n-6, ∼36% of 20:5,n-3 to 22:5,n-3, and <1% of 20:5,n-3 to 24:5,n-3 (Table 2). These control studies set the baseline for fatty acid elongation in primary hepatocytes. Infection of cells with Ad-Elovl2 had no effect on [14C]16:0 but increased the elongation of 20:4,n-6 to 22:4,n-6 by ∼2-fold and the formation of 24:5,n-3 from 20:5,n-3 by ∼37-fold. 20:5,n-3 is elongated to 22:5,n-3 and 24:5,n-3. The product showing the greatest change was 24:5,n-3. Infection of cells with Ad-Elovl5 had no effect on the formation of 18:0 or 24:5,n-3 in cells incubated with [14C]16:0 or [14C]20:5,n-3. Instead, Elovl-5 increased the conversion of [14C]20:4,n-6 and [14C]20:5,n-3 to 22:4,n-6 and 22:5,n-3 by 32% and 52%, respectively. Since 16:0 is a Elovl-6 substrate (26, 36, 37), infection of cells with Ad-Elovl6 increased the formation of 18:0 with no effect on the elongation of [14C]20:4,n-6 or [14C]20:5,n-3. Additional data on the substrate specificity for Elovl-2, Elovl-5, and Elovl-6 in primary hepatocytes are presented in supplementary Fig. II.
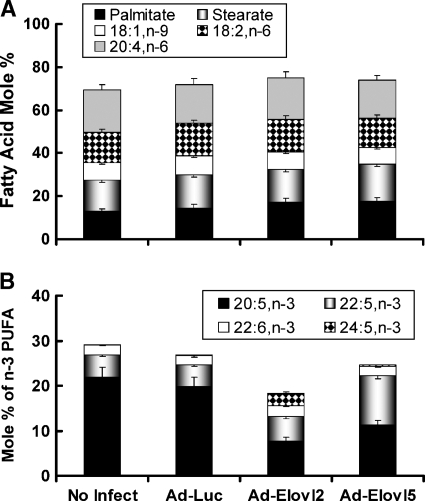
In a second study, primary hepatocytes were either uninfected or infected with Ad-Luc, Ad-Elovl2, or Ad-Elovl5 and treated with nonradioactive 20:5,n-3 (Fig. 1). 20:5,n-3 was chosen for these studies because 20:5,n-3 is a substrate for Elovl-2 and Elovl-5 (Table 2). 20:5,n-3 abundance in hepatocytes is normally very low, <0.5 mol% (34). Addition of 20:5n-3 to hepatocytes significantly increased 20:5,n-3 cellular content (to ∼20 mol%); this increase in 20:5,n-3 activates PPARα and suppresses SREBP-1, ChREBP, and MLX nuclear abundance (32, 34, 40).
Fig. 1.
Overexpressed fatty acid elongases alter hepatocyte lipid composition. Rat primary hepatocytes were either not infected with recombinant adenovirus or infected with recombinant adenovirus expressing luciferase (Ad-Luc), fatty acid elongase-2 (Elovl-2; Ad-Elovl2) or Elovl-5 (Ad-Elovl5) (see Materials and Methods). Cells were treated for 24 h with 250 μM Williams E medium containing 25 mM glucose, 50 μM BSA, 10 nM dexamethasone, and 1 μM insulin. Cells were extracted for total lipids; lipids were saponified, fractionated, and quantified by reverse-phase (RP)-HPLC (17, 34). Results are expressed as mol% (mean ± range; n = 2) and are representative of several studies. The mol% values of 16:0, 18:0, 18:1,n-7 and 18:1,n-9, 18:2,n-6, and 20:4,n-6 are shown in A; the mol% of n-3 PUFAs (20:5,n-3, 22:5,n-3, 22:6,n-3, and 24:5,n-3) are shown in B.
After infection, hepatocytes were treated with 20:5,n-3 (250 μM) for 24 h. After treatment, total lipid was extracted and saponified for fatty acid analysis (Fig. 1). Infection of rat primary hepatocytes with Ad-Luc, Ad-Elovl2, or Ad-Elovl5 had no effect on the hepatocyte content of 16–18 carbon saturated, monounsaturated, or polyunsaturated fatty acids or 20:4,n-6 (Fig. 1A). Compared with noninfected cells or Ad-Luc-infected cells, hepatocytes infected with either Ad-Elovl2 or Ad-Elovl5 significantly (∼50%) decreased intracellular 20:5,n-3 content. Ad-Elovl2 infection increased the formation of 24:5,n-3 but not 22:5,n-3. Ad-Elovl5 infection increased the formation of 22:5,n-3 but not 24:5,n-3. Neither elongase elevated the mol% of 22:6,n-3. Elevated Elovl-2, and to a lesser extend Elovl-5, decreased total cellular content of n-3 PUFAs. The decline in total cellular n-3 PUFAs may be due to increased fatty acid oxidation, since >22 carbon PUFAs are good substrates for peroxisomal β-oxidation (39, 50). The outcome of these studies established that elevated Elovl-2 and Elovl-5 expression affected the elongation of the exogenously supplied fatty acid (20:5,n-3), with no apparent effect on the elongation of other cellular fatty acids, like 20:4,n-6. As such, overexpressed fatty acid elongases using a recombinant adenovirus approach significantly modifies hepatocyte fatty acid composition.
Effects of overexpressed elongases on fatty acid-regulated hepatocyte gene expression
Since 20:5,n-3 is a well-established regulator of hepatocyte gene expression (34, 40, 51 52 53) and Ad-Elovl2 and Ad-Elovl5 alter hepatocyte 20:5,n-3 abundance (Figs. 1, 2), we determined whether changes in 20:5,n-3 metabolism are sufficient to affect hepatocyte gene expression. Our analysis focused on PPARα-regulated genes [cytochrome P450 4A (CYP4A), cytosolic fatty acid thioesterase-1 (CTE1), and mitochondrial hydroxymethylglutaryl-CoA synthase (mtHMG-CoA synthase)]; these transcripts are induced in response to 20:5,n-3 challenge of primary rat hepatocytes (34). In contrast, hepatocyte levels of SREBP-1c and ChREBP/MLX-regulated genes [L-type (liver) pyruvate kinase (L-PK)] are repressed by 20:5,n-3 (32, 40).
Fig. 2.
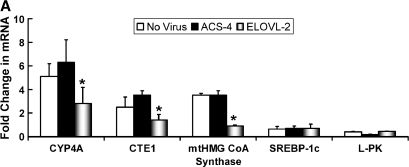
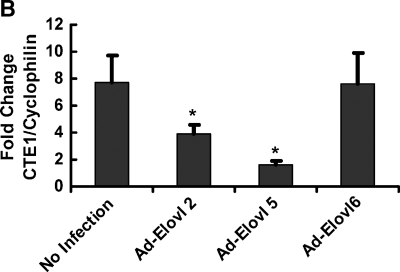
Overexpressed Elovl-2 and Elovl-5, but not Elovl-6, attenuate fatty acid induction of peroxisome proliferator-activated receptor α (PPARα)-regulated genes in rat primary hepatocytes. Rat primary hepatocytes were either not infected or infected with recombinant adenovirus expressing acyl-CoA synthetase-4 (ACS-4; A), Elovl-2 (A, B), Elovl-5 (B), or Elovl-6 (B) (see Materials and Methods). Cells were incubated in Williams E containing 25 mM glucose, 50 μM BSA, 10 nM dexamethasone, and 1.0 μM insulin in the absence or presence of 250 μM 20:5,n-3 for 24 h. After fatty acid treatment, RNA was extracted and assayed for mRNA abundance of cytochrome P450 4A (CYP4A), mitochondrial hydroxymethylglutaryl-CoA synthase (mtHMG-CoA synthase), sterol-regulatory element binding protein-1 (SREBP-1), and L-type (liver) pyruvate kinase (L-PK; A) by Northern analysis (34) or of cytosolic fatty acid thioesterase-1 (CTE1; B) by quantitative real-time PCR (Table 1; see Materials and Methods) (17). Results are expressed as fold change in mRNA induced by 20:5,n-3 treatment (mean ± SD, n = 6). * P ⩽ 0.05, no infection versus Ad-Elovl2 or Ad-Elovl5.
Fatty acid elongases use fatty acyl-CoA as a substrate, not free fatty acids (36, 37). As such, we were concerned with the possibility that overexpressed fatty acid elongases might enhance fatty acyl-CoA formation and affect fatty acid control of gene expression. To address this question, we developed a recombinant adenovirus expressing acyl-CoA synthetase-4 (Ad-ACS4); ACS4 preferentially converts C20-PUFAs to fatty acyl-CoA thioesters (54). Analysis of ACS enzyme activity (54) in Ad-ACS4-infected hepatocytes showed that it was elevated by 4-fold (data not shown).
In the absence of viral infection, treatment of primary hepatocytes with 20:5,n-3 induced mRNAs encoding CYP4A, CTE1, and mtHMG-CoA-synthase by 5-, 2.5-, and 3.5-fold, respectively (Fig. 2A). mRNAs encoding SREBP-1c and L-PK were suppressed by ∼50% by this treatment. Overexpressed ACS4 had no effect on the 20:5,n-3 control of these genes. In contrast, overexpressed Elovl-2 attenuated the 20:5,n-3-mediated induction of CYP4A, CTE1, and mtHMG-CoA synthase by ∼50%. Overexpressed Elovl-2 or Elovl-5, however, did not affect the fatty acid regulation of SREBP-1c or ChREBP/MLX-regulated genes.
In a second study, we compared the effects of three elongases on the 20:5,n-3 control of mRNACTE1, a PPARα target gene (55, 56). 20:5,n-3 treatment of rat primary hepatocytes induced mRNACTE1 by nearly 8-fold (Fig. 2B). In cells infected with Ad-Elovl2 or Ad-Elovl5, the 20:5-mediated induction of CTE1 was attenuated by >50%. In contrast, overexpressed Elovl-6 had no effect on 20:5,n-3 control of CTE1.
These studies establish that elevated expression of Elovl-2 or Elovl-5, but not Elovl-6, attenuates 20:5,n-3 control of PPARα target genes in rat primary hepatocytes. These effects are due to the action of the elongase and not the formation of the fatty acyl-CoA substrate, or adenoviral infection, per se. Overexpressed Elovl-2 or Elovl-5, however, did not affect the fatty acid regulation of SREBP-1, a SREBP-regulated gene, or LPK, a ChREBP/MLX-regulated gene (Fig. 2A).
Effects of overexpressed Elovl-5 on mouse liver gene expression
To determine whether elevated elongase expression affected hepatic gene expression in vivo, C57BL/6 mice were infected with Ad-Elovl5 and a control virus, Ad-Luc. Elovl-5 was chosen for these studies because Elovl-5 is the most abundant fatty acid elongase expressed in rat, mouse, and human liver (17). Moreover, Elovl-5 is well regulated during postnatal development by PPARα agonist and is elevated in leptin-deficient obesity but suppressed by high-fat diets (17, 35). Four days after infection, mice were fasted overnight. The next day, half of the mice in each group were fed a Teklad chow diet for 4 h. During the course of the study, body weight and food consumption were not different between the Ad-Luc and Ad-Elovl5 groups (see supplementary data Fig. 3). Liver weight (fasted Ad-Luc, 1.2 ± 0.2 g; fasted Ad-Elovl5, 1.2 ± 0.1 g; fed Ad-Luc, 1.4 ± 0.2 g; fed Ad-Elovl5, 1.5 ± 0.1 g) also was not different between groups.
Fig. 3.
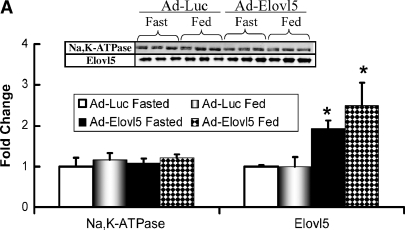
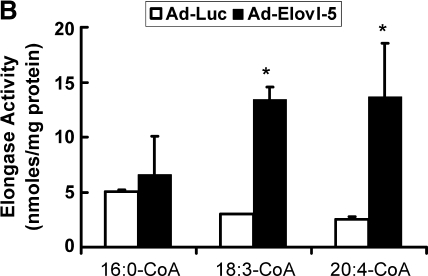
Fatty acid elongase expression in livers of C57BL/6 mice infected with Ad-Luc or Ad-Elovl5. Mice received recombinant adenovirus (Ad-Luc or Ad-Elovl5) by retro-orbital injection of 2 × 10¹⁰ viral particles/mouse. After injection, mice received Teklad chow and water ad libitum. Mice showed no change in body weight or stress over the 5 day experiment. Food consumption was not different between groups (see supplementary Fig. III). Four days after injection, animals were euthanized (CO2 inhalation) for blood and tissue recovery. A: Postnuclear liver homogenates were assayed for Na,K-ATPase and Elovl-5 content by immunoblots (upper panel). Levels of immunoreactivity were normalized to values seen in fasted Ad-Luc-infected animals. Results are expressed as fold change in Na,K-ATPase or Elovl-5 (mean ± SD, n = 3). * P < 0.05 versus fasted Ad-Luc-infected animals. B: Hepatic microsomes were prepared for the elongation assay. Three substrates were used, [14C]16:0-CoA, [14C]18:3,n-6, and [14C]20:4,n-6 (17). Results are expressed as elongase activity (nmol substrate converted to elongated product/mg protein; mean ± SD, n = 4). Results are representative of four separate studies. * P ⩽ 0.05, Ad-Luc versus Ad-Elovl5 infection.
Quantitative real-time PCR analysis indicated that transcripts expressing Elovl-5 were increased by ∼30-fold in liver, but Elovl-5 mRNA abundance remained unaffected in heart, brain, and kidney. Animals receiving Ad-Luc showed no change in hepatic Elovl-5 expression. Ad-Luc-infected animals expressed luciferase in liver as determined by quantitative real-time PCR and immunocytochemistry (data not shown).
Levels of hepatic Elovl-5 were measured in Ad-Luc- and Ad-Elovl5-infected animals by immunoblot analysis (Fig. 3A) and enzyme activity (Fig. 3B). Na,K-ATPase was used as a control for the immunoblot studies; hepatic Na,K-ATPase content remained unaffected by fasting or refeeding as well as Ad-Luc and Ad-Elovl5 infection. In Ad-Elovl5-infected animals, hepatic Elovl-5 protein was increased by ∼2-fold compared with Elovl-5 expression in Ad-Luc-infected animals. Elovl-5 protein abundance remained unaffected by fasting or refeeding in both Ad-Luc- and Ad-Elovl5-infected animals (Fig. 3A).
Elovl-5 enzyme activity was measured using three substrates (16:0-CoA, 18:3,n-6-CoA, and 20:4,n-6-CoA) (Fig. 3B). Microsomes were prepared from fed Ad-Luc- and Ad-Elovl5-infected animals. Fatty acid elongase activity in Ad-Luc-infected mouse liver was comparable to that seen in uninfected C57BL/6 mice (data not shown). Mice infected with Ad-Elovl5 had no effect on elongase activity when using 16:0-CoA as substrate. This was expected, since 16:0-CoA is not an Elovl-5 substrate (36, 37). Hepatic Elovl-5 enzyme activity increased by >3-fold using 18:3-CoA or 20:4-CoA as substrate; both 18:3,n-6 and 20:4,n-6 are Elovl-5 substrates (36, 37) (Fig. 2; see supplementary data).
Fatty acid-regulated gene expression
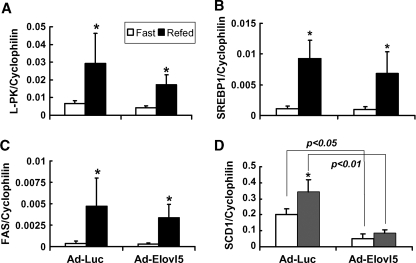
The effect of Ad-Luc and Ad-Elovl5 infection on hepatic gene expression was examined in both the fasted and fed states. The expression of genes involved in glycolysis (L-PK) and fatty acid synthesis (FAS and SCD1) and the transcription factor controlling de novo lipogenesis (SREBP-1) is induced by refeeding fasted animals and repressed by dietary PUFAs (57, 58). Ad-Luc infection did not affect the induction of hepatic L-PK, FAS, SREBP-1, or SCD1 (Fig. 4A–D) in response to refeeding. The expression of acetyl-CoA carboxylase-1 and glucose transporter-2, other SREBP-1- and ChREBP/MLX-regulated genes (14, 59), also was not affected by elevated luciferase expression. In contrast, SCD1 expression was significantly repressed in livers of both fasted and fed animals expressing elevated Elovl-5. The expression of Δ5- and Δ6-desaturase, however, was not significantly affected by elevated Elovl-5 activity (data not shown).
Fig. 4.
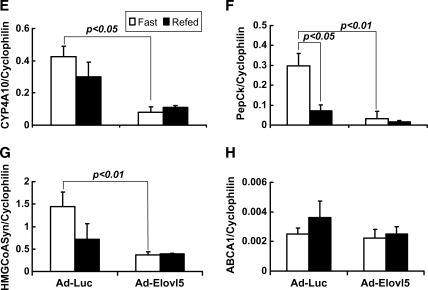
Effects of overexpressed luciferase and Elovl-5 on hepatic gene expression in fasted and fed C57BL/6 mice. Total RNA was extracted from livers of fasted and refed mice infected with either Ad-Luc or Ad-Elovl5. Transcript abundance was measured by quantitative real-time PCR (Table 1) (17). Transcripts measured included cyclophilin, L-PK (A), SREBP-1 (B), FAS (C), stearoyl-CoA desaturase (SCD1; D), CYP4A10 (E), phosphoenolpyruvate carboxykinase (PepCk; F), HMG-CoA synthase (G), and ABCA1 (H). Results are expressed as relative transcript abundance (transcript/cyclophilin; mean ± SD, n = 4). For panels A–C, * P < 0.05, by Student's t-test; for panels D–G, P values are shown, by ANOVA.
Figure 4E–H illustrates the effects of elevated Elovl-5 activity on PPARα-regulated genes [CYP4A10, mtHMG-CoA synthase, and phosphoenolpyruvate carboxykinase (PepCk)] and the LXR-regulated gene ABCA1. Microsomal CYP4A10 and mtHMG-CoA synthase are involved in fatty acid oxidation. PepCk is a gluconeogenic enzyme; its expression is strongly suppressed by elevated blood insulin levels (60). The PepCk promoter binds PPARα in liver cells derived from fasted animals (61). ABCA1 is involved in cholesterol efflux. ABCA1 expression shows a modest response to fasting and refeeding (62).
Refeeding Ad-Luc-infected animals suppressed the expression of CYP4A10, mtHMG-CoA synthase, and PepCk. In Ad-Elovl5-infected animals, however, the mRNA abundance for CYP4A10, mtHMG-CoA synthase, and PepCk was not induced in response to fasting. Feeding these animals did not suppress the expression of these transcripts further. The expression of acyl-CoA oxidase, another PPARα target gene, was repressed by Elovl-5 overexpression (data not shown). Expression of ABCA1 (Fig. 4H) and CYP7A (data not shown), two LXR-regulated genes, was not significantly affected by elevated Elovl-5 activity.
Elevated expression of Elovl-5 had no significant effect on SREBP-1-, ChREBP/MLX-, or LXR-regulated gene expression. Only PPARα-regulated transcripts (SCD1, CYP4A10, PepCk, mtHMG-CoA synthase, and acyl-CoA oxidase) were affected by elevated hepatic Elovl-5 activity. These in vivo studies confirm the cell culture studies (Fig. 2) indicating that changes in Elovl-5 expression affect PPARα-regulated gene expression without affecting SREBP-1- or ChREBP/MLX-regulated genes.
Mechanisms controlling PPARα function
The effect of elevated Elovl-5 expression on hepatic fatty acid-regulated genes affects PPARα target genes but not SREBP-1- or ChREBP/MLX-regulated genes. In an effort to identify possible mechanisms to explain this effect, PPARα nuclear abundance and the cell signaling pathway affecting PPARα activity were examined (63).
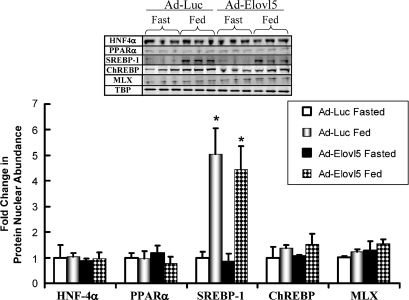
The nuclear abundance of PPARα, HNF-4α, SREBP-1, ChREBP, and MLX was examined in livers from fasted and fed mice (Fig. 5). Fasting and refeeding had no significant effect on the nuclear abundance of HNF-4α, PPARα, MLX, or TATA binding protein. As expected, refeeding mice significantly increased SREBP-1 nuclear content (∼5-fold). ChREBP nuclear content increased by ∼50% by refeeding. These results are comparable to those from previous studies with C57BL/6 mice (17). Infection of mice with Ad-Elovl5 did not significantly affect the nuclear abundance of PPARα, HNF-4α, SREBP-1, ChREBP, or MLX. Hepatic PPARα mRNA abundance also was not significantly affected by elevated Elovl-5 activity. As such, major changes in PPARα expression cannot explain the attenuated expression of hepatic PPARα-regulated genes in Ad-Elovl5-infected mice.
Fig. 5.
Effects of overexpressed luciferase or Elovl-5 on the nuclear abundance of hepatic nuclear factor-4α (HNF-4α), SREBP-1, carbohydrate-regulatory element binding protein (ChREBP), Max-like factor X (MLX), PPARα, and TATA binding protein (TBP). Hepatic nuclear proteins were prepared from fasted and fed Ad-Luc- and Ad-Elovl5-infected mice, electrophoretically separated, and assayed for HNF-4α, SREBP-1, ChREBP, MLX, PPARα, and TATA binding protein by immunoblotting (upper panel). Immunoblots were quantified using LiCor Odyssey. These results are normalized to the protein abundance in fasted Ad-Luc-infected animals. Results are presented as fold change in nuclear protein abundance (mean ± SD, n = 3). The results reported here are representative of two or more separate experiments. * P < 0.01, Ad-Luc versus Ad-Elovl5, by ANOVA.
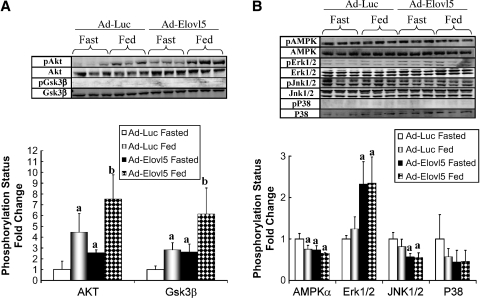
PPARα is a phosphoprotein, and its activity is regulated by several cell signaling pathways (63). Gsk-3β phosphorylation of PPARα suppresses PPARα nuclear content. Akt phosphorylates Gsk-3β, inactivating Gsk-3β. Akt and Gsk-3β phosphorylation status was significantly elevated in livers of fasted mice expressing elevated hepatic Elovl-5 activity (Fig. 6A). Both kinases showed significant increases in phosphorylation in response to feeding in Ad-Luc- and Ad-Elovl5-infected mice. These results cannot explain the effect of elevated Elovl-5 activity on PPARα-regulated gene expression.
Fig. 6.
Effects of overexpressed luciferase or Elovl-5 on the phosphorylation status of Akt, glycogen synthase kinase-3β (Gsk-3β), AMP-activated kinase (AMPK) α, extracellular receptor kinase 1/2 (Erk1/2), Jun kinase (JNK) 1/2, and p38. Postnuclear hepatic proteins were prepared from Ad-Luc- and Ad-Elovl5-infected mice, electrophoretically separated, and assayed for total protein and phosphoprotein by immunoblotting (upper panels). Immunoblots were quantified using LiCor Odyssey, and the phosphoprotein-total protein ratio was calculated. Results are normalized to the phosphoprotein-total protein ratio in the fasted Ad-Luc-infected animals. A: Results for Akt and Gsk-3β. B: Results for AMPKα, Erk1/2, JNK1/2, and p38. Results are presented as phosphorylation status fold change (mean ± SD, n = 3). The results reported here are representative of two or more separate studies. a P < 0.05, treatment versus Ad-Luc fasted; b P < 0.05, treatment versus Ad-Elovl5 fasted; both by ANOVA.
Phosphorylation of PPARα by AMPK, Erk1/2, Jun kinase (JNK) 1/2, and p38 is associated with elevated PPARα activity (63). The phosphorylation status of AMPKα, the regulatory subunit of AMPK, decreased 40% by feeding Ad-Luc-infected mice (Fig. 6B). Hepatic AMPKα phosphorylation status was suppressed (∼40%) in both fasted and fed Ad-Elovl5-infected mice compared with fasted Ad-Luc-infected animals. Increased Elovl-5 activity was correlated in increased Erk1/2 phosphorylation in livers of both fasted and fed mice. Hepatic Erk1/2 phosphorylation status, however, was unaffected by fasting and feeding in both Ad-Luc- and Ad-Elovl5-infected mice. JNK1/2 phosphorylation status decreased by 50% in mice infected with Ad-Elovl5. p38 phosphorylation status was not significantly affected by elevated Elovl-5 activity.
The outcome of these studies provides several important findings. First, changes in hepatic Elovl-5 activity induce significant changes in several cell signaling pathways. Second, suppression of AMPKα and JNK1/2 phosphorylation status may account for the decline in PPARα-regulated gene expression in livers with elevated Elovl-5 expression. Third, targets of insulin action [i.e., Akt, Gsk-3β, and Erk1/2 (64)] show increased phosphorylation in livers of fasted animals from Ad-Elovl5-infected mice. As such, these results provide no evidence to suggest that elevated Elovl-5 impairs insulin regulation of hepatic function.
Elevated hepatic Elovl-5 activity affects plasma and hepatic carbohydrate and lipid composition
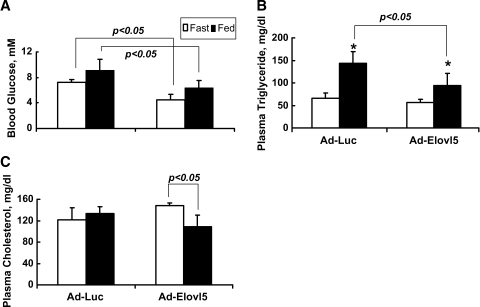
Since elevated hepatic Elovl-5 induced changes in gene expression and cell signaling pathways controlling carbohydrate and lipid metabolism, we determined whether these effects resulted in changes in plasma and hepatic glucose and lipid content. Plasma glucose was significantly reduced in both fasted and fed animals expressing elevated hepatic Elovl-5 activity (Fig. 7A). Plasma triglycerides were induced by ∼2.2-fold and 1.6-fold by feeding Ad-Luc- and Ad-Elovl5-infected animals, respectively (Fig. 7B). Compared with Ad-Luc-infected mice, however, plasma triglycerides were significantly suppressed in fed Ad-Elovl5-infected mice. While plasma cholesterol was not affected by feeding Ad-Luc animals, plasma cholesterol in fed Ad-Elovl5 mice was reduced significantly (20%) (Fig. 7C). Since food intake was not different between Ad-Luc- and Ad-Elovl5-infected mice, these differences likely reflect changes in metabolism induced by elevate hepatic Elovl-5 activity.
Fig. 7.
Blood glucose, cholesterol, and triglyceride levels in fasted and fed adenovirus-infected mice. C57BL/6 mice were infected with recombinant adenovirus expressing luciferase (Ad-Luc) or Elovl-5 (Ad-Elovl5) as described in the legend to Fig. 3 and Materials and Methods. Four days after infection, all mice were starved overnight. The next morning (8:00 AM), half of the mice in each group were fed chow. Fasted mice were euthanized at 8:00 AM, and fed mice were euthanized 4 h after initiating feeding (12:00 PM). Blood glucose (A), cholesterol (B), and triglycerides (C) were measured in fasted and fed animals (see Materials and Methods). Results are reported as means ± SD (n = 4 per group). Statistical differences as determined by ANOVA in blood glucose, triglycerides, and cholesterol between the four groups are noted. * P < 0.05, fasted versus fed for either the Ad-Luc or Ad-Elovl5 group, by ANOVA.
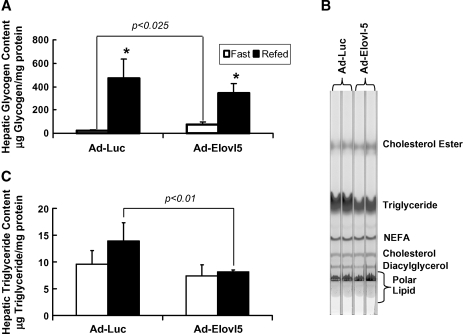
Hepatic glycogen content was examined as a measure of glucose/insulin control of hepatic carbohydrate metabolism. Hepatic glycogen content was significantly elevated by 20- and 5-fold as a result of feeding Ad-Luc- and Ad-Elovl5-infected animals, respectively (Fig. 8A). This difference in response was not due to a significant difference in total glycogen in the fed state but to the residual glycogen remaining in the liver of fasted mice. Increased hepatic glycogen in livers of fasted mice expressing elevated Elovl-5 activity correlates with the increased level of Gsk-3β phosphorylation (Fig. 6). Phospho-Gsk-3β does not suppress glycogen synthase activity.
Fig. 8.
Hepatic glycogen and triglyceride contents in Ad-Luc- and Ad-Elovl5-infected C57Bl/6 mice. A: Hepatic glycogen content was measured in the fasted and fed mice (see Materials and Methods). Results are expressed as hepatic glycogen content (mg glucose/mg protein; mean ± SD, n = 4 per group). For fasted animals, Ad-Luc versus Ad-Elovl5, P < 0.025; * P ⩽ 0.005, fasted versus fed for either the Ad-Luc or Ad-Elovl5 group, by ANOVA. B: Total lipids were extracted from mouse liver of animals infected with Ad-Luc or Ad-Elovl5 and separated by TLC, stained with iodine, and photographed. Standards for complex lipids (cholesteryl esters, triglyceride, diacylglycerol, and phospholipids and sphingolipids) and NEFAs and cholesterol were obtained from Nu-Chek Prep and Avanti Polar Lipids (Alabaster, AL) (76). C: Triglyceride content in the total lipid extract was measured using a triglyceride kit from Wako. Results are expressed as μg triglyceride/mg protein (mean ± SD, n = 4). P ⩽ 0.01, fed Ad-Luc versus fed Ad-Elovl5 group, by ANOVA.
Analysis of hepatic lipid composition by TLC revealed a modest change in triglyceride content but no change in other lipids, like cholesterol esters, diacylglycerol, cholesterol, or polar lipids (Fig. 8B). Direct measure of hepatic triglyceride content showed a 50% reduction in livers of fed Ad-Elovl5-infected mice compared with fed Ad-Luc-infected mice (Fig. 8C).
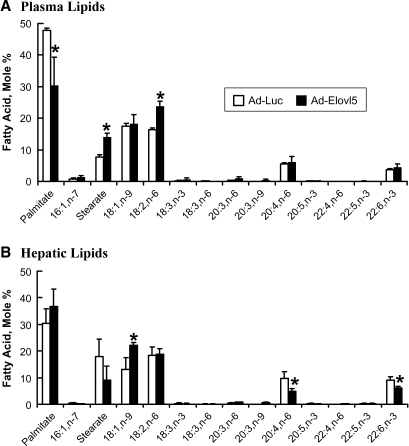
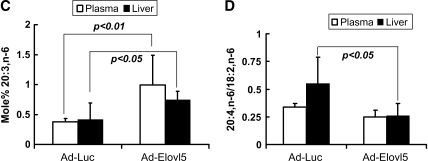
Analysis of the plasma and hepatic fatty acid profiles by HPLC revealed modest but significant changes (Fig. 9). Dihomo-γ-linolenic acid (20:3,n-6), a product of Elovl-5 elongation of 18:3,n-6, is a minor fatty acid in liver and plasma representing <2 mol%. Elevated Elovl-5 activity significantly increased 20:3,n-6 (∼2-fold) in both plasma and liver (Fig. 9C). Hepatic 20:4,n-6 was decreased significantly (∼40%) in Ad-Elovl5-infected mice, with no change in plasma 20:4,n-6 (Fig. 9A, B). When normalized for hepatic 18:2,n-6 content, the 20:4,n-6/18:2,n-6 ratio (Fig. 9D) was also suppressed. Hepatic 22:6,n-3 was also suppressed by ∼40% in livers with elevated Elovl-5 activity. These results establish that changes in hepatic Elovl-5 activity will affect both hepatic and plasma lipids.
Fig. 9.
Plasma and hepatic lipid composition in animals infected with recombinant adenovirus expressing luciferase or Elovl-5. A, B: Total lipid from plasma (A) and liver (B) of fasted mice was extracted, saponified, fractionated, and quantified by RP-HPLC (17, 34). Results are expressed as mol% (mean ± SD, n = 4). * P < 0.05, fasted versus fed for either the Ad-Luc or Ad-Elovl5 group, by Student's t-test. C: Mol% of 20:3,n-6. D: Mole ratio of 20:4,n-6/18:2,n-6. Data for the graphic representation of 20:3,n-6 and 20:4,n-6/18:6,n-6 were derived from Fig. 9A, B. Results are expressed as means ± SD (n = 4). P values were calculated for Ad-Luc versus Ad-Elovl5, by Student's t-test.
Elevated hepatic Elovl-5 activity also affects saturated fatty acid levels. Compared with fasted Ad-Luc-infected mice, plasma levels of 16:0 were significantly lower in Ad-Elovl5-infected mice. In contrast, plasma levels of 18:0 were significantly higher (Fig. 9A). Elevated hepatic Elovl-5 activity did not significantly affect saturated fatty acid abundance in liver.
DISCUSSION
Hepatic gene expression and cell signaling pathways are sensitive to changes in hepatic lipid content (12). Fatty acid elongases represent a class of lipid-metabolizing enzymes that have only recently received attention (36, 37, 65). At least seven elongase subtypes are expressed in human and rodents, each with unique substrate specificity. Several of these elongases are well regulated by diet, hormones, and drugs (17, 26, 28, 35–37). Recent gene ablation studies in mice established an important role for Elovl-6 in lipid metabolism and insulin sensitivity (33, 36, 37, 66). Here, we determined whether changes in fatty elongase activity affected hepatic function. The outcome of these studies establish that Elovl-5, a well-regulated hepatic elongase (17, 35), significantly affects hepatic gene expression, cell signaling, and hepatic and plasma lipid and carbohydrate composition.
Fatty acid elongase effects on hepatocyte gene expression
A recombinant adenovirus approach was used to assess the effects of elevated Elovl-2, Elovl-5, and Elovl-6 activity on rat primary hepatocyte fatty acid metabolism and gene expression. Elovl-2 and Elovl-5, but not Elovl-6, elongated 20 carbon PUFAs to 22 or 24 carbon PUFAs. The consequences of this metabolism were a significant reduction in hepatocyte 20:5,n-3 abundance and a significant increase in 22 and 24 carbon PUFAs (Table 1, Fig. 1). When added to cells, 20:5,n-3 is a robust PPARα activator in rat primary hepatocytes (34). Lowering hepatocyte 20:5,n-3 levels attenuates the expression of PPARα-regulated gene expression (Table 2, Figs.1, 2). There is also a significant decline in total n-3 PUFAs with Ad-Elovl2 and Ad-Elovl5 infection. These results suggest that elevated Elovl-2 and Elovl-5 may induce the oxidation of these fatty acids. The outcome of these studies confirms a previous report wherein fatty acid structure was found to be an important determinant in controlling PPARα activity (34). In contrast to PPARα, 20:5,n-3 control of SREBP-1- or ChREBP/MLX-regulated genes was not affected by overexpressed Elovl-2 or Elovl-5 (Fig. 2). Both 20 and 22 carbon n-3 PUFAs control the nuclear abundance of SREBP-1 and ChREBP/MLX (12, 32, 40, 41). These cell culture studies support our hypothesis that fatty acid elongases change hepatic lipid composition and regulate hepatic gene expression.
Elovl-5 effects on hepatic gene expression in C57BL/6 mice
The in vivo studies focused on Elovl-5 because this enzyme is both abundant and well regulated in rodent liver (17, 35). A fasting and refeeding approach was used to control PPARα-, SREBP-1-, and ChREBP/MLX-regulated gene expression in vivo (13, 14, 35, 40, 67). The outcome of these studies essentially confirmed the primary hepatocyte results. PPARα-regulated, but not SREBP-1- or ChREBP/MLX-regulated, genes were affected by elevated Elovl-5 activity (Fig. 4). 20:5,n-3 is a minor fatty acid in livers of mice fed a Teklad chow diet. As such, changes in 20:5,n-3 induced by Elovl-5 likely do not affect hepatic PPARα activity. Instead, failure of hepatic PPARα-regulated genes to respond to fasting may be linked to the 50% reduction in hepatic 20:4,n-6 abundance (Fig. 9). 20:4,n-6 is the major 20 carbon PUFA in liver and is a good PPARα agonist (34). Interestingly, other putative ligands, such as 16:0, 18:2,n-6, and 18:1,n-9 (68), did not change significantly. As such, changes in 20:4,n-6 may not fully account for the abrogated response of PPARα-regulated genes to fasting.
Other factors controlling PPARα function in liver include PPARα nuclear abundance and its phosphorylation status (63). While hepatic PPARα nuclear abundance was not significantly affected by elevated Elovl-5, several cell signaling pathways controlling PPARα activity were affected (Figs. 5, 6). AMPK, JNK, and p38 phosphorylate PPARα and increase its activity (63). While phospho-p38 levels were not significantly affected by elevated Elovl-5 activity, hepatic phospho-JNK1/2 and phospho-AMPKα were reduced by ∼40% (Fig. 6). The attenuated phosphorylation status of these two cell signaling pathways may contribute to the abrogated response of PPARα-regulated gene expression to fasting in Ad-Elovl5-infected mice. Although our studies point to an effect of altered Elovl-5 expression on PPARα-regulated gene expression, it is possible that this is just a coincidence. Other possible mechanisms might account for our findings, such as effects on key cofactors controlling PPARα-regulated genes or other mechanisms controlling the cellular abundance of the transcripts examined.
Elovl-5 effects on hepatic fat metabolism
Based on studies with PPARα-null mice (67) and the lowering of expression of enzymes involved in fatty acid oxidation (Fig. 4), we expected hepatic triglyceride content to increase in fasting. Elevated Elovl-5 had the opposite effect: hepatic triglycerides did not increase in fasting. Moreover, the normal increase in hepatic triglycerides with feeding was blunted in animals infected with Ad-Elovl5 (Fig. 8). Hepatic triglyceride content in fed mice is determined by the uptake of fatty acids and chylomicron remnants, reesterification in the liver, as well as de novo lipogenesis and triglyceride synthesis. Studies with the SCD1-null mouse have established an important role for this enzyme in the formation of 18:1,n-9 for triglyceride synthesis (24). Elevated Elovl-5 activity suppresses SCD1 (Fig. 4). Whether the lower levels of hepatic triglycerides in Ad-Elovl5-infected mice are due solely to suppressed SCD1 expression or other mechanisms will require additional study.
Elevated Elovl-5 activity altered both saturated fatty acid and PUFA content in liver and plasma. Linoleic acid (18:2,n-6), the major dietary n-6 PUFA, is converted to 18:3,n-6 by Δ6-desaturase; 18:3,n-6 is a substrate for Elovl-5 (Fig. 2; see supplementary data). Increased Elovl-5 activity elevated 20:3,n-6 levels in both plasma and liver (Fig. 9C). As such, changes in hepatic elongase activity have systemic effects by changing plasma lipid profiles. Despite increased 20:3,n-6, hepatic 20:4,n-6 levels were reduced by 50% in these mice. Hepatic 22:6,n-3 levels were also reduced. This outcome suggests that elevated Elovl-5 activity inhibits the formation of end products of the n-6 and n-3 PUFA pathway. Lower levels of 20:4,n-6 and 22:6,n-3 were seen in livers from both fasted (Fig. 9) and fed (data not shown) mice. Plasma 20:4,n-6 and 22:6,n-3 levels do not increase, arguing against the increased secretion of these PUFAs as VLDL triglyceride, phospholipid, or cholesteryl ester. It seems unlikely that elevated hepatic 20:3,n-6 levels inhibit Δ5-desaturase activity. One explanation may be related to the normal expression of Elovl-5 relative to Δ5- and Δ6-desaturases. Hepatic levels of Elovl-5, Δ5-desaturase, and Δ6-desaturase are coordinately regulated during postnatal development and in response to dietary fish oil (35). Elevated Elovl-5 activity does not significantly affect Δ5- or Δ6-desaturase activity. A change in the relative abundance of these enzymes may redirect excess n-6 PUFA production to β-oxidation. Further analysis of this pathway will be required to define the metabolic fate of hepatic 20:4,n-6 and 22:6,n-3 when Elovl-5 activity is elevated.
Increased hepatic Elovl-5 activity significantly altered plasma saturated fatty acid abundance (Fig. 9). Compared with Ad-Luc-infected mice, the mol% of plasma 16:0 decreased while 18:0 mol% increased in Ad-Elovl5-infected mice (Fig. 9). Since 16:0 is not a substrate for Elovl-5 (36, 37) (Fig. 2; see supplementary data), a changes in saturated fatty acid type cannot be explained by the direct action of Elovl-5. Instead, elevated Elovl-5 activity suppressed hepatic SCD1 expression in liver (Fig. 4D). SCD1 desaturates 16:0 and 18:0 to form 16:1n-7 and 18:1,n-9. Elovl-5 and Elovl-6 elongate 16:1,n-7 to 18:1,n-7 (17). In mice with ablated SCD1, 18:0 accumulates in liver (24), whereas 18:0 accumulates in the plasma of mice with elevated hepatic Elovl-5 (Fig. 9A, B). In both chronic and acute models of SCD1 deficiency (69–72), plasma triglycerides are reduced, as is seen with elevated Elovl-5 (Fig. 7B). Suppressing SCD1 expression may account, in part, for the decline in hepatic and plasma triglyceride levels (Figs. 7, 8). In contrast to the acute suppression of SCD1 expression (71), hepatic triglycerides are not elevated in livers of mice with elevated Elovl-5 activity (Fig. 8B, C). Elevated hepatic triglycerides are associated with insulin resistance (6–8) and JNK activation (2, 3). Consistent with the lower hepatic triglyceride content, stress-activated signaling pathways like JNK and p38 are not induced in livers with elevated Elovl-5 expression (Fig. 6). Both acute SCD1 suppression and elevated Elovl-5 activity enhance Akt phosphorylation (Fig. 6) and suppress PepCk mRNA (Fig. 4) (71). Unlike acute SCD1 suppression, however, elevated Elovl-5 activity does not suppress lipogenic gene expression (71) but suppresses PPARα-regulated genes involved in fatty acid oxidation (Fig. 4).
Effects of elevated Elovl-5 on hepatic glycogen metabolism
Hepatic glycogen content was significantly higher in livers of fasted mice with elevated Elovl-5 activity (Fig. 8). Hepatic glycogen content is regulated by the balance of glycogen synthesis and glycogenolysis. The phosphorylation status of both Akt and Gsk-3β was higher in livers of fasted mice expressing elevated Elovl-5 (Fig. 6). Phosphorylation of Gsk-3β attenuates Gsk-3β kinase activity (64), suppressing Gsk-3β-mediated inhibition of glycogen synthase activity (73, 74). As such, hepatic glycogen synthesis may be higher in fasted animals with elevated Elovl-5 activity. Elevated hepatic Elovl-5 activity also suppressed PepCk expression during fasting (Fig. 4F). PepCk is a key gluconeogenic enzyme involved in hepatic glucose production. These studies suggest that changes in Elovl-5 activity regulate hepatic glucose storage and production. Elevated hepatic Elovl-5 activity lowers plasma glucose levels (Fig. 7A). As downstream targets of insulin action (30, 64, 75), these results reveal no apparent interference with hepatic insulin action. Considering the role the liver plays in the maintenance of blood glucose, more studies are required to further define how changes in Elovl-5 activity affect hepatic carbohydrate metabolism. Studies with Elovl-6 (33) and SCD1 (20 –23) have revealed that chronic changes in these enzymes affect the onset of diet-induced insulin resistance and dyslipidemia. Whether chronic changes in Elovl-5 have similar effects as Elovl-6 and SCD1 on hepatic and whole body lipid metabolism remains to be established.
In summary, acute elevation of hepatic Elovl-5 activity affects the expression of PPARα-regulated genes without affecting SREBP-1- or ChREBP/MLX-regulated genes. This effect can be linked the suppression of cellular PPARα ligands and the phosphorylation status of two signaling pathways affecting PPARα activity (i.e., AMPK and JNK1/2). More important, however, is the finding that hepatic Elovl-5 affects hepatic lipid and carbohydrate metabolism. Changes in hepatic metabolism also affect blood lipids and glucose content. The fact that Elovl-5 is suppressed in diabetes (17) raises the question of whether chronic changes in Elovl-5 activity contribute to impaired lipid and carbohydrate metabolism associated with diet-induced diabetes.
Acknowledgments
The authors thank Christopher J. Rhodes (University of Chicago, Chicago, IL) for generously providing the recombinant adenovirus expressing luciferase.
Abbreviations
ACS, acyl-CoA synthetase
AMPK, AMP-activated kinase
ChREBP, carbohydrate-regulatory element binding protein
CTE1, cytosolic fatty acid thioesterase-1
CYP4A, cytochrome P450 4A
Elovl, fatty acid elongase
Erk, extracellular receptor kinase
Gsk-3β, glycogen synthase kinase-3β
HNF-4α, hepatic nuclear factor-4α
JNK, Jun kinase
L-PK, L-type (liver) pyruvate kinase
LXR, liver X receptor
MLX, Max-like factor X
mtHMG-CoA synthase, mitochondrial hydroxymethylglutaryl-CoA synthase
PepCk, phosphoenolpyruvate carboxykinase
PPARα, peroxisome proliferator-activated receptor α
RP, reverse-phase
SCD1, stearoyl-CoA desaturase
SREBP, sterol-regulatory element binding protein
Published, JLR Papers in Press, March 30, 2008.
Footnotes
This project was supported by the National Institutes of Health (Grant DK-43220), the National Research Initiative of the U.S. Department of Agriculture Cooperative State Research, Education and Extension Service (2003-35200-13400), the Michigan Agriculture Experiment Station, and the College of Health and Human Sciences at Oregon State University.
The online version of this article (available at http://www.jlr.org) contains supplementary data in the form of four figures.
References
- 1.West D. B., J. Waguespack, and S. McCollister. 1995. Dietary obesity in the mouse: interaction of strain with diet composition. Am. J. Physiol. 268 R658–R665. [DOI] [PubMed] [Google Scholar]
- 2.Samuel V. T. 2004. Mechanism of heptic insulin resistance in non-alcoholic fatty liver disease. J. Biol. Chem. 279 32345–32353. [DOI] [PubMed] [Google Scholar]
- 3.Hirosumi J. 2002. A central role for JNK in obesity and insulin resistance. Nature. 420 333–336. [DOI] [PubMed] [Google Scholar]
- 4.West D. B., C. N. Boozer, D. L. Moody, and R. L. Atkinson. 1992. Dietary obesity in nine inbred mouse strains. Am. J. Physiol. 262 R1025–R1032. [DOI] [PubMed] [Google Scholar]
- 5.Schemmel R., O. Mickelsen, and J. L. Gill. 1970. Dietary obesity in rats: body weight and body acretion in seven strains of rats. J. Nutr. 100 1041–1048. [DOI] [PubMed] [Google Scholar]
- 6.Chen M. T., L. N. Kaufman, T. Spennetta, and E. Shrago. 1992. Effects of high fat-feeding to rats on the interrelationship of body weight, plasma insulin and fatty acyl CoA esters in liver and skeletal muscle. Metabolism. 41 564–596. [DOI] [PubMed] [Google Scholar]
- 7.Griffen M. E. 1999. Free fatty acid-induced insulin resistance is associated with activation of protein kinase C theta and alterations in insulin signaling cascade. Diabetes. 48 1270–1274. [DOI] [PubMed] [Google Scholar]
- 8.Kraegon E. W., G. J. Cooney, J. M. Ye, A. L. Thompson, and S. M. Furler. 2001. The role of lipids in the pathogenesis of muscle insulin resistance and beta cell failure in type II diabetes and obesity. Exp. Clin. Endocrinol. Diabetes. 109 (Suppl. 2): 189–201. [DOI] [PubMed] [Google Scholar]
- 9.Perez-Matute P., N. Perez-Echarri, J. A. Martinez, A. Marti, and M. J. Moreno-Aliaga. 2007. Eicosapentaenoic acid actions on adiposity and insulin resistance in control and high-fat-fed rats: role of apoptosis, adiponectin and tumour necrosis factor-alpha. Br. J. Nutr. 97 389–398. [DOI] [PubMed] [Google Scholar]
- 10.Winzell M. S., G. Pacini, and B. Ahren. 2006. Insulin secretion after dietary supplementation with conjugated linoleic acids and n-3 polyunsaturated fatty acids in normal and insulin-resistant mice. Am. J. Physiol. Endocrinol. Metab. 290 E347–E354. [DOI] [PubMed] [Google Scholar]
- 11.Sekiya M., N. Yahagi, T. Matsuzaka, Y. Najima, M. Nakakuki, R. Nagai, S. Ishibashi, J. Osuga, N. Yamada, and H. Shimano. 2003. Polyunsaturated fatty acids ameliorate hepatic steatosis in obese mice by SREBP-1 suppression. Hepatology. 38 1529–1539. [DOI] [PubMed] [Google Scholar]
- 12.Jump D. B. 2008. Polyunsaturated fatty acid regulation of hepatic gene transcription. Curr. Opin. Lipidol. 19 242–247. [DOI] [PMC free article] [PubMed] [Google Scholar]
- 13.Postic C., R. Dentin, P. D. Denechaud, and J. Girard. 2007. ChREBP, a transcriptional regulator of glucose and lipid metabolism. Annu. Rev. Nutr. 27 179–192. [DOI] [PubMed] [Google Scholar]
- 14.Horton J. D., J. L. Goldstein, and M. S. Brown. 2002. SREBPs: activators of the complete program of cholesterol and fatty acid synthesis in the liver. J. Clin. Invest. 109 1125–1131. [DOI] [PMC free article] [PubMed] [Google Scholar]
- 15.Joseph S. B., B. A. Laffitte, P. H. Patel, M. A. Watson, K. E. Matsukuma, R. Walczak, J. L. Collins, T. F. Osborne, and P. Tontonoz. 2002. Direct and indirect mechanisms for regulation of fatty acid synthase gene expression by liver X receptors. J. Biol. Chem. 277 11019–11025. [DOI] [PubMed] [Google Scholar]
- 16.Chakravarthy M. V., Z. Pan, Y. Zhu, K. Tordjman, J. G. Schneider, T. Coleman, J. Turk, and C. F. Semenkovich. 2005. “New” hepatic fat activates PPARalpha to maintain glucose, lipid, and cholesterol homeostasis. Cell Metab. 1 309–322. [DOI] [PubMed] [Google Scholar]
- 17.Wang Y., Botolin, D., J. Xu, B. Christian, E. Mitchell, B. Jayaprakasam, M. Nair, J. M. Peters, J. Busik, L. K. Olson, et al. 2006. Regulation of hepatic fatty acid elongase and desaturase expression in diabetes and obesity. J. Lipid Res. 47 2028–2041. [DOI] [PMC free article] [PubMed] [Google Scholar]
- 18.Lee S. S., T. Pineau, J. Drago, E. J. Lee, J. W. Owens, D. L. Kroetz, P. M. Fernandez-Salguero, H. Westphal, and F. J. Gonzalez. 1995. Targeted disruption of the alpha isoform of the peroxisome proliferator-activated receptor gene in mice results in abolishment of the pleiotropic effects of peroxisome proliferators. Mol. Cell. Biol. 15 3012–3022. [DOI] [PMC free article] [PubMed] [Google Scholar]
- 19.Sampath H., and J. M. Ntambi. 2005. Polyunsaturated fatty acid regulation of genes of lipid metabolism. Annu. Rev. Nutr. 25 317–340. [DOI] [PubMed] [Google Scholar]
- 20.Flowers J. B., M. E. Rabaglia, K. L. Schueler, M. T. Flowers, H. Lan, M. P. Keller, J. M. Ntambi, and A. D. Attie. 2007. Loss of stearoyl-CoA desaturase-1 improves insulin sensitivity in lean mice but worsens diabetes in leptin-deficient obese mice. Diabetes. 56 1228–1239. [DOI] [PubMed] [Google Scholar]
- 21.Attie A. D., M. T. Flowers, J. B. Flowers, A. K. Groen, F. Kuipers, and J. M. Ntambi. 2007. Stearoyl-CoA desaturase deficiency, hypercholesterolemia, cholestasis, and diabetes. Nutr. Rev. 65 (Suppl.): 35–38. [DOI] [PubMed] [Google Scholar]
- 22.Miyazaki M., M. T. Flowers, H. Sampath, K. Chu, C. Otzelberger, X. Liu, and J. M. Ntambi. 2007. Hepatic stearoyl-CoA desaturase-1 deficiency protects mice from carbohydrate-induced adiposity and hepatic steatosis. Cell Metab. 6 484–496. [DOI] [PubMed] [Google Scholar]
- 23.Flowers M. T., M. Miyazaki, X. Liu, and J. M. Ntambi. 2006. Probing the role of stearoyl-CoA desaturase-1 in hepatic insulin resistance. J. Clin. Invest. 116 1478–1481. [DOI] [PMC free article] [PubMed] [Google Scholar]
- 24.Miyazaki M., Y. C. Kim, and J. M. Ntambi. 2001. A lipogenic diet in mice with a disruption of the stearoyl-CoA desaturase 1 gene reveals a stringent requirement of endogenous monounsaturated fatty acids for triglyceride synthesis. J. Lipid Res. 42 1018–1024. [PubMed] [Google Scholar]
- 25.Dobrzyn P., A. Dobrzyn, M. Miyazaki, P. Cohen, E. Asilmaz, D. G. Hardie, J. M. Friedman, and J. M. Ntambi. 2004. Stearoyl-CoA desaturase 1 deficiency increases fatty acid oxidation by activating AMP-activated protein kinase in liver. Proc. Natl. Acad. Sci. USA. 101 6409–6414. [DOI] [PMC free article] [PubMed] [Google Scholar]
- 26.Moon Y. A., N. A. Shah, S. Mohapatra, J. A. Warrington, and J. D. Horton. 2001. Identification of a mammalian long chain fatty acyl elongase regulated by sterol regulatory element-binding proteins. J. Biol. Chem. 276 45358–45366. [DOI] [PubMed] [Google Scholar]
- 27.Moon Y. A., and J. D. Horton. 2003. Identification of two mammalian reductases involved in the two-carbon fatty acyl elongation cascade. J. Biol. Chem. 278 7335–7343. [DOI] [PubMed] [Google Scholar]
- 28.Matsuzaka T., H. Shimano, N. Yahagi, T. Yoshikawa, M. Amemiya-Kudo, A. H. Hasty, H. Okazaki, Y. Tamura, Y. Iizuka, K. Ohashi, et al. 2002. Cloning and characterization of a mammalian fatty acyl-CoA elongase as a lipogenic enzyme regulated by SREBPs. J. Lipid Res. 43 911–920. [PubMed] [Google Scholar]
- 29.Kumadaki S., T. Matsuzaka, T. Kato, N. Yahagi, T. Yamamoto, S. Okada, K. Kobayashi, A. Takahashi, S. Yatoh, H. Suzuki, et al. 2008. Mouse Elovl-6 promoter is an SREBP target. Biochem. Biophys. Res. Commun. 368 261–266. [DOI] [PubMed] [Google Scholar]
- 30.Shimomura I., Y. Bashmakov, S. Ikemoto, J. D. Horton, M. S. Brown, and J. L. Goldstein. 1999. Insulin selectively increases SREBP-1c mRNA in the livers of rats with streptozotocin-induced diabetes. Proc. Natl. Acad. Sci. USA. 96 13656–13661. [DOI] [PMC free article] [PubMed] [Google Scholar]
- 31.Fleischmann M., and P. B. Iynedjian. 2000. Regulation of sterol regulatory-element binding protein 1 gene expression in liver: role of insulin and protein kinase B/cAkt. Biochem. J. 349 13–17. [DOI] [PMC free article] [PubMed] [Google Scholar]
- 32.Botolin D., Y. Wang, B. Christian, and D. B. Jump. 2006. Docosahexaneoic acid [22:6,n-3] stimulates rat hepatic sterol regulatory element binding protein-1c (SREBP-1c) degradation by an Erk-and 26S proteasome-dependent pathway. J. Lipid Res. 47 181–192. [DOI] [PMC free article] [PubMed] [Google Scholar]
- 33.Matsuzaka T., H. Shimano, N. Yahagi, T. Kato, A. Atsumi, T. Yamamoto, N. Inoue, M. Ishikawa, S. Okada, N. Ishigaki, et al. 2007. Crucial role of a long-chain fatty acid elongase, Elovl6, in obesity-induced insulin resistance. Nat. Med. 13 1193–1202. [DOI] [PubMed] [Google Scholar]
- 34.Pawar A., and D. B. Jump. 2003. Unsaturated fatty acid regulation of peroxisome proliferator activated receptor-alpha activity in primary rat hepatocytes. J. Biol. Chem. 278 35931–35939. [DOI] [PubMed] [Google Scholar]
- 35.Wang Y., D. Botolin, B. Christian, C. Busik, J. Xu, and D. B. Jump. 2005. Tissue-specific, nutritional and developmental regulation of rat fatty acid elongases. J. Lipid Res. 46 706–715. [DOI] [PMC free article] [PubMed] [Google Scholar]
- 36.Jakobsson A., R. Westerberg, and A. Jacobsson. 2006. Fatty acid elongases in mammals: their regulation and role in metabolism. Prog. Lipid Res. 45 237–249. [DOI] [PubMed] [Google Scholar]
- 37.Leonard A. E., S. L. Pereira, H. Sprecher, and Y. S. Huang. 2004. Elongation of long-chain fatty acids. Prog. Lipid Res. 43 36–54. [DOI] [PubMed] [Google Scholar]
- 38.Nakamura M. T., and T. Y. Nara. 2004. Structure, function and dietary regulation of delta6, delta 5 and delta 9 desaturases. Annu. Rev. Nutr. 24 345–376. [DOI] [PubMed] [Google Scholar]
- 39.Sprecher H. 2000. Metabolism of highly unsaturated n-3 and n-6 fatty acids. Biochim. Biophys. Acta. 1486 219–231. [DOI] [PubMed] [Google Scholar]
- 40.Xu J., B. Christian, and D. B. Jump. 2006. Regulation of rat hepatic L-pyruvate kinase promoter composition and activity by glucose, n-3 PUFA and peroxisome proliferator activated receptor-alpha agonist. J. Biol. Chem. 281 18351–18362. [DOI] [PMC free article] [PubMed] [Google Scholar]
- 41.Dentin R., F. Benhamed, J. P. Pegorier, F. Foufelle, B. Viollet, S. Vaulont, J. Girard, and C. Postic. 2005. Polyunsaturated fatty acids suppress glycolytic and lipogenic genes through the inhibition of ChREBP nuclear protein translocation. J. Clin. Invest. 115 2843–2854. [DOI] [PMC free article] [PubMed] [Google Scholar]
- 42.Brolinson, A., S. Fourcade, A. Jakobsson, A. Pujol, and A. Jacobsson. 2008. Steroid hormones control circadian Elovl3 expression in mouse liver. Endocrinology. In press. doi:10.1210/en.2007-1402. [DOI] [PubMed]
- 43.Serhan C. N. 2005. Novel eicosanoid and docosanoid mediators: resolvins, docosatrienes, and neuroprotectins. Curr. Opin. Clin. Nutr. Metab. Care. 8 115–121. [DOI] [PubMed] [Google Scholar]
- 44.Ren B., A. P. Thelen, J. M. Peters, F. J. Gonzalez, and D. B. Jump. 1997. Polyunsaturated fatty acid suppression of hepatic fatty acid synthase and S14 gene expression does not require peroxisome proliferator-activated receptor alpha. J. Biol. Chem. 272 26827–26832. [DOI] [PubMed] [Google Scholar]
- 45.Wrede C. E., L. M. Dickson, M. K. Lingohr, I. Briaud, and C. J. Rhodes. 2002. Protein kinase B/Akt prevents fatty acid-induced apoptosis in pancreatic beta-cells (INS-1). J. Biol. Chem. 277 49676–49684. [DOI] [PubMed] [Google Scholar]
- 46.Pawar A., D. Botolin, D. J. Mangelsdorf, and D. B. Jump. 2003. The role of liver X receptor-alpha (LXR-alpha) in the fatty acid regulation of hepatic gene expression. J. Biol. Chem. 278 40736–40743. [DOI] [PubMed] [Google Scholar]
- 47.Botolin D., and D. B. Jump. 2003. Selective proteolytic processing of rat hepatic sterol regulatory element binding protein-1 (SREBP-1) and SREBP-2 during postnatal development. J. Biol. Chem. 278 6959–6962. [DOI] [PubMed] [Google Scholar]
- 48.Kim Y. B., O. D. Peroni, W. G. Aschenbach, Y. Minokoshi, K. Kotani, A. Zisman, C. R. Kahn, L. J. Goodyear, and B. B. Kahn. 2005. Muscle-specific deletion of the Glut4 glucose transporter alters multiple regulatory steps in glycogen metabolism. Mol. Cell. Biol. 25 9713–9723. [DOI] [PMC free article] [PubMed] [Google Scholar]
- 49.Chan T. M., and J. H. Exton. 1976. A rapid method for the determination of glycogen content and radioactivity in small quantities of tissue or isolated hepatocytes. Anal. Biochem. 71 96–105. [DOI] [PubMed] [Google Scholar]
- 50.Reddy J. K., and G. P. Mannaerts. 1994. Peroxisomal lipid metabolism. Annu. Rev. Nutr. 14 343–370. [DOI] [PubMed] [Google Scholar]
- 51.Mater M. K., A. P. Thelen, D. A. Pan, and D. B. Jump. 1999. Sterol regulatory element-binding protein 1c (SREBP1c) is involved in the polyunsaturated fatty acid suppression of hepatic S14 gene transcription. J. Biol. Chem. 274 32725–32732. [DOI] [PubMed] [Google Scholar]
- 52.Jump D. B. 2004. Fatty acid regulation of gene transcription. Crit. Rev. Clin. Lab. Sci. 41 41–78. [DOI] [PubMed] [Google Scholar]
- 53.Pan D. A., M. K. Mater, A. P. Thelen, J. M. Peters, F. J. Gonzalez, and D. B. Jump. 2000. Evidence against the peroxisome proliferator-activated receptor alpha (PPARalpha) as the mediator for polyunsaturated fatty acid suppression of hepatic L-pyruvate kinase gene transcription. J. Lipid Res. 41 742–751. [PubMed] [Google Scholar]
- 54.Lewin T. M., J. H. Kim, D. A. Granger, J. E. Vance, and R. A. Coleman. 2001. Acyl-CoA synthetase isoforms 1, 4, and 5 are present in different subcellular membranes in rat liver and can be inhibited independently. J. Biol. Chem. 276 24674–24679. [DOI] [PubMed] [Google Scholar]
- 55.Hunt M. C., and S. E. Alexson. 2002. The role acyl-CoA thioesterases play in mediating intracellular lipid metabolism. Prog. Lipid Res. 41 99–130. [DOI] [PubMed] [Google Scholar]
- 56.Huhtinen K., J. O'Byrne, P. J. Lindquist, J. A. Contreras, and S. E. Alexson. 2002. The peroxisome proliferator-induced cytosolic type I acyl-CoA thioesterase (CTE-I) is a serine-histidine-aspartic acid alpha/beta hydrolase. J. Biol. Chem. 277 3424–3432. [DOI] [PubMed] [Google Scholar]
- 57.Hillgartner F. B., L. M. Salati, and A. G. Goodridge. 1995. Physiological and molecular mechanisms involved in nutritional regulation of fatty acid synthesis. Physiol. Rev. 75 47–76. [DOI] [PubMed] [Google Scholar]
- 58.Ntambi J. M., and M. Miyazaki. 2003. Recent insights into stearoyl-CoA desaturase-1. Curr. Opin. Lipidol. 14 255–261. [DOI] [PubMed] [Google Scholar]
- 59.Ma L., N. G. Tsatsos, and H. C. Towle. 2005. Direct role of ChREBP.Mlx in regulating hepatic glucose-responsive genes. J. Biol. Chem. 280 12019–12027. [DOI] [PubMed] [Google Scholar]
- 60.Hanson R. W., and L. Reshef. 1997. Regulation of phosphoenolpyruvate carboxykinase (GTP) gene expression. Annu. Rev. Biochem. 66 581–611. [DOI] [PubMed] [Google Scholar]
- 61.Cassuto H., K. Kochan, K. Chakravarty, H. Cohen, B. Blum, Y. Olswang, P. Hakimi, C. Xu, D. Massillon, R. W. Hanson, et al. 2005. Glucocorticoids regulate transcription of the gene for phosphoenolpyruvate carboxykinase in the liver via an extended glucocorticoid regulatory unit. J. Biol. Chem. 280 33873–33884. [DOI] [PubMed] [Google Scholar]
- 62.Mitro N., P. A. Mak, L. Vargas, C. Godio, E. Hampton, V. Molteni, A. Kreusch, and E. Saez. 2007. The nuclear receptor LXR is a glucose sensor. Nature. 445 219–223. [DOI] [PubMed] [Google Scholar]
- 63.Burns K. A., and J. P. Vanden Heuvel. 2007. Modulation of PPAR activity via phosphorylation. Biochim. Biophys. Acta. 1771 952–960. [DOI] [PMC free article] [PubMed] [Google Scholar]
- 64.Taniguchi C. M., B. Emanuelli, and C. R. Kahn. 2006. Critical nodes in signalling pathways: insights into insulin action. Nat. Rev. Mol. Cell Biol. 7 85–96. [DOI] [PubMed] [Google Scholar]
- 65.Hashimoto K., A. C. Yoshizawa, S. Okuda, K. Kuma, S. Goto, and M. Kanehisa. 2008. The repertoire of desaturases and elongases reveals fatty acid variations in 56 eukaryotic genomes. J. Lipid Res. 49 183–191. [DOI] [PubMed] [Google Scholar]
- 66.Westerberg R., P. Tvrdik, A-B. Unden, J-E. Mansson, L. Norlen, A. Jakobsson, W. H. Holleran, P. M. Elias, A. Asadi, P. Flodby, et al. 2004. Role for ELOVL3 and fatty acid chain length in development of hair and skin function. J. Biol. Chem. 279 5621–5629. [DOI] [PubMed] [Google Scholar]
- 67.Kersten S., J. Seydoux, J. M. Peters, F. J. Gonzalez, B. Desvergne, and W. Wahli. 1999. Peroxisome proliferator-activated receptor alpha mediates the adaptive response to fasting. J. Clin. Invest. 103 1489–1498. [DOI] [PMC free article] [PubMed] [Google Scholar]
- 68.Xu H. E., M. H. Lambert, V. G. Montana, D. J. Parks, S. G. Blanchard, P. J. Brown, D. D. Sternbach, J. M. Lehmann, G. B. Wisely, T. M. Willson, et al. 1999. Molecular recognition of fatty acids by peroxisome proliferator-activated receptors. Mol. Cell. 3 397–403. [DOI] [PubMed] [Google Scholar]
- 69.Ntambi J. M., M. Miyazaki, J. P. Stoehr, H. Lan, C. M. Kendziorski, B. S. Yandell, Y. Song, P. Cohen, J. M. Friedman, and A. D. Attie. 2002. Loss of stearoyl-CoA desaturase-1 function protects mice against adiposity. Proc. Natl. Acad. Sci. USA. 99 11482–11486. [DOI] [PMC free article] [PubMed] [Google Scholar]
- 70.Attie A. D., R. M. Krauss, M. P. Gray-Keller, A. Brownlie, M. Miyazaki, J. J. Kastelein, A. J. Lusis, A. F. Stalenhoef, J. P. Stoehr, M. R. Hayden, et al. 2002. Relationship between stearoyl-CoA desaturase activity and plasma triglycerides in human and mouse hypertriglyceridemia. J. Lipid Res. 43 1899–1907. [DOI] [PubMed] [Google Scholar]
- 71.Gutierrez-Juarez R., A. Pocai, C. Mulas, H. Ono, S. Bhanot, B. P. Monia, and L. Rossetti. 2006. Critical role of stearoyl-CoA desaturase-1 (SCD1) in the onset of diet-induced hepatic insulin resistance. J. Clin. Invest. 116 1686–1695. [DOI] [PMC free article] [PubMed] [Google Scholar]
- 72.Jiang G., Z. Li, F. Liu, K. Ellsworth, Q. Dallas-Yang, M. Wu, J. Ronan, C. Esau, C. Murphy, D. Szalkowski, et al. 2005. Prevention of obesity in mice by antisense oligonucleotide inhibitors of stearoyl-CoA desaturase-1. J. Clin. Invest. 115 1030–1038. [DOI] [PMC free article] [PubMed] [Google Scholar]
- 73.Macaulay K., B. W. Doble, S. Patel, T. Hansotia, E. M. Sinclair, D. J. Drucker, A. Nagy, and J. R. Woodgett. 2007. Glycogen synthase kinase 3alpha-specific regulation of murine hepatic glycogen metabolism. Cell Metab. 6 329–337. [DOI] [PubMed] [Google Scholar]
- 74.Lavoie L., C. J. Band, M. Kong, J. J. Bergeron, and B. I. Posner. 1999. Regulation of glycogen synthase in rat hepatocytes. Evidence for multiple signaling pathways. J. Biol. Chem. 274 28279–28285. [DOI] [PubMed] [Google Scholar]
- 75.Desvergne B., L. Michalik, and W. Wahli. 2006. Transcriptional regulation of metabolism. Physiol. Rev. 86 465–514. [DOI] [PubMed] [Google Scholar]
- 76.Pawar A., J. Xu, E. Jerks, D. J. Mangelsdorf, and D. B. Jump. 2002. Fatty acid regulation of liver X receptors (LXR) and peroxisome proliferator-activated receptor alpha (PPARalpha) in HEK293 cells. J. Biol. Chem. 277 39243–39250. [DOI] [PubMed] [Google Scholar]


