

1. Introduction
Hot-melt extruded (HME) formulations are becoming increasingly important as drug delivery systems (Repka et al., 2002) and the technology is currently being explored in the pharmaceutical industry due to several advantages over traditional processing methods (Repka et al., 2005). Several authors have successfully used HME technology to prepare various dosage forms including tablets, pellets, granules, and films (Zhang et al., 1992; Follonier et al., 1995; Aitken-Nichol et al., 1996; Repka et al., 1999; Young et al., 2002). HME may be used to disperse drugs in a given matrix at the molecular level, thus forming solid solutions. These formulations efficiently deliver therapeutic compounds when used topically or systemically.
Extruded formulations (e.g., films) typically contain plasticizers and excipients and the presence of such compounds causes difficulty in routine quality assurance and process analyses. Tedious extractions are often necessary in order to properly isolate the APIs and these procedures suffer the risk of incomplete extraction and are time-consuming. For these reasons, the development of an alternative method of analysis is desirable, especially one that will minimize preparative steps.
The need for alternative analytical methods extends to the realm of process analysis as well. There are several reasons for instituting real-time monitoring schemes for hot-melt extrusion processes. It is worthwhile to be able to gather in-process information concerning the API content of the film, the polymorphic constitution of that API and the uniformity of the API content within the film. All of these goals are compatible with the FDA Process Analytical Technology (PAT) initiative.
The FDA established the PAT initiative by instituting a framework for Innovative Pharmaceutical Manufacturing and Quality Assurance (FDA PAT initiative, 2004). PAT is a system for designing, analyzing, and controlling manufacturing processes through timely measurements (i.e., during processing) of critical quality and performance attributes of raw and in-process materials and processes. The ultimate goal is to ensure final product quality (www.fda.gov/cder/ops/pat.htm).
NIR and Raman spectroscopy are two tools well suited for PAT applications. Raman has not been historically applied in the pharmaceutical industry as often as NIR but is gaining popularity rapidly. These two spectroscopic techniques have been applied to monitor both primary operations for API synthesis (Wiss et al., 2003; Liotta et al., 2004; Florenzano et al., 2005; Palucki et al., 2005; Smet et al., 2005) as well as secondary pharmaceutical operations such as blending and granulations (Berntsson et al., 2002; Blanco et al., 2002). Regarding extrusions, NIR has been applied as a means to monitor the amount of drug content in hot-melt extruded films [Coates et al., 2003; Tumuluri et al., 2004; Barnes et al., 2005) and is a popular tool for on-line analyses. Raman has been used to monitor extruded materials on-line in the polymer industry (Barnes et al., 2003). Confocal Raman spectroscopy has been demonstrated to be quite useful in studying solid dispersions (Breitenbach et al., 1999). Because of its specificity, Raman can be used as a development tool to better understand processes, as well as to routinely monitor endpoints.
The present study explores the utility of Raman spectroscopy for the analysis of hot-melt extruded films containing APIs. Two model drugs, clotrimazole and ketoprofen were chosen as the active ingredients in each of the extruded film formulations. The objective of this study was to investigate the use of Raman spectroscopy, both off-line and on-line, for the quantitative and qualitative analyses of active ingredients in hot-melt extruded film formulations.
2. Materials and methods
Polyethylene oxide (M.W. 200,000) was purchased from Dow Chemical Company, Danbury, CT. Clotrimazole was obtained from Spectrum Chemical, Inc., Gardena, CA. Ketoprofen was obtained from Hawkins, Inc. (Minneapolis, MN). Other reagents (HPLC grade) were purchased from Fisher Chemicals, Fair Lawn, NJ.
2.2. Extrusion Procedure
Two compounds, clotrimazole and ketoprofen, were used as model APIs in the subject formulations. Different film formulations were extruded using varying loadings of clotrimazole (0, 1, 2, 4, 5, 7.5, 10, 12.5, 15 and 20%) or ketoprofen (0, 1, 2, 4, 5, 7.5, 10, 15 and 20%) as provided in Table 1. The ingredients in each of the formulations were subjected to particle size reduction before extrusion using a mortar and pestle and blended for 20 minutes using a V-blender. The blended powders were then dried in an oven at 40°C for 24 hours to minimize moisture content. Films were extruded using a single-screw extruder (Killion Model KLB100). The extrusion temperatures ranged from 80–110°C with a screw speed of 50 rpm. The films were collected, labeled and sealed in 5 mil foil-lined polyethylene bags for analysis.
Table 1.
The ingredients and the concentration of the ingredients used in the hot melt extruded films
| Clotrimazole (%) | PEO (%) | |
|---|---|---|
| Film-1 | 0 | 100 |
| Film-2 | 1 | 99 |
| Film-3 | 2 | 98 |
| Film-4 | 4 | 96 |
| Film-5 | 5 | 95 |
| Film-6 | 7.5 | 92.5 |
| Film-7 | 10 | 90 |
| Film-8 | 12.5 | 87.5 |
| Film-9 | 15 | 85 |
| Film-10 | 20 | 80 |
| Ketoprofen (%) | PEO (%) | |
|---|---|---|
| Film-1 | 0 | 100 |
| Film-2 | 1 | 99 |
| Film-3 | 2 | 98 |
| Film-4 | 4 | 96 |
| Film-5 | 5 | 95 |
| Film-6 | 7.5 | 92.5 |
| Film-7 | 10 | 90 |
| Film-8 | 15 | 85 |
| Film-9 | 20 | 80 |
A second set of formulations was extruded using a lab scale extruder (Randcastle, RCP-250). This process was performed to evaluate the performance of the method for the prediction of film contents on-line with different equipment. Approximately six spectra were taken per formulation extruded in the lab scale extruder.
2.3. Raman Instrumentation
For both off-line and on-line analyses, Raman measurements were accomplished using a Kaiser Optical Systems RamanRxn1™ spectrometer equipped with a MKII™ fiber optic probe with a 2.5-inch non-contact optic (NCO) for sampling. The use of an NCO allowed sampling without direct contact of the probe with the sample. The instrument was equipped with a 785-nm laser (400 mW). 30-second exposures of the film formulations were used for lab measurements. 40-second (lab extruder) or 60-second (pilot extruder) exposures were used for on-line measurements. The manufacturer’s software (Holograms version 4.0) was used for data acquisition.
For off-line lab analysis, extruded film samples were cut into small rectangles and placed on a lab jack which was used to properly focus the sample prior to each measurement. For on-line analysis, in the case of both extruders, various positions for the probe were tested before ultimately deciding upon the positioning shown in Figure 1. The probe positions investigated included placement under the extruded film instead of the top as shown in the figure, such that measurements were taken from the bottom. However, such positioning would be a safety concern. The probe was also placed at the point at which the extruded films emerged from the die. Finally, the arrangement shown in Figure 1 was selected as it was observed that the spectrum was consistent in this case and it was also safe for the operator. In this case, the probe was clamped above the film. At this position, the film was 90 degrees to the incident beam making it convenient to obtain the spectrum but at the same time not pose any risk to the operator from the laser. Spectra were taken continuously for the on-line measurements. The off-line and on-line data were modeled separately and compared.
Figure 1.

Non contact optic with the fiber optic probe clamped over the extruded film formulation
2.4. Data Analysis
Data were analyzed using Grams™ software (Thermo Corp., Salem, NH, USA). Partial Least Squares (PLS) and Multiple Linear Regression (MLR) models were used for quantification of the drug content in these extruded film matrices.
3. Results
Separate calibration models were developed for data obtained from clotrimazole and ketoprofen films both off-line and on-line. For the models from the off-line data, the performance of each calibration was evaluated based on the error value of each obtained from cross-validation. For the on-line data, the veracity of each model was decided based on the prediction values from test sets. Each test set consisted of samples representing the entire range of concentrations used in the calibration set.
Figure 2 shows the spectra for the off-line measurements of the clotrimazole films. The spectra exhibited some slight baseline irregularities. This was effectively treated by performing a second derivative conversion of the spectra. Figure 3 illustrates the fact that there was good correlation between the theoretical drug levels and the drug levels predicted from the Raman data. Theoretical drug levels were determined based on the percentage of drug added to the matrix in the extrusion process. No additional testing was performed to verify the absolute drug levels other than the Raman measurements. The calibration performance was assessed by the Root Mean Squared Error of Calibration (RMSEC), r2 (correlation coefficient), and Root Mean Squared Error of Cross-Validation (RMSECV) (Martens and Naes, 1989). The RMSEC is the standard error obtained from the calibration data, whereas, the RMSECV is the standard error from a leave-one-out cross-validation procedure (Martens et al., 2001). An MLR model was employed using the band intensity at 1585 cm−1. A correlation coefficient of 0.9969 was obtained with an RMSEC of 0.49%. The RMSECV was 0.72%.
Figure 2.

Raman spectra for the off-line measurement of Clotrimazole films
Figure 3.

Calibration data for HME films containing clotrimazole in off-line measurements
Consistent acceptable results were also obtained for the ketoprofen films. Figure 4 shows the spectra collected for these films. A second derivative pretreatment was performed prior to modeling. Figure 5 shows second derivative plots of the spectra of different levels of ketoprofen and that of pure ketoprofen. The Raman data in this plot indicate that the ketoprofen in the formulations was different in nature from the ketoprofen raw material. It is not completely clear why this occurred. The most likely explanation is that the ketoprofen, after being melted in the extruder, cooled to a different crystalline state or to an amorphous state, representing a transformation from the original crystalline form of the raw material. The spectral changes observed are consistent with such a transition. It is also possible that solid-state interactions of the drug with the polymer contributed to the observed changes as the extent of the band shifting appeared to be somewhat a function of the drug concentration (see Figure 5). However, such changes are generally not attributable to simple concentration changes. Detection of such a phenomenon suggests that the Raman technique can alert developers to qualitative changes in the nature of the drug material in the formulation.
Figure 4.

Raman spectra of ketoprofen-containing HME films taken off-line
Figure 5.

Raman spectra showing Crystallinity in the ketoprofen HME films
The issue regarding this qualitative change was fortuitously discovered during the course of this investigation and was outside the scope of our original research. Hence, this issue was not pursued with more vigor in order to elucidate the provenance of the band shifting. Any physical change could cause the spectral changes but crystalline transformations and drug-polymer interactions are the only two likely scenarios the authors can envision in this case. These discoveries are being pursued in future studies.
An excellent calibration model was obtained for the ketoprofen films (Figure 6). A correlation coefficient of 0.9979 was obtained using an MLR calibration with a primary wavelength shift of 998 cm−1. A ratio band at 886 cm−1 was used in the calibration model. A ratio band is often used in Raman calibrations to account for data fluctuations unrelated to analyte concentrations. An RMSEC of 0.31% was obtained, while an RMSECV of 0.66% was calculated. The physical change of the active (crystalline to amorphous), in this case, may have made a slightly more complex calibration (i.e., the use of a ratio band) necessary.
Figure 6.

Calibration curve for ketoprofen HME films that were scanned off-line
The spectra for the on-line measurements of ketoprofen and clotrimazole formulations are shown in Figure 7 and Figure 8 respectively. Loading plots from the Principle Components Analysis (PCA) of each set of data suggest that there are significant differences between data collected on-line and off-line. For both sets of films, the first loading spectra for the on-line data exhibit baseline slopes and a much greater amount of noise compared to the first loading for the off-line data. This is not surprising, as the measurement process for on-line data collection would be expected to be significantly noisier due to the dynamic nature of the sampling. In spite of the additional noise from the measurement dynamics, the data suggest that quantitative analysis for on-line extruded film formulations is feasible.
Figure 7.

Raman spectra of ketoprofen HME films taken on-line
Figure 8.
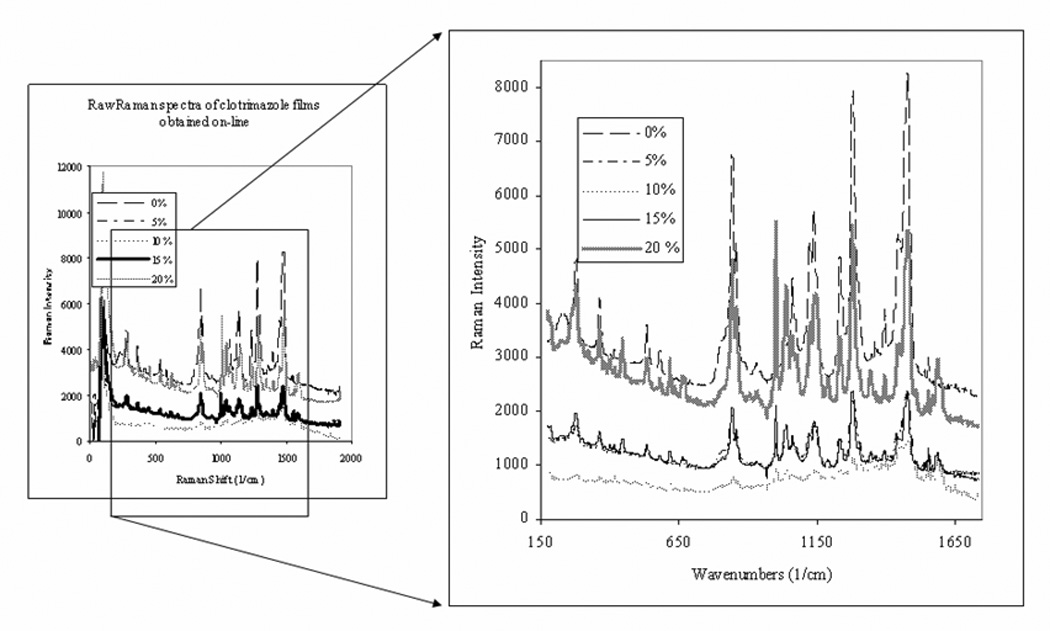
Raman spectra of clotrimazole HME films taken on-line
For on-line measurements of the ketoprofen films, a correlation coefficient of 0.9966 was obtained, while an RMSEC of 0.51% was calculated (Figure 9). All calibrations from on-line data were assessed with prediction samples. In each case, a Root Mean Squared Error of Prediction (RMSEP) was calculated. The RMSEP in the case of ketoprofen data was 0.94%. A PLS equation, using 3 factors, was found to be optimal. The wavelength shift range employed for modeling was 506 – 1616 cm−1, and a band resulting from a C-H bending vibration for PEO at 1480 cm−1 was used for normalization. Normalization is carried out routinely on quantitative Raman measurements. It is done simply with a band area ratio. The effect that normalization has on the results is to make them much more reproducible by removing irrelevant data variation caused by phenomena such as laser fluctuations. It is a well-accepted and common technique applied to Raman measurements to improve quantitative measurements. Further, in this case the normalization was done to compensate for the issues related to laser focus that occur due to the undulation of the moving film.
Figure 9.

Calibration data for the on-line measurements of HME ketoprofen films
Figure 10 shows the correlation plot for the on-line measurements of clotrimazole. A correlation coefficient of 0.9948 was obtained using a three-factor PLS equation (176 – 1735 cm−1). An RMSEC of 0.53% and an RMSEP of 0.97% were obtained. The data were normalized to the PEO peak area from 1215 to 1248 cm−1 to enhance the calibration model.
Figure 10.
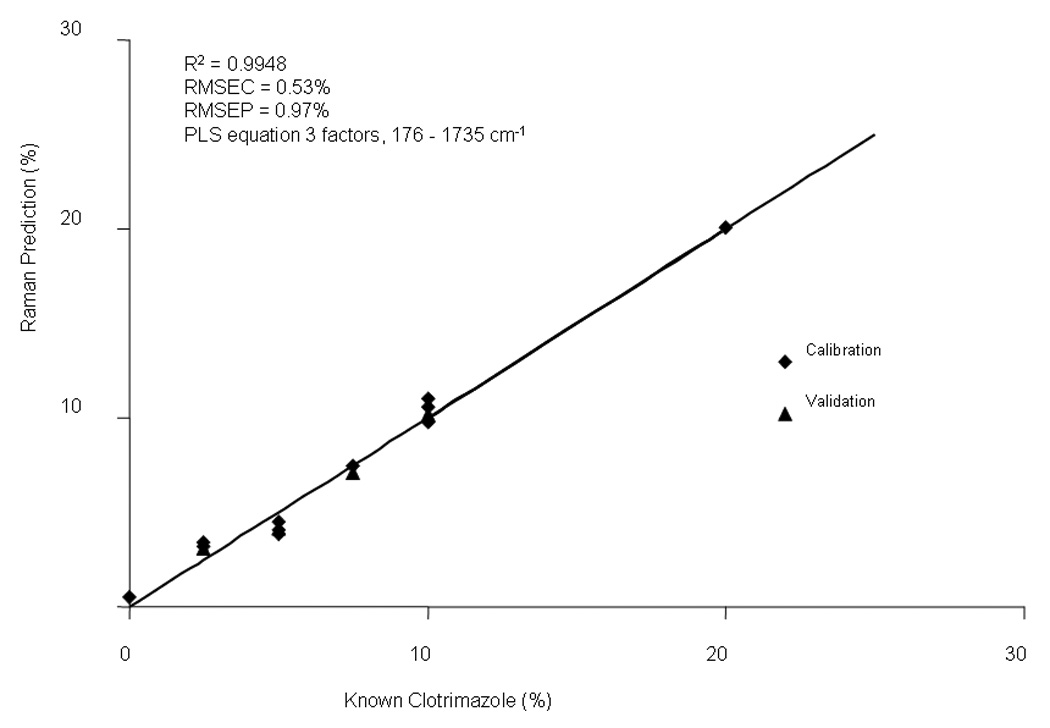
Calibration data for the on-line measurements of HME clotrimazole films
4. Discussion
Table 2 summarizes the correlation coefficients and the associated errors in cross-validation or prediction samples in the off-line and on-line models. Model transferability was also investigated in the current study. Efficient methods have become available to transfer multivariate calibration models from one instrument to another. Considerable effort is put into the construction of robust models since they are meant to be used for extended periods of time. Problems can arise, however, when the samples to be predicted are measured on a different instrument or under significantly different environmental conditions from those used to collect the data from which the model was constructed (Feudale et al., 2002). Ideally, models should be able to be applied without adjustment for a given product on every instrument. Model transferability has been addressed by Swierenga et. al. in a study for the determination of the component concentrations in a ternary mixture of methanol, ethanol, and 1-propanol using NIR spectroscopy (Swierenga et al., 1998). They investigated the use of calibration models obtained on one instrument when transferred to other NIR instruments.
Table 2.
The results obtained from off-line and on-line calibration models of Clotrimazole and Ketoprofen films
| Measurement | CT Off-Line | CT On-Line | KTP Off-Line | KTP On-Line |
|---|---|---|---|---|
| Correlation Coefficient | 0.9969 | 0.9948 | 0.9979 | 0.9966 |
| RMSEC (%) | 0.49 | 0.53 | 0.31 | 0.51 |
| RMSECV or RMSEP (%) | 0.72 | 0.97 | 0.66 | 0.94 |
| PLS Factors Used | 4 | 3 | 2 | 3 |
The thicknesses of the films from the lab scale extruder were measured and found to be similar to those obtained from the pilot extruder. However, this is only a superficial measure of equivalence. There are various parameters that differ when extrusions are done on a lab scale extruder versus a pilot extruder. Some of the parameters that can manifest differences between lab and pilot extruders are the length of the screw, the feeding rate of the powder and the dimensions of the die. Hence, challenges to model transferability might be expected when comparing measurements of films produced on the two extruder types. Also, concerning the difference in the online and offline monitoring, the benefit of on-line measurements during production is self-evident but the challenge in this case was sampling. The undulation of the films was the major challenge and correcting for it was problematic. The sheet could be flattened at some point to make for a more consistent measurement. However, the simplest correction was applied (ratio the active band to the polymer band) as that accounts for differences in path length caused by the undulation. A salient point here, however, is that, fortunately, the tolerance for error in an on-line measurement is much greater because final product testing will always provide the final decision. On-line testing is performed to make sure the process appears to be on track to a successful product.
The calibration models obtained using the on-line measurements of the films produced with the pilot scale extruder were employed to predict the content of the films obtained from the lab scale extruder. Formulations for both active ingredients were predicted using the respective models. Clotrimazole films with concentrations of 5, 10 and 15 % were used for on-line predictions whereas concentrations of 7.5, 10 and 20 % were used for on-line predictions of the ketoprofen films. Evidence of the robustness of the models for prediction of the content of the films produced from the lab scale extruder is shown in Table 3. These data suggest that the same model can be used to predict API concentration in films produced from different extruders under different extrusion conditions.
Table 3.
Predicted concentration values for (a) Clotrimazole and (b) Ketoprofen in the films extruded from the lab scale extruder Randcastle RCP-250
| SAMPLE | PREDICTED | THEORETICAL | % ERROR |
|---|---|---|---|
| CLOT 0003 | 4.7 | 5 | −6.00 |
| CLOT 0006 | 9.8 | 10 | −2.00 |
| CLOT 0008 | 15.4 | 15 | 2.67 |
| (a) | |||
| SAMPLE | PREDICTED | THEORETICAL | % ERROR |
| KTP 000005 | 7.6 | 7.5 | 1.33 |
| KTP 000001 | 10.4 | 10 | 4.00 |
| KTP 0000014 | 20.4 | 20 | 2.00 |
| KTP 0000016 | 19.8 | 20 | −1.00 |
| (b) |
“Theoretical” column represents the theoretical concentration incorporated into the extruded film
“Predicted” column represents the predicted concentration value from the developed model
Conclusions
The data from this study suggest that Raman spectroscopy is a convenient means for analyzing HME film formulations both on-line and off-line. The API contents of the films were accurately quantified in each case using the theoretical drug content as a basis for quantification.
Off-line Raman measurements are desirable because they allow the user to avoid the tedious extractions often employed in typical QC measurements. This approach also allows improvements in analysis efficiency as measurements can be made much faster compared to techniques requiring sample preparation. Changes in the physical state of the ketoprofen in the films resulting from the HME processing were also elucidated, making the information content more valuable.
Raman spectroscopy was also successfully applied for on-line measurements in this study as API levels were accurately quantified in real time measurements. This suggests that Raman could be used as a tool to satisfy needs for PAT. Since Raman offers the user the advantage of fiber optic sampling, the placement of the spectrometer outside of the actual processing area is possible.
This work also demonstrated that there is potential for model transfer using Raman spectroscopic techniques. This is critical in order to allow method development to be employed in multiple locations as necessary. Eventual model transfer would require the use of a secondary method to confirm the validity of the quantitative results.
Acknowledgements
This project was supported by Grant Number P20RR021929 from the National Center For Research Resources (NIH/NCRR). The authors would also like to thank Sridhar Thumma, Department of Pharmaceutics, The University of Mississippi, for his help during the extrusion process.
Footnotes
Publisher's Disclaimer: This is a PDF file of an unedited manuscript that has been accepted for publication. As a service to our customers we are providing this early version of the manuscript. The manuscript will undergo copyediting, typesetting, and review of the resulting proof before it is published in its final citable form. Please note that during the production process errors may be discovered which could affect the content, and all legal disclaimers that apply to the journal pertain.
References
- Aitken-Nichol C, Zhang F, McGinity JW. Hot-melt extrusion of acrylic films. Pharm. Res. 1996;13(5):804–808. doi: 10.1023/a:1016076306279. [DOI] [PubMed] [Google Scholar]
- Barnes SE, Sibley MG, Edwards HGM, Coates PD. Applications of process spectroscopy to polymer melt processing. Spectroscopy Europe. 2003:22–24. [Google Scholar]
- Barnes SE, Brown EC, Sibley MG, Edwards HGM, Coates PD. Vibrational spectroscopic and ultrasound analysis for the in-process monitoring of poly(ethylene vinyl acetate) copolymer composition during melt extrusion. Analyst. 2005;130(3):286–292. [Google Scholar]
- Berntsson O, Danielsson LG, Lagerholm B, Folestad S. Quantitative in-line monitoring of powder blending by near infrared reflection spectroscopy. Powder Technology. 2002;123(2–3):185–193. [Google Scholar]
- Blanco M, Gozález Bañó R, Bertran E. Monitoring powder blending in pharmaceutical processes by use of near infrared spectroscopy. Talanta. 2002;56(1):203–212. doi: 10.1016/s0039-9140(01)00559-8. [DOI] [PubMed] [Google Scholar]
- Breitenbach J, Schrof W, Neumann J. Confocal Raman-Spectroscopy: Analytical Approach to Solid Dispersions and Mapping of Drugs. Pharmaceutical Research. 1999;16(7):1109–1113. doi: 10.1023/a:1018956304595. [DOI] [PubMed] [Google Scholar]
- Coates PD, Barnes SE, Sibley MG, Brown EC, Edwards HGM, Scowen IJ. In-process vibrational spectroscopy and ultrasound measurements in polymer melt extrusion. Polymer. 2003;44:5937–5949. [Google Scholar]
- Feudale RN, Woody NA, Tan H, Myles AJ, Brown SD, Ferré J. Transfer of multivariate calibration models: a review. Chemometrics and Intelligent Laboratory Systems. 2002;64(2):181–192. [Google Scholar]
- Florenzano FH, Enohnyaket P, Fleming V, Reed WF. Coupling of near infrared spectroscopy to automatic continuous online monitoring of polymerization reactions. European Polymer Journal. 2005;41(3):535–545. [Google Scholar]
- Follonier N, Doelker E, Cole ET. Various Ways of Modulating the Release of Diltiazem Hydrochloride from Hot-Melt Extruded Sustained-Release Pellets Prepared Using Polymeric Materials. J. Control Release. 1995;36(3):243–250. [Google Scholar]
- FDA. Guidance for Industry: PAT - a framework for innovative pharmaceutical development, manufacturing, and quality assurance. 2004 September; http://www.fda.gov/cder/ops/pat.htm.
- Liotta V, Sabesan S. Monitoring and feedback control of supersaturation using ATR-FTIR to produce an active pharmaceutical ingredient of a desired crystal size. Org. Process Res. Dev. 2004;8(3):488–494. [Google Scholar]
- Martens & Naes: Multivariate Calibration. J. Wiley & Sons Ltd; 1989. p. 253. [Google Scholar]
- Martens H, Martens M. Multivariate analysis of quality: an introduction. Chichester [England]; New York: Wiley; 2001. p. 191. [Google Scholar]
- Palucki M, Lin Z, Sun Y. Profiling the formation of 2-chloro-N, N-dimethylamino trimethinium chloride salt, a key intermediate in the manufacturing process of etoricoxib. Org. Process Res. Dev. 2005;9(2):141–148. [Google Scholar]
- Repka MA, Gerding TG, Repka SL, McGinity JW. Influence of Plasticizers and Drugs on the Physical-Mechanical Properties of Hydroxypropylcellulose Films Prepared by Hot-Melt Extrusion. Drug Dev. Ind. Pharm. 1999;25(5):627–635. doi: 10.1081/ddc-100102218. [DOI] [PubMed] [Google Scholar]
- Repka MA, McGinity JW, Zhang F, Koleng JJ. Hot-Melt Extrusion Technology, Encyclopedia of Pharmaceutical Technology. 2nd Ed. New York: Marcel Dekker, Inc.; 2002. [Google Scholar]
- Repka MA, Gutta K, Prodduturi S, Munjal M, Stodghill SP. Characterization of cellulosic hot-melt extruded films containing lidocaine. Eur.J. Pharm. Biopharm. 2005;59(1):189–196. doi: 10.1016/j.ejpb.2004.06.008. [DOI] [PubMed] [Google Scholar]
- Smet KD, Daun JV, Stokbroekx B, Spittaels T, Schroyen C, Van Broeck P, Lambrechts J, Van Cleurenbergen D, Smout G, Dubois J, Horvath A, Verbraeken J, Cuypers J. Selectivity control by use of Near-IR for a hydrogenation process. Org. Process Res. Dev. 2005;9(3):344–347. [Google Scholar]
- Swierenga H, Haanstra WG, de Weijer AP, Buydens LMC. Comparison of Two Different Approaches Toward Model Transferability in NIR Spectroscopy. Appl. Spectrosc. 1998;52(1):7–16. [Google Scholar]
- Tumuluri SS, Prodduturi S, Crowley MM, Stodghill SP, McGinity JW, Avery BA, Repka MA. The use of Near-Infrared Spectroscopy for the Quantitation of a Drug in Hot-Melt Extruded Films. Drug Dev. Ind. Pharm. 2004;30(5):505–511. doi: 10.1081/ddc-120037481. [DOI] [PubMed] [Google Scholar]
- Wiss J, Zilian A. Online spectroscopic investigations (FTIR/Raman) of industrial reactions: Synthesis of Tributyltin azide and hydrogenation of chloronitrobenzene. Org. Process Res. Dev. 2003;7(6):1059–1066. [Google Scholar]
- Young CR, Koleng JJ, McGinity JW. Production of spherical pellets by a hot-melt extrusion and spheronization process. Int. J. Pharm. 2002;242(1–2):87–92. doi: 10.1016/s0378-5173(02)00152-7. [DOI] [PubMed] [Google Scholar]
- Zhang F, McGinity JW. Properties of sustained-release tablets prepared by hot-melt extrusion. Pharm. Dev. and Technol. 1992;4(2):241–250. doi: 10.1081/pdt-100101358. [DOI] [PubMed] [Google Scholar]