

Abstract
CD4+ CD25+ regulatory T cells have been shown to be a vital component of the mechanisms that prevent autoreactivity in mice and also in humans. Previous studies have examined CD4+ CD25hi regulatory T cell frequency and function in patients with systemic lupus erythematosus (SLE) with mixed results. We investigated frequency, phenotype and function in 21 patients with SLE and six with inactive disease. We found no reduction in frequency of the CD25hi subset, although active disease was associated with an increased proportion of CD4+ CD25+ T cells. When examining function, in the majority of individuals suppression was comparable with controls, although cells isolated from one patient with active disease failed to suppress proliferation. On testing the effect of CD25hi depletion on the responses of whole peripheral blood mononuclear cells to nucleosomes we found that, where a response was detectable from patients, depletion augmented interferon-γ secretion, demonstrating intact suppression of responses implicated in the pathogenesis of SLE. Our results did not confirm an association of failure in CD4+ CD25hi regulatory T cell function or a reduction in their frequency with active disease. Instead, perturbations in the CD4+ CD25hi regulatory T cell population may play a role in disease in only a minority of the patients afflicted by the diverse syndromes of SLE.
Keywords: CD4+ CD25+ regulatory T cell, nucleosomes, SLE
Introduction
Systemic lupus erythematosus (SLE) is a multi-system autoimmune disease with a range of clinical manifestations, from relatively mild rash or arthritis to severe organ-threatening inflammation, e.g. nephritis. Multiple genetic and environmental factors are associated with disease [1,2]. The immunological hallmark of SLE is the production of class-switched, somatically mutated antibodies targeting nuclear antigens, including double-stranded DNA (dsDNA) and histones [3,4]. In parallel with these serological markers, nuclear antigen-specific T cell clones have been isolated from lupus-prone mouse strains and patients with SLE that provide cognate help for autoantibody production [5]. Central tolerance to the nuclear antigens targeted in SLE is incomplete in normal individuals, with reactivity of peripheral lymphocytes identified in both B and T cell compartments [6,7], suggesting that a further failure in peripheral tolerance is required to initiate the processes that result in disease in patients with lupus.
Regulatory T cells are an important component of mechanisms maintaining peripheral tolerance and preventing autoimmune disease, particularly CD4+ CD25+ T cells (CD4+ CD25+ Treg), first identified as ‘natural’ regulators of organ-specific autoimmunity by Sakaguchi et al. [8]. CD4+ CD25+ Treg develop in the thymus and potentially the periphery, and express forkhead box P3 (FoxP3) [9–11]. They suppress a range of immune effectors, including both CD4+ T cells and B cells [12–16]. How inhibition of effector cells is achieved is unclear [17].
Whether these cells limit responses to antigens targeted in SLE or whether a deficit in this population contributes to the development of disease is unclear. Lupus susceptibility genetic loci have been associated with and several lupus-prone mouse strains have reduced numbers of CD4+ CD25+ Treg[18–20], and in the first description of the effects of depletion of these cells from the T cell repertoire, anti-DNA antibodies were produced with associated proteinuria and glomerulonephritis. Adult lupus-prone NZM2328 mice may have an impairment in CD4+ CD25+ Treg specific for renal disease [21]. In lupus-prone MRL/Mp mice, MRL/Mp effector cells are partially resistant to suppression by CD4+ CD25+ Treg, which may contribute to disease in this strain [22].
Several groups have examined CD4+ CD25+ Tregs in patients with SLE. Humans differ from mice in that the CD4+ CD25+ cells that are suppressive are only those with the highest CD25 expression levels (CD25hi), with the majority of CD4+ CD25+ T cells non-suppressive [23]. Expression of high levels of CD25 correlates with FoxP3 expression and suppressive function and has therefore been used to quantify the frequency of regulatory T cells in human peripheral blood [24,25]. The results have been mixed in SLE, with different studies finding a reduced proportion [26,27], a normal proportion [28,29] or an increased frequency [30] (in patients treated with corticosteroids), and functional studies showing no impairment [27], impairment in a proportion of patients [28] or marked impairment in all patients tested [31].
We investigated the percentage and function of CD4+ CD25hi Treg and also the susceptibility to suppression of CD4+CD25- T cells in patients with lupus nephritis. As previous investigations had only examined CD4+ CD25+ Treg function on polyclonal stimulation, which is unlikely to truly represent function in vivo, we also examined the ability of CD4+ CD25+ Treg to suppress responses against nucleosomes, a frequent target of pathogenic immune responses in SLE.
Materials and methods
Patients
Patients were recruited from the lupus nephritis clinic at Hammersmith Hospital and healthy controls from the Immunology Department. The Hammersmith and Queen Charlotte Hospitals Research Ethics Committee approved the project. Patients were allocated to the inactive or active disease categories by the supervising consultant (L. L.) according to standard American College of Rheumatology criteria [32]. Informed consent was obtained. Samples were taken from 21 individuals with lupus, 15 with active [10 females and five males, median age 31 years (7–63 years)] and six with inactive disease [all female, median age 52 years (4–57 years)]. The patients with active disease were all receiving corticosteroids and a proportion were receiving other immunosuppressants, including pulsed cyclophosphamide, mycophenolate motefil and azathioprine. Individuals with inactive disease were not receiving any immunosuppressants. The healthy controls comprised 23 individuals, median age 33 years (2–49 years), of whom 12 were female and 11 male.
Cell culture
Proliferation assays were carried out in RPMI-1640 supplemented with 50 U/ml penicillin, 50 μg/ml streptomycin, 2 mM l-glutamine (Invitrogen, Paisley, UK) and 10% v/v human serum (HS) (Biowest, Nuaillé, France).
Cell separation
Peripheral blood mononuclear cells (PBMC) and CD4+ T cells were isolated by density gradient centrifugation on Lymphoprep (Nycomed, Marlow, UK). Isolated cells were stained with anti-CD4-fluorescein isothiocyanate (FITC) (clone Q1420, Sigma, Gillingham, UK) and anti-CD25-phycoerythrin (PE) (clone 2A3, BD PharmingenTM, Oxford, UK) in phosphate-buffered saline (PBS)/2% HS. CD4+ T cells were sorted according to CD25 expression level using a fluorescence activated cell sorter (FACSAriaTM) (BD Pharmingen), with CD25 positivity defined using the immunoglobulin G1 (IgG1)-PE isotype control (MOPC-21; Sigma). CD4+ T cell purity was > 99%, with purity of the CD25hi and CD25- populations 97–100%. The CD25int population was sorted with the lower level of PE fluorescence intensity at the upper limit of that of the isotype control, with the upper limit set arbitrarily below the lower limit of the gate used to sort the 2% expressing the highest levels of CD25.
CD25hi cells were depleted from whole PBMC by incubation of 1·5 × 107 PBMC with 50 μl of anti-CD25-coated magnetic beads (Dynal; Invitrogen, UK) at 4°C. Depletion of the CD4+ CD25hi subset was assessed by gating on the 2% of CD4+ T cells expressing the highest levels of CD25 in whole PBMC and assessing what percentage of CD4+ T cells of the CD25-depleted PBMC were in this gate. This technique effectively reduced the CD25hi population to < 0·07% of total CD4+ T cells.
Proliferation assays
Suppression assays were carried out by co-culturing 5 × 10³CD4+ CD25- T cells with CD25hi or CD25int CD4+ T cells in 96-well plates with 0·025 μl of beads coated with anti-CD3 and anti-CD28 antibodies (Dynabeads® CD3/CD28 T cell Expander, Dynal; Invitrogen). In these assays, CD25hi cells were co-cultured with CD25- cells at increasing ratios, from 1 : 1 to 1 : 4, while CD25int cells were co-cultured only at a 1 : 1 ratio. Supernatant was harvested at 48 h for measurement of interleukin (IL)-2 and at 96 h for other cytokines [interferon (IFN)-γ, IL-5 and IL-10]. Plates were pulsed with 1 μCi of [3H]-labelled thymidine/well (Amersham Pharmacia, Little Chalfont, UK) and plates harvested after 16 h on to filter mats (Wallac (Perkin Elmer), Beaconsfield, UK). Thymidine incorporation was assessed by a liquid scintillation counter (Wallac).
To assess the effect of CD25 depletion on responses to antigens, whole or CD25 depleted PBMC at 1·5 × 105 cells/well were incubated with nucleosomes (kind gift of Dr R. Edwards at Hammersmith Hospital, isolated as described [33]) at 12 μg/ml in 275 μl of medium in round-bottomed 96-well plates. Supernatants were harvested then plates pulsed with [3H]-labelled thymidine.
Measurement of cytokines
Interleukin-2 was measured by bioassay, using the proliferative response of mouse cytotoxic T-lymphoblastoid line-2 cells (ATCC-LGC, Teddington, UK), as described elsewhere [34]. Concentrations were calculated using the standard curve from IL-2 standards. IFN-γ, IL-5 and IL-10 concentrations were measured using a standard sandwich enzyme-linked immunosorbent assay (ELISA) protocol, with the antibody pairs 43–11 and biotinylated 45–15 (IFN-γ; Immunokontact, Abingdon, UK), JESI-39D10 and biotinylated JESI-5A10 (IL-5; Biosource, Frampton, UK) and 9D7 and biotinylated 12G8 (IL-10; BD Pharmingen), with recombinant cytokines for standards from Biosource. The optical density was read at 450 nm on an ELISA reader (Titertek Multiscan PLUS; Life Sciences International, Basingstoke, UK). Concentrations were calculated after curve-fitted analysis of the optical densities of standards at 450 nm.
Flow cytometry
Freshly isolated (3–5 × 10⁵) PBMC were washed and resuspended in 100 μl of ice-cold 2% HS/PBS. Cells were incubated with fluorochrome labelled monoclonal antibodies for 30 min on ice, washed, then fixed in CellFixTM (BD Pharmingen). Cells were acquired on a FACScalibur® (Becton Dickinson, Oxford, UK) and data analysed using FlowJo software (Treestar, San Carlos, CA, USA). Antibodies used were mouse IgG1-FITC (MOPC-21; Sigma), IgG2a-FITC (UPC-10; Sigma), IgG1-PE (MOPC-2; Sigma), IgG2a-PE (G155-178; BD Pharmingen), IgG2a-antigen-presenting cells (APC) (MG2a; Caltag (Invitrogen), Paisley, UK), anti-CD3-FITC (UCHT-1; Sigma), anti-CD4-FITC (Q1420; Sigma), anti-CD25-FITC (CD25–3G10; Caltag, Invitrogen), anti-CD40 ligand-FITC (TRAP-1; Cymbus Biotechnology, Southampton, UK), anti-CD45RO-FITC (UCHL-1; Caltag), anti-CD62L-FITC (SK11; BD Pharmingen), anti-CD69-FITC (CH/4; Caltag), anti-human leucocyte antigen D-related (HLA-DR)-FITC (L243; BD Pharmingen), anti-CD25-PE (clone 2A3; BD Parmingen), anti-glucocorticoid-induced tumour necrosis factor receptor family-related gene (GITR)-PE (10416; R&D Systems, Minneapolis, MN, USA), anti-CTLA-4-PE (BN123; BD Pharmingen), anti-CCR7-PE (R&D Systems) and anti-CD4-APC (S3·5; Caltag).
Statistical analysis
When comparing results from multiple conditions in a single assay, we used one-way analysis of variance with Bonferroni's post-test for multiple comparisons with calculate P-values. When comparing two conditions from one assay with cells from one individual, a two-tailed Student's t-test was used. To determine the significance of changes in proliferation or cytokine production after CD25 depletion within each study group, we used the Wilcoxon signed rank test. For comparisons between study groups, the Mann–Whitney U-test was used for two groups and the Kruskal–Wallis test with Dunn's multiple comparisons test for three groups. All analysis was carried out using GraphPad PrismTM version 4 (GraphPad Software, Inc., San Diego, CA, USA).
Results
Frequency and phenotype of CD4+ CD25hi T cells in controls and patients with SLE
Using FACS separation we, as have others (e.g. [23]), found that the CD4+ CD25hi T cell population (top 2%) from healthy controls are consistently highly suppressive and that CD25int cells are not (data not shown). We determined the relative frequency of these subsets in 17 healthy controls with 12 patients with active and six individuals with inactive lupus. We found that there was a significant increase in the percentage of CD4+ T cells expressing CD25 in patients with active disease (controls, median 35·75%, 25th percentile 22·80%, 75th percentile 43·80% active lupus 53·65%, 48·35–60·30% Fig. 1a–c). There was no significant difference when comparing controls and patients with inactive lupus (median inactive lupus 43·20%, 33·45–59·65). To determine whether the increase in CD4+ CD25+ T cells was associated with an increase in the percentage of cells with the highest expression of CD25, we used an internal control to establish a lower limit for the level of expression above which we would describe the cells arbitrarily as CD25hi, set at the upper expression level of CD25 in CD4- lymphocytes for each sample (Fig. 1d). From this, we gated the CD4+ T cells that expressed CD25 at higher levels. Using this definition, we found no difference in the percentage of CD4+ T cells that were CD25hi between controls and patients with active or inactive disease (Fig. 1d), although the relative lymphopenia of the lupus patients meant that the absolute number of CD4+ CD25hi Tregs was reduced. This indicates that the apparent increase in CD4+ CD25+ T cells in patients with active disease is accounted for solely by an increase in the proportion of CD25int cells, which may be due to an expansion of this subset or, alternatively, a relative decrease in the CD25- population.
Fig. 1.
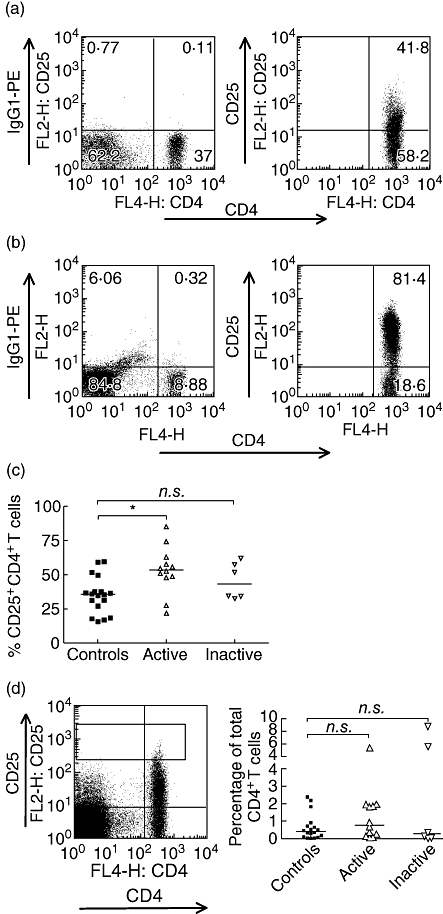
A higher proportion of CD4+ T cells express CD25 in patients with active systemic lupus erythematosus (SLE), although the proportion of CD25hi remains similar to controls. Peripheral blood mononuclear cells were stained with anti-CD4-APC and an IgG1-PE isotype control antibody to establish levels of background staining. Lymphocytes were gated using forward-scatter/side-scatter characteristics. (a) Representative example of a PE-labelled isotype control and anti-CD25 staining from a control individual. (b) Staining pattern of an individual with active SLE with a particularly marked increase in the proportion of CD4+ T cells expressing CD25 (1·4%). Note also the marked reduction in the proportion of lymphocytes that are CD4+ (8.88% versus 37% in a). (c) Comparing 18 controls, 12 patients with active SLE and six with inactive disease, there was a significant increase in the percentage of CD25+ in those with active disease. P < 0·05, controls versus active disease, Kruskal–Wallis with Dunns's multiple comparisons test. Bars at medians. (d) Proportion of CD4+ T cells in the CD4+ CD25hi gate − lower limit = the upper limit of CD25 expression of CD4– lymphocytes, as in the dot-plot. Bars at medians. Non-significant P-values using Kruskal–Wallis and Dunn's post test. n.s.: P-value > 0·05, *P-value < 0·05. APC, allophycocyanin; Ig, immunoglobulin; PE, phycoery-thrin.
Although there was no apparent increase in the proportion of CD4+ CD25hi T cells, despite an increase in total CD4+ CD25+ T cells in patients with active disease, it remained possible that in lupus patients, in vivo activation may have resulted in enhanced expression of CD25 in the CD25int cells. If this were the case, we would expect to see an increase in the proportion of CD25hi cells expressing other activation markers (such as CD69 and major histocompatibility complex class II). PBMC were incubated with a combination of antibodies, allowing us to gate on the CD4+ T cell subsets on the basis of the level of CD25 expression, and analyse the expression of cell surface markers in each population (Fig. 2). We used two definitions of CD25hi (CD4+ T cells expressing CD25 at higher levels than non-CD4+ lymphocytes and the 2% of CD4+ T cells expressing the highest levels of CD25) for the comparison of phenotypes between controls and patients with SLE. We found that there were no significant differences between patients with active lupus and healthy controls in the percentage of cells in the CD25hi subset expressing each marker, using either definition of CD25hi, suggesting that there was no replacement of regulatory cells with activated CD25int cells in patients with active lupus (Fig. 2a and b). In individuals with inactive lupus, a higher proportion of CD4+ CD25hi T cells expressed GITR when compared with controls. Interestingly, there were no significant differences in the expression of any of these markers in the CD25int subsets either, although there was a reduction in the percentage of cells expressing CD45RO in patients with active disease compared with healthy controls and patients with inactive disease (8·35% versus 85·1% and 87·1%, Fig. 2c). The major differences were seen in the CD25- subset, with a higher proportion of cells expressing CD45RO, HLA-DR and CTLA-4, and a lower percentage expressing CD62L, suggesting that the majority of recently activated cells are found in the CD25- population in patients with active lupus (Fig. 2d). The CD25int subset in healthy controls consists mainly of CD45RO+ memory cells, while the CD25- subset is predominantly naive (CD45RO- CD62 ligand+, CCR7+, Fig. 2c and d). Active lupus is associated with an increased proportion of CD4+ CD25- cells that have been activated previously (CD45RO+) and a reduction in the percentage that express CD62L and CCR7 (Fig. 2d).
Fig. 2.
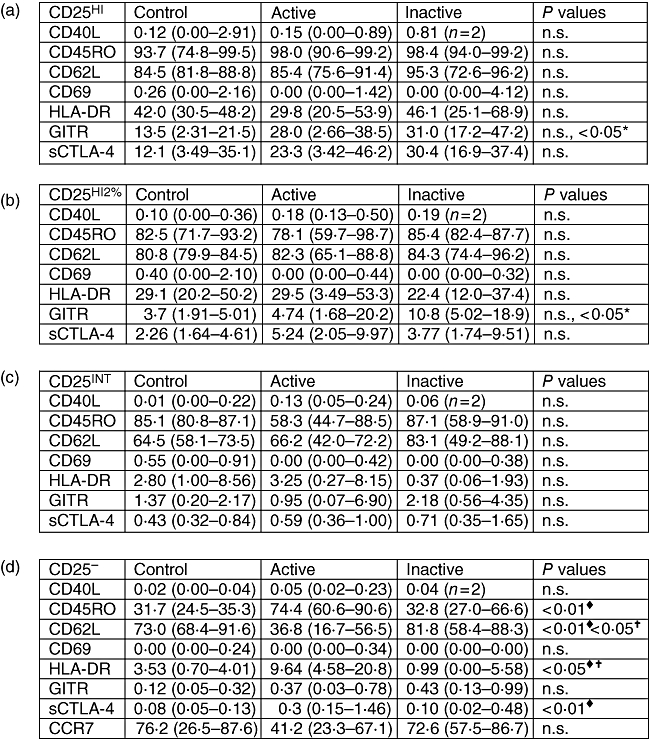
Phenotypic comparison of CD25 subsets. Active lupus is associated with phenotypic changes in the CD25– subset. Peripheral blood mononuclear cells were triple-stained for CD4, CD25 and expression of markers associated with CD4+ CD25hi Tregs or T cell activation. Subsets were gated using CD25 expression level and the proportion of each subset expressing the marker determined by comparison with staining with the isotype control antibody. Values shown are median percentage positive, with figures in brackets the 25th and 75th percentiles. Eleven controls, 11 with active systemic lupus erythematosus, five with inactive disease. (a) CD4+ T cells expressing CD25 at levels above the upper limit of CD25 expression by CD4– lymphocytes. (b) The 2% CD4+ T cells expressing the highest CD25 levels (definition of CD25hi used for FACS separation). (c) CD25int. (d) CD25–. CCR7 from 10 controls, nine patients with active and five with inactive disease. ×: P-value comparing controls and patients with inactive lupus; ♦, P-value comparing controls and patients with active lupus, †: P-value comparing patients with active and inactive lupus. Statistical comparison was made using the Kruskal–Wallis test with Dunn's post-test. FACS, fluorescence activated cell sorter; HLA-DR, human leucocyte antigen D-related.
CD4+ CD25hi T cells from the majority of patients with lupus suppress polyclonal T cell responses
We tested the ability of the CD25hi subset of CD4+ T cells from lupus patients to suppress CD4+ CD25- T cells. As a previous study in lupus-prone MRL/Mp mice had shown a reduced susceptibility to suppression of CD4+ CD25- T cells [22], in ‘cross-over’ assays we also tested the ability of CD4+ CD25hi T cells from healthy controls to suppress CD4+ CD25- T cells from lupus patients and vice versa. We separated CD25 subsets from freshly isolated CD4+ T cells by FACS (see Supplementary material, Fig. S1) and set up co-cultures at different ratios, using anti-CD3/CD28-coated beads as a stimulus. In three patients with inactive lupus, the CD4+ CD25hi T cells suppressed both autologous CD4+ CD25- T cells (Fig. 3a) and allogeneic responder cells (Fig. 3b) isolated from healthy controls to the same degree as CD4+ CD25hi T cells from controls. Also, CD4+ CD25- T cells from patients were equally as suppressible as those isolated from healthy controls (Fig. 3aversusFig. 3b). We then tested four patients with active lupus (three with nephritis, one cutaneous disease, lymphopenia and arthritis). In three of four patients treated with pulsed methylprednisolone, or oral prednisolone and azathioprine, we obtained similar results to those obtained from patients with inactive lupus (Fig. 3c and d). In one patient with marked lymphopenia, we obtained only 2 × 10⁴ CD25hi, so for this individual we carried out the suppression assay at a 2 : 1 ratio of responders to CD4+ CD25hi T cells only. IL-2 and IFN-γ production were also suppressed to a degree comparable with paired controls (data not shown).
Fig. 3.
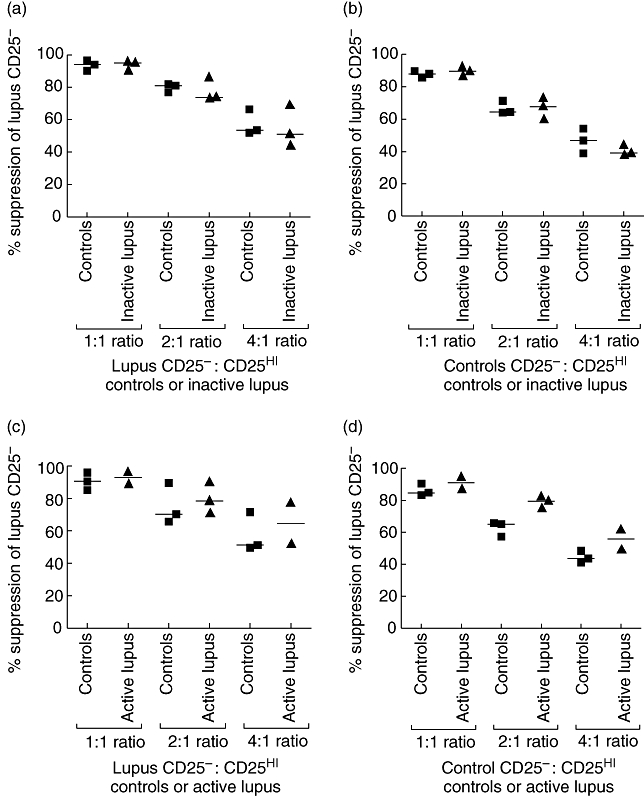
Suppression of CD4+ CD25– T cells by flow cytometrically sorted CD4+ CD25hi regulatory T cells from individuals with systemic lupus erythematosus (SLE). Fluorescence activated cell sorter-separated CD25– T cells were incubated at increasing ratios, from 1 : 1 to 4 : 1, with the 2% of CD4+ T cells expressing the highest level of CD25, and stimulated with anti-CD3/anti-CD28-coated beads. The x-axis shows the CD25hi population co-cultured with the indicated CD25– cells at ratios from 1 : 1 to 4 : 1. Percentage suppression was calculated using the equation 100-[(counts per minute CD25–/CD25hi co-culture)/counts per minute CD25– alone] × (100). Bars at medians. There was no statistically significant difference between suppression at any ratios between individuals with SLE and controls: Kruskal–Wallis test with Dunn's multiple post-test comparison. (a) Suppression of CD25– cells from individuals with inactive lupus by autologous CD4+ CD25hi T cells and CD4+ CD25hi T cells from controls. (b) Suppression of CD25– cells from controls by autologous CD4+ CD25hi T cells and CD4+ CD25hi T cells from individuals with inactive lupus. (c) Suppression of CD25– cells from individuals with active lupus by autologous CD4+ CD25hi T cells and CD4+ CD25hi T cells from controls. (d) Suppression of CD25– cells from controls by autologous CD4+ CD25hi T cells and CD4+ CD25hi T cells from individuals with active lupus.
In one of the four patients with active disease tested, receiving oral prednisolone and treated in the previous 6 months with Rituximab, we found that the CD4+ CD25hi T cells were unable to suppress proliferation of autologous or allogeneic CD25- T cells, despite almost complete suppression of the responder cells from the patient by control CD4+ CD25hi T cells (Fig. 4a and b). Similar results were seen when assessing the inhibition of IL-2 production in the culture supernatants (data not shown). Unlike control CD4+ CD25hi T cells, CD4+ CD25hi T cells from the patient produced significant quantities of IL-2 (data not shown). IFN-γ production by CD4+ CD25- T cells from the patient with lupus was suppressed to a similar degree by autologous and control CD4+ CD25hi T cells (Fig. 4c), although there was a significant impairment in suppression of IFN-γ production by CD4+ CD25- T cells from the control when co-cultured with CD4+ CD25hi T cells from the patient in comparison with co-cultures containing control CD4+ CD25hi T cells (9% versus 83%, Fig. 4d). Unlike the CD25int subset, the CD4+ CD25hi T cells from the patient produced no IFN-γ (Fig. 4c). The suppression of CD4+ CD25- T cell IFN-γ production by CD4+ CD25hi T cells from the patient may have occurred via IL-5, which was produced at markedly high levels by the CD4+ CD25hi when stimulated alone (3435 pg/ml, Fig. 4e) or when in co-culture with autologous (Fig. 4e) or control CD25- cells (Fig. 4f). The CD25int subset from the patient with lupus produced similar levels of IL-5 to that produced by the CD25int subset from the control (Fig. 4eversusFig. 4f).
Fig. 4.
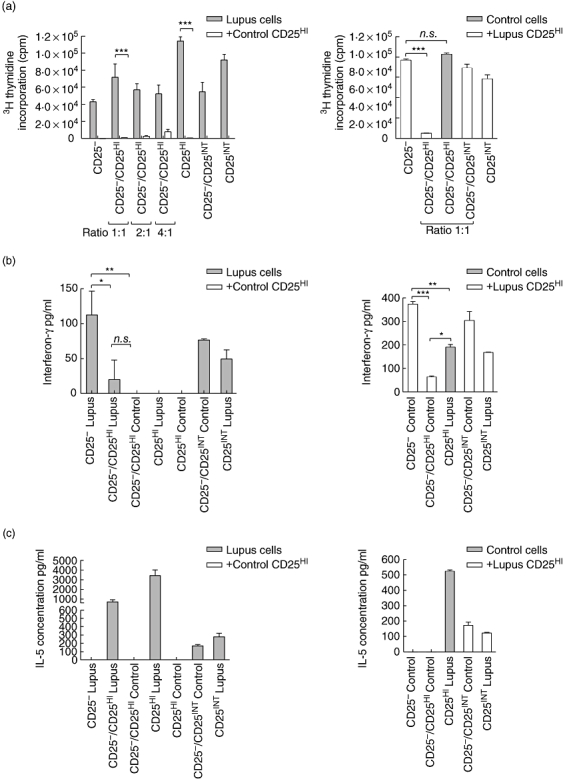
CD4+ CD25hi T cells from one individual with active lupus did not suppress. (a) Proliferation assay of CD25– T cells isolated from a patient with active lupus, co-cultured with autologous CD4+ CD25hi and CD25int T cells and CD4+ CD25hi T cells from a healthy control. Grey bars: cells isolated from the patient with lupus, white bars: patient CD25– T cells cultured with control CD4+ CD25hi T cells. (b) Proliferation assay of CD25– T cells isolated from a healthy control, co-cultured with autologous CD4+ CD25hi and CD25int T cells and CD4+ CD25+T cells from the patient with active disease. White bars: control CD25– with control CD25hi or int. Grey bars: control CD25– + lupus CD25hi. (c) Interferon (IFN)-γ concentration from the proliferation assay in (a). (d) IFN-γ concentration from the proliferation assay in (b). (e) Interleukin (IL)-5 concentration in supernatants from the proliferation assay in (a). (f) IL-5 concentration in supernatants from the proliferation assay in (b). All bars represent means with error barrs at the standard deviation. Statistical comparison made using one-way analysis of variance with Bonferroni's multiple comparisons test used to calculate P-values; n.s.: P-value > 0·05; *P-value < 0·05; **P-value < 0·01; ***P-value < 0·001.
Assessment of antigen-specific suppression
The hypothesis that there may be a deficit in suppression to antigens targeted by the autoimmune response in SLE was tested by looking at the effect of CD4+ CD25hi T cell depletion on the responses to nucleosomes [6,35–37]. Epitopes have been identified in H2A and H4 that show promiscuous binding to multiple HLA-DR alleles, so would be presented by most individuals [36]. We found that nucleosomes were able to induce significant proliferation in whole PBMC from four of five controls. In each of these, CD4+ CD25hi T cell depletion augmented proliferation, significantly in three of four patients (Fig. 5a). In all four individuals where cytokines were measured, there was enhancement of IFN-γ production, significantly in three of four (Fig. 5a). In two individuals CD4+ CD25hi T cell depletion also resulted in a marked reduction in IL-10 production (Fig. 5a). No patients with active lupus showed clear proliferative responses from whole or CD4+ CD25hi T cell-depleted PBMC (Fig. 5b), confirming published data [37]. Of these four patients, two produced IFN-γ, with significant levels detected only from CD4+ CD25hi T cell-depleted PBMC. All patients with active lupus produced IL-10, which was reduced in three of four patients by CD4+ CD25hi T cell depletion (Fig. 5b). In four patients with inactive lupus, although depletion enhanced proliferation in two of four patients, this was not significant (Fig. 5c). In each of these patients, depletion was also associated with an increase in IFN-γ production, with a significant reduction in IL-10 production (Fig. 5c). The augmentation in IFN-γ production seen in our assays from four patients, each with an associated decrease in IL-10 production, suggests that, in these patients, CD4+ CD25hi Treg suppress IFN-γ responses to nucleosomes, possibly through production of IL-10. In only one of eight lupus patients did we see a response to nucleosomes from whole PBMC (L12, inactive lupus, Fig. 5c) that was not augmented by CD4+ CD25hi T cell depletion. From this analysis, we found no evidence for an association of impairment in CD4+ CD25hi Treg function in suppression of responses to SLE target autoantigens and active disease.
Fig. 5.
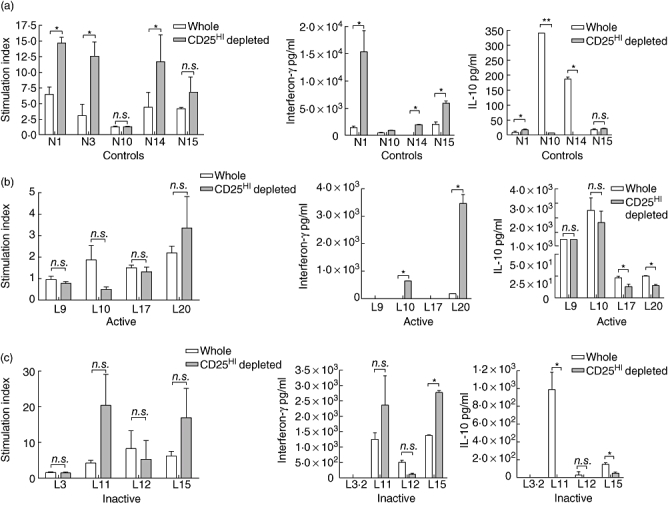
The effect of CD25hi depletion on peripheral blood mononuclear cells (PBMC) responses to nucleosomes. Whole and CD25 depleted PBMC from controls and individuals with systemic lupus erythematosus (SLE) were stimulated with a nucleosome preparation. Proliferation is presented as the stimulation index [counts per minute (cpm) PBMC stimulated with nucleosomes/PBMC background [3H]-thymidine incorporation (cpm)], as there was little proliferation above background in patients with active lupus and in some cases there was inhibition. Proliferation and the cytokine production of whole and CD25-depleted PBMC was compared using a two-tailed Student's t-test. All bars represent means with error bars at the standard deviation; n.s.: P-value > 0·05; *P-value < 0·05; **P-value < 0·01. (a) Effect of CD25 depletion on proliferation and production of interferon (IFN)-γ and interleukin (IL)-10 in five controls, with white bars representing whole PBMC and grey bars CD25-depleted PBMC. (b) Effect of CD25 depletion on proliferation and production of IFN-γ and IL-10 in four patients with active SLE. (c) Effect of CD25 depletion on proliferation and production of IFN-γ and IL-10 in four individuals with inactive SLE. L3·2 made no significant proliferative response (stimulation index whole and CD25-depleted PBMC < 2).
Discussion
In humans, deficient function of CD4+ CD25hi Tregs has been identified in several human autoimmune diseases [38], and CD4+ CD25hi Tregs have been shown to play a role in the restoration of tolerance to antigens targeted in Goodpasture's disease [39]. We sought to determine whether there was a deficit in CD4+ CD25hi T cells in patients with SLE, in either frequency or function or a lack of susceptibility to suppression in the CD4+ CD25- population. In the majority of patients assayed, despite an increase in total CD4+ CD25+ T cells, we found no significant changes in the frequency of CD4+ CD25hi T cells nor any phenotypic evidence that this population included recently activated cells. Importantly, on testing suppressive function with a polyclonal stimulus (anti-CD3- and anti-CD28-coated beads) and using antigen (nucleosomes), we found no evidence for defective suppressive function in the majority of patients. However, in one of four patients with active lupus, we found a total failure to suppress polyclonal proliferative responses.
There have been mixed results published with regard to the frequency of CD4+ CD25hi Tregs in SLE. We used a similar flow-cytometrically determined definition of what constituted CD4+ CD25hi Tregs to the studies that showed reduced levels in patients with active disease [26,27], but found no clear difference when comparing patients with active disease and healthy controls. Similar results to ours were obtained by others, including one study that compared frequencies of FoxP3 expressing cells in a subset of the active population [28]. These discrepancies between published projects may have arisen for a number of reasons. Corticosteroids may increase the proportion of CD4+ CD25hi T cells and FoxP3 expression, and all the patients with active disease we studied were receiving prednisolone [40]. In one study of SLE patients, an increase in CD4+ CD25hi T cells was found in those patients treated with prednisolone, but no difference was found when comparing patient groups on the basis of active or inactive disease with controls [30]. In the studies showing reduced levels, Crispin et al. measured frequencies in patients with active disease and no therapy, while Miyare et al. found a significant increase from depressed levels of CD4+ CD25hi T cells on resolution of SLE flares. In our group of patients, recruited from a lupus nephritis clinic, the risks of measuring frequencies off therapy are high. It remains possible that in patients with acute onset of flares of disease, possibly in the absence of drug therapy, CD4+ CD25hi T cells may be reduced. Secondly, we decided to use CD25 expression level to identify Tregs, as we wished to use this definition to sort cells for functional analysis, and our own data and those of others have shown a close correlation between increasing CD25 expression, the percentage of cells expressing FoxP3 and suppressive activity. The setting of a lower limit for high CD25 expression is always partially arbitrary, and utilization of definitions may differ sufficiently between groups to generate discordant data. To try to eliminate this potential source of variability, we carried out analysis of frequencies using different FACS definitions of ‘CD25hi’. With each definition we again found no differences between the groups studied (data not shown). A further possible reason is that SLE is a polygenic disease with diverse manifestations and probably diverse aetiologies. In some individuals, low Treg frequency may contribute to pathogenesis, but this may not be apparent in small populations.
At present, it remains unclear whether changes in the frequency of CD4+ CD25hi Treg are associated with SLE. The identification of new CD4+ CD25hi Treg markers would help in a better definition of the Treg frequency in different patient populations. The expression of intracellular FoxP3, which cannot be used for isolation of functional populations, by activated human CD4+ T cells limits the application of this marker for CD4+ CD25hi Treg enumeration in inflammatory diseases [24,41]. Although using CD25 expression level in conjunction with low or absent expression of the IL-7R may prove effective [42–44], the utility of this approach has not yet been determined in disease states which result in a generalized inflammatory state and lymphopenia, such as SLE. As SLE is a systemic disease, it will be difficult to rule out extravasation of CD4+ CD25hi Treg from peripheral blood as a cause of a low circulating frequency in untreated flares of disease, as activated human CD4+ CD25hi Treg express a wide range of chemokine receptors that enable tissue migration [45].
We found, as have others (including [30]), that active lupus is associated with an increase in total CD4+ CD25+ T cells. In patients with active disease, the main changes in cell surface phenotype were in the CD4+ CD25- T cell subset, with a higher percentage expressing CD45RO, HLA-DR and CTLA-4 and fewer expressing CD62L and CCR7 (Fig. 2). These changes suggest that disease activity is associated with a shift of naive CD25- CD45RA+ cells into the CD25+ CD45RO+ population, with a relative decrease in the proportion of CD25- cells. It seems unlikely that up to 80% of the peripheral blood CD4+ T cells are specific for the autoantigens targeted in SLE. We favour the hypothesis that the changes seen are a response to disease and drug-induced lymphopenia, as homeostatic expansion of naive T cells is associated with a shift from a ‘naive’ to a memory surface phenotype through self-antigen induced activation and stimulation with IL-7 [46].
We assessed the functional ability of CD4+ CD25hi T cells from SLE patients to suppress, using both potent polyclonal and antigen-specific stimuli. In the majority of patients we found no deficit in suppression (Figs 3–5). Several groups have examined suppressive function of CD4+ CD25hi T cells. One study, using allogeneic APC as stimulus, obtained similar results [27]. A second study, using phytohaemagglutinin stimulation, found a marked deficit in approximately 33% of the patients tested [28]. A recent publication, using FACS-separated CD4+ CD25hi T cells and antibody-mediated TCR stimulation, found that patients with active disease had an absolute loss of suppressive capability that was not seen in patients with inactive disease [31]. They made the comment that other studies had used a less stringent assay system, with anti-CD28 antibody stimulation unveiling a deficit in function. We also used anti-CD28 antibody stimulation, and in 75% of patients with active disease found no impairment of suppression. Again, there may be several reasons for these discrepancies, such as the time of assessing proliferation; however, the explanation that we favour is that impaired CD4+ CD25hi Treg function is not a universal finding in the diverse group of patients diagnosed with SLE.
One patient we analysed did show a complete absence of suppression, associated with production of high levels of IL-5 that may have partially suppressed IFN-γ production by the responder CD25- population. The lack of suppression at a 1 : 1 ratio suggests that there was a complete loss of inhibition of proliferation, rather than a dilution of suppressive activity, as might be expected if we had isolated a mixture of regulatory and non-regulatory CD4+ CD25hi T cells. The CD25int subset from this patient had a different cytokine ‘phenotype’ than the CD25hi population, producing IL-5 and IFN-γ at levels within the normal range for these assays (Fig. 3g and e and data not shown), while the CD25hi subset produced high levels of IL-5 and no IFN-γ. Of interest, reduced expression of FoxP3 in mice has been shown to impair suppressive function and favour the secretion of T helper type 2 (Th2) cytokines, with male mice developing autoimmunity with production of anti-nuclear and anti-dsDNA autoantibodies [47]. From our results we cannot say whether the lack of suppression seen was due to an impairment of CD4+ CD25hi Treg function or a quantitative deficiency because of replacement of CD4+ CD25hi Treg with CD25hi Th2 effector cells, or a combination of these possibilities. At present, no marker has been identified that could make this discrimination definitively. At the time of analysis, this individual was in a period of relative remission. It is possible that the lack of other autoimmune manifestations, which might be expected with complete failure of suppression, may reflect adaptive changes in this patient's immune system to utilize other regulatory mechanisms, such as through Th2 cytokines. Alternatively, complete dysfunction of the CD4+ CD25hi T cell subset seen on anti-CD3/anti-CD28 stimulation may translate to a lesser degree of impairment with more physiological antigen presentation. This patient differed from the other patients with active disease assayed in that, after failure to induce remission with cyclophosphamide, he had been treated with Rituximab in the 6 months prior to the assays shown. Rituximab therapy may increase expression of FoxP3 and persistent elevation of FoxP3 expression has been correlated with long-term remission after therapy [48]. We did not measure FoxP3 expression in this patient longitudinally but, as our data show, CD4+ CD25hi T cell function was impaired, despite relative clinical remission after Rituximab.
To determine whether there was a specific failure of suppression in lupus patients of responses to autoantigens targeted by pathogenic T and B cells in SLE patients, we assessed the effects of CD4+ CD25hi T cell depletion on the responses of PBMC to nucleosomes. We found that depletion unmasked marked proliferative and IFN-γ responses in control subjects, suggesting CD4+ CD25hi T cells regulate responses of the normal human immune system to self-antigens contained in nucleosomes. When analysing SLE patients we found, as have others [37], that most patients were hyporesponsive when compared with controls, with minimal proliferation seen. However, we found that in 80% of those patients producing IFN-γ in response to nucleosomes, CD4+ CD25hi T cell depletion augmented production, suggesting that where a response occurs a specific regulatory mechanism to these antigens is intact in the majority of patients. Including both controls and patients with lupus, 11 of 12 individuals produced IL-10 on stimulation of whole PBMC with nucleosomes. In eight of 11, depletion of CD4+ CD25hi T cells was associated with a fall in IL-10 production. This suggests that either CD4+ CD25hi Treg produce IL-10 in response to nucleosomes or alternatively induce IL-10 production from other responding cells in PBMC. There was no comparable IL-10 production in assays of suppression against Candida antigens (data not shown), suggesting that IL-10 secretion is a particular feature of responses to nucleosomes. This has been noted before, with one study demonstrating that five of 10 patients with lupus produced IL-10 ex vivo on stimulation of whole blood with nucleosomes [36].
Our study shows that in the majority of patients with lupus, CD4+ CD25hi Treg number and function are similar to controls. This may not be true of all patients, emphasizing the heterogeneous nature of this disease and the need for further studies in large groups of patients to assess the role CD4+ CD25hi Treg dysfunction plays in the burden of disease. In view of the association of low IL-2 production by T cells from patients with SLE, the association of autoimmunity and low IL-2 production [49,50] and the importance of this cytokine for maintenance of a functional CD4+ CD25hi T cell regulatory population, it seems likely that some patients may have deficient Treg function. We also showed that CD4+ CD25hi Treg have a role in the suppression of responses to nuclear antigens in healthy individuals, and in the majority of patients with lupus this regulation appears to be intact. It is possible that augmentation of this regulatory mechanism, for example through peptide therapy [51], may be an approach to treatment, although it is uncertain whether enhancing suppressive responses to this ubiquitous antigen would result in generalized immunosuppression or simply alleviate disease.
Acknowledgments
Thanks to Dr R. J. Edwards, Clinical Pharmacology, Hammersmith Hospital, Imperial College, for the nucleosome preparations, Eric O'Connor for cell sorting expertise and Jo Crozier, lupus nurse, for facilitating patient contacts. Research funded by a project grant from the National Kidney Research Fund, a research grant from the Hammersmith Hospital Research Fund and an MRC research training fellowship held by J. Y.
Supplementary material
The following supplementary material is available as part of the online article (full text) from: http://www.blackwellsynergy.com
Gating strategy for phenotypic analysis of CD25 subsets. An initial gate to define CD25hi using an internal control was created on dot-plots of CD25 staining of whole lymphocytes, with the lower limit of the gate set at the upper limit of CD25 expression by CD4-lymphocytes. This gate was added to CD4 cells alone, and gates created for the CD25hi2% population to be used for functional analysis (i.e. the 2% CD4+ T cells expressing the highest levels of CD25), CD25− cells and CD25int. These gates were created using anti-CD25-fluorescein isothiocyanate (FITC) when the marker of interest was identified using phycoerythrin (PE)-labelled antibodies (anti-glucocorticoid-induced tumour necrosis factor receptor family-related gene (GITR), CTLA-4 and CCR7). The filled grey plot in the histograms represents the isotype control, the black line staining of the CD25 subset.
Depletion of CD25hi cells from whole peripheral blood mononuclear cells (PBMC); 1·5 × 107 PBMC were incubated for 30 min at 4°C with 50 μl of anti-CD25 antibody-coated beads. To demonstrate the efficiency of CD25hi depletion, whole PBMC were stained with anti-CD4 and anti-CD25, and a CD25hi gate created using the upper limit of CD25 expression in CD4– lymphocytes as the lower limit of CD25hi expression. The first column shows the CD4/CD25 dot-plot of whole lymphocytes used to create the CD25hi gate in a control and a patient with active disease. The second column shows the percentage within this gate in whole CD4+ T cells and the gates used to define CD25int and CD25−. The third column shows the percentage of cells remaining in each of these gates after depletion and the fourth column shows the CD4+ T cells removed from the depleting beads.
Please note: Blackwell Publishing is not responsible for the content or functionality of any supplementary materials supplied by the authors. Any queries (other than missing material) should be directed to the corresponding author for the article.
References
- 1.Croker JA, Kimberly RP. Genetics of susceptibility and severity in systemic lupus erythematosus. Curr Opin Rheumatol. 2005;17:529–37. doi: 10.1097/01.bor.0000169360.15701.27. [DOI] [PubMed] [Google Scholar]
- 2.Mok CC, Lau CS. Pathogenesis of systemic lupus erythematosus. J Clin Pathol. 2003;56:481–90. doi: 10.1136/jcp.56.7.481. [DOI] [PMC free article] [PubMed] [Google Scholar]
- 3.Shlomchik MJ, Madaio MP. The role of antibodies and B cells in the pathogenesis of lupus nephritis. Springer Semin Immunopathol. 2003;24:363–75. doi: 10.1007/s00281-003-0119-1. [DOI] [PubMed] [Google Scholar]
- 4.Waldman M, Madaio MP. Pathogenic autoantibodies in lupus nephritis. Lupus. 2005;14:19–24. doi: 10.1191/0961203305lu2054oa. [DOI] [PubMed] [Google Scholar]
- 5.Hoffman RW. T cells in the pathogenesis of systemic lupus erythematosus. Clin Immunol. 2004;113:4–13. doi: 10.1016/j.clim.2004.05.001. [DOI] [PubMed] [Google Scholar]
- 6.Andreassen K, Bendiksen S, Kjeldsen E, et al. T cell autoimmunity to histones and nucleosomes is a latent property of the normal immune system. Arthritis Rheum. 2002;46:1270–81. doi: 10.1002/art.10254. [DOI] [PubMed] [Google Scholar]
- 7.Tiller T, Tsuiji M, Yurasov S, Velinzon K, Nussenzweig MC, Wardemann H. Autoreactivity in human IgG+ memory B cells. Immunity. 2007;26:205–13. doi: 10.1016/j.immuni.2007.01.009. [DOI] [PMC free article] [PubMed] [Google Scholar]
- 8.Sakaguchi S, Sakaguchi N, Asano M, Itoh M, Toda M. Immunologic self-tolerance maintained by activated T cells expressing IL-2 receptor alpha-chains (CD25). Breakdown of a single mechanism of self-tolerance causes various autoimmune diseases. J Immunol. 1995;155:1151–64. [PubMed] [Google Scholar]
- 9.Hori S, Nomura T, Sakaguchi S. Control of regulatory T cell development by the transcription factor Foxp3. Science. 2003;299:1057–61. doi: 10.1126/science.1079490. [DOI] [PubMed] [Google Scholar]
- 10.Zheng Y, Rudensky AY. Foxp3 in control of the regulatory T cell lineage. Nat Immunol. 2007;8:457–62. doi: 10.1038/ni1455. [DOI] [PubMed] [Google Scholar]
- 11.Knoechel B, Lohr J, Kahn E, Bluestone JA, Abbas AK. Sequential development of interleukin 2-dependent effector and regulatory T cells in response to endogenous systemic antigen. J Exp Med. 2005;202:1375–86. doi: 10.1084/jem.20050855. [DOI] [PMC free article] [PubMed] [Google Scholar]
- 12.Lim HW, Hillsamer P, Banham AH, Kim CH. Cutting edge: direct suppression of B cells by CD4+ CD25+ regulatory T cells. J Immunol. 2005;175:4180–3. doi: 10.4049/jimmunol.175.7.4180. [DOI] [PubMed] [Google Scholar]
- 13.Lim HW, Hillsamer P, Kim CH. Regulatory T cells can migrate to follicles upon T cell activation and suppress GC-Th cells and GC-Th cell-driven B cell responses. J Clin Invest. 2004;114:1640–9. doi: 10.1172/JCI22325. [DOI] [PMC free article] [PubMed] [Google Scholar]
- 14.Seo SJ, Fields ML, Buckler JL, et al. The impact of T helper and T regulatory cells on the regulation of anti-double-stranded DNA B cells. Immunity. 2002;16:535–46. doi: 10.1016/s1074-7613(02)00298-4. [DOI] [PubMed] [Google Scholar]
- 15.Bystry RS, Aluvihare V, Welch KA, Kallikourdis M, Betz AG. B cells and professional APCs recruit regulatory T cells via CCL4. Nat Immunol. 2001;2:1126–32. doi: 10.1038/ni735. [DOI] [PubMed] [Google Scholar]
- 16.Specht C, Schluter B, Rolfing M, Bruning K, Pauels HG, Kolsch E. Idiotype-specific CD4+CD25+ T suppressor cells prevent, by limiting antibody diversity, the occurrence of anti-dextran antibodies crossreacting with histone H3. Eur J Immunol. 2003;33:1242–9. doi: 10.1002/eji.200323273. [DOI] [PubMed] [Google Scholar]
- 17.Miyara M, Sakaguchi S. Natural regulatory T cells: mechanisms of suppression. Trends Mol Med. 2007;13:108–16. doi: 10.1016/j.molmed.2007.01.003. [DOI] [PubMed] [Google Scholar]
- 18.Chen Y, Cuda C, Morel L. Genetic determination of T cell help in loss of tolerance to nuclear antigens. J Immunol. 2005;174:7692–702. doi: 10.4049/jimmunol.174.12.7692. [DOI] [PubMed] [Google Scholar]
- 19.Hsu WT, Suen JL, Chiang BL. The role of CD4CD25 T cells in autoantibody production in murine lupus. Clin Exp Immunol. 2006;145:513–19. doi: 10.1111/j.1365-2249.2006.03173.x. [DOI] [PMC free article] [PubMed] [Google Scholar]
- 20.Wu HY, Staines NA. A deficiency of CD4+CD25+ T cells permits the development of spontaneous lupus-like disease in mice, and can be reversed by induction of mucosal tolerance to histone peptide autoantigen. Lupus. 2004;13:192–200. doi: 10.1191/0961203303lu1002oa. [DOI] [PubMed] [Google Scholar]
- 21.Bagavant H, Tung KS. Failure of CD25+ T cells from lupus-prone mice to suppress lupus glomerulonephritis and sialoadenitis. J Immunol. 2005;175:944–50. doi: 10.4049/jimmunol.175.2.944. [DOI] [PubMed] [Google Scholar]
- 22.Monk CR, Spachidou M, Rovis F, et al. MRL/Mp CD4+,CD25− T cells show reduced sensitivity to suppression by CD4+,CD25+ regulatory T cells in vitro: a novel defect of T cell regulation in systemic lupus erythematosus. Arthritis Rheum. 2005;52:1180–4. doi: 10.1002/art.20976. [DOI] [PubMed] [Google Scholar]
- 23.Baecher-Allan C, Brown JA, Freeman GJ, Hafler DA. CD4+CD25high regulatory cells in human peripheral blood. J Immunol. 2001;167:1245–53. doi: 10.4049/jimmunol.167.3.1245. [DOI] [PubMed] [Google Scholar]
- 24.Gavin MA, Torgerson TR, Houston E, et al. Single-cell analysis of normal and FOXP3-mutant human T cells: FOXP3 expression without regulatory T cell development. Proc Natl Acad Sci USA. 2006;103:6659–64. doi: 10.1073/pnas.0509484103. [DOI] [PMC free article] [PubMed] [Google Scholar]
- 25.Roncador G, Brown PJ, Maestre L, et al. Analysis of FOXP3 protein expression in human CD4+CD25+ regulatory T cells at the single-cell level. Eur J Immunol. 2005;35:1681–91. doi: 10.1002/eji.200526189. [DOI] [PubMed] [Google Scholar]
- 26.Crispin JC, Martinez A, Alcocer-Varela J. Quantification of regulatory T cells in patients with systemic lupus erythematosus. J Autoimmun. 2003;21:273–6. doi: 10.1016/s0896-8411(03)00121-5. [DOI] [PubMed] [Google Scholar]
- 27.Miyara M, Amoura Z, Parizot C, et al. Global natural regulatory T cell depletion in active systemic lupus erythematosus. J Immunol. 2005;175:8392–400. doi: 10.4049/jimmunol.175.12.8392. [DOI] [PubMed] [Google Scholar]
- 28.Alvarado-Sanchez B, Hernandez-Castro B, Portales-Perez D, et al. Regulatory T cells in patients with systemic lupus erythematosus. J Autoimmun. 2006;27:110–18. doi: 10.1016/j.jaut.2006.06.005. [DOI] [PubMed] [Google Scholar]
- 29.Liu MF, Wang CR, Fung LL, Wu CR. Decreased CD4+CD25+ T cells in peripheral blood of patients with systemic lupus erythematosus. Scand J Immunol. 2004;59:198–202. doi: 10.1111/j.0300-9475.2004.01370.x. [DOI] [PubMed] [Google Scholar]
- 30.Suarez A, Lopez P, Gomez J, Gutierrez C. Enrichment of CD4+ CD25high T cell population in patients with systemic lupus erythematosus treated with glucocorticoids. Ann Rheum Dis. 2006;65:1512–17. doi: 10.1136/ard.2005.049924. [DOI] [PMC free article] [PubMed] [Google Scholar]
- 31.Valencia X, Yarboro C, Illei G, Lipsky PE. Deficient CD4+CD25high T regulatory cell function in patients with active systemic lupus erythematosus. J Immunol. 2007;178:2579–88. doi: 10.4049/jimmunol.178.4.2579. [DOI] [PubMed] [Google Scholar]
- 32.Hochberg MC. Updating the American College of Rheumatology revised criteria for the classification of systemic lupus erythematosus. Arthritis Rheum. 1997;40:1725. doi: 10.1002/art.1780400928. [DOI] [PubMed] [Google Scholar]
- 33.Watson K, Gooderham NJ, Davies DS, Edwards RJ. Nucleosomes bind to cell surface proteoglycans. J Biol Chem. 1999;274:21707–13. doi: 10.1074/jbc.274.31.21707. [DOI] [PubMed] [Google Scholar]
- 34.Carlin LM, Yanagi K, Verhoef A, et al. Secretion of IFN-gamma and not IL-2 by anergic human T cells correlates with assembly of an immature immune synapse. Blood. 2005;106:3874–9. doi: 10.1182/blood-2005-03-0996. [DOI] [PubMed] [Google Scholar]
- 35.Kaliyaperumal A, Michaels MA, Datta SK. Naturally processed chromatin peptides reveal a major autoepitope that primes pathogenic T and B cells of lupus. J Immunol. 2002;168:2530–7. doi: 10.4049/jimmunol.168.5.2530. [DOI] [PubMed] [Google Scholar]
- 36.Lu L, Kaliyaperumal A, Boumpas DT, Datta SK. Major peptide autoepitopes for nucleosome-specific T cells of human lupus. J Clin Invest. 1999;104:345–55. doi: 10.1172/JCI6801. [DOI] [PMC free article] [PubMed] [Google Scholar]
- 37.Salaman MR, Mawer DP, Hogarth MB, Seifert MH, Isenberg DA. Counter-proliferative effects of nucleosomal antigens in cultures from lupus patients. Lupus. 2001;10:332–9. doi: 10.1191/096120301678064089. [DOI] [PubMed] [Google Scholar]
- 38.Baecher-Allan C, Hafler DA. Human regulatory T cells and their role in autoimmune disease. Immunol Rev. 2006;212:203–16. doi: 10.1111/j.0105-2896.2006.00417.x. [DOI] [PubMed] [Google Scholar]
- 39.Salama AD, Chaudhry AN, Holthaus KA, et al. Regulation by CD25+ lymphocytes of autoantigen-specific T-cell responses in Goodpasture's (anti-GBM) disease. Kidney Int. 2003;64:1685–94. doi: 10.1046/j.1523-1755.2003.00259.x. [DOI] [PubMed] [Google Scholar]
- 40.Karagiannidis C, Akdis M, Holopainen P, et al. Glucocorticoids upregulate FOXP3 expression and regulatory T cells in asthma. J Allergy Clin Immunol. 2004;114:1425–33. doi: 10.1016/j.jaci.2004.07.014. [DOI] [PubMed] [Google Scholar]
- 41.Tran DQ, Ramsey H, Shevach EM. Induction of FOXP3 expression in naive human CD4+FOXP3– T cells by T cell receptor stimulation is TGF{beta}-dependent but does not confer a regulatory phenotype. Blood. 2007;110:2983–90. doi: 10.1182/blood-2007-06-094656. [DOI] [PMC free article] [PubMed] [Google Scholar]
- 42.Hartigan-O'Connor DJ, Poon C, Sinclair E, McCune JM. Human CD4+ regulatory T cells express lower levels of the IL-7 receptor alpha chain (CD127), allowing consistent identification and sorting of live cells. J Immunol Methods. 2007;319:41–52. doi: 10.1016/j.jim.2006.10.008. [DOI] [PubMed] [Google Scholar]
- 43.Liu W, Putnam AL, Xu-Yu Z, et al. CD127 expression inversely correlates with FoxP3 and suppressive function of human CD4+ T reg cells. J Exp Med. 2006;203:1701–11. doi: 10.1084/jem.20060772. [DOI] [PMC free article] [PubMed] [Google Scholar]
- 44.Seddiki N, Santner-Nanan B, Martinson J, et al. Expression of interleukin (IL)-2 and IL-7 receptors discriminates between human regulatory and activated T cells. J Exp Med. 2006;203:1693–700. doi: 10.1084/jem.20060468. [DOI] [PMC free article] [PubMed] [Google Scholar]
- 45.Lim HW, Broxmeyer HE, Kim CH. Regulation of trafficking receptor expression in human forkhead box P3+ regulatory T cells. J Immunol. 2006;177:840–51. doi: 10.4049/jimmunol.177.2.840. [DOI] [PubMed] [Google Scholar]
- 46.Min B, Yamane H, Hu-Li J, Paul WE. Spontaneous and homeostatic proliferation of CD4 T cells are regulated by different mechanisms. J Immunol. 2005;174:6039–44. doi: 10.4049/jimmunol.174.10.6039. [DOI] [PubMed] [Google Scholar]
- 47.Wan YY, Flavell RA. Regulatory T-cell functions are subverted and converted owing to attenuated Foxp3 expression. Nature. 2007;445:766–70. doi: 10.1038/nature05479. [DOI] [PubMed] [Google Scholar]
- 48.Sfikakis PP, Souliotis VL, Fragiadaki KG, Moutsopoulos HM, Boletis JN, Theofilopoulos AN. Increased expression of the FoxP3 functional marker of regulatory T cells following B cell depletion with rituximab in patients with lupus nephritis. Clin Immunol. 2007;123:66–73. doi: 10.1016/j.clim.2006.12.006. [DOI] [PubMed] [Google Scholar]
- 49.Yamanouchi J, Rainbow D, Serra P, et al. Interleukin-2 gene variation impairs regulatory T cell function and causes autoimmunity. Nat Genet. 2007;39:329–37. doi: 10.1038/ng1958. [DOI] [PMC free article] [PubMed] [Google Scholar]
- 50.Altman A, Theofilopoulos AN, Weiner R, Katz DH, Dixon FJ. Analysis of T cell function in autoimmune murine strains. Defects in production and responsiveness to interleukin 2. J Exp Med. 1981;154:791–808. doi: 10.1084/jem.154.3.791. [DOI] [PMC free article] [PubMed] [Google Scholar]
- 51.Kang HK, Michaels MA, Berner BR, Datta SK. Very low-dose tolerance with nucleosomal peptides controls lupus and induces potent regulatory T cell subsets. J Immunol. 2005;174:3247–55. doi: 10.4049/jimmunol.174.6.3247. [DOI] [PubMed] [Google Scholar]
Associated Data
This section collects any data citations, data availability statements, or supplementary materials included in this article.
Supplementary Materials
Gating strategy for phenotypic analysis of CD25 subsets. An initial gate to define CD25hi using an internal control was created on dot-plots of CD25 staining of whole lymphocytes, with the lower limit of the gate set at the upper limit of CD25 expression by CD4-lymphocytes. This gate was added to CD4 cells alone, and gates created for the CD25hi2% population to be used for functional analysis (i.e. the 2% CD4+ T cells expressing the highest levels of CD25), CD25− cells and CD25int. These gates were created using anti-CD25-fluorescein isothiocyanate (FITC) when the marker of interest was identified using phycoerythrin (PE)-labelled antibodies (anti-glucocorticoid-induced tumour necrosis factor receptor family-related gene (GITR), CTLA-4 and CCR7). The filled grey plot in the histograms represents the isotype control, the black line staining of the CD25 subset.
Depletion of CD25hi cells from whole peripheral blood mononuclear cells (PBMC); 1·5 × 107 PBMC were incubated for 30 min at 4°C with 50 μl of anti-CD25 antibody-coated beads. To demonstrate the efficiency of CD25hi depletion, whole PBMC were stained with anti-CD4 and anti-CD25, and a CD25hi gate created using the upper limit of CD25 expression in CD4– lymphocytes as the lower limit of CD25hi expression. The first column shows the CD4/CD25 dot-plot of whole lymphocytes used to create the CD25hi gate in a control and a patient with active disease. The second column shows the percentage within this gate in whole CD4+ T cells and the gates used to define CD25int and CD25−. The third column shows the percentage of cells remaining in each of these gates after depletion and the fourth column shows the CD4+ T cells removed from the depleting beads.