

Abstract
Stimulation of T lymphocytes results in the calcium-dependent activation and repression of a large number of genes. However, the functional response made by different T cell subsets is heterogeneous, as their differentiation results in alterations in their sensitivity to activation and in the secretion of cytokines. Here we have investigated the patterns of calcium responses in CD4 and CD8 T cell subsets to help explain their different responses to activation. CD4+ CD45RA+ T cells isolated freshly from human blood gave a sustained calcium signal after stimulation, but this was smaller than elicited in CD4+ CD45RO+ cells. On in vitro differentiation of CD4+ CD45RA+ cells to CD45RO+, the level of the cytoplasmic calcium response rose initially, but then declined steadily during further rounds of differentiation. The proportion producing an oscillatory calcium response or not responding was increased and differentiation was accompanied by a shift in the calcium between intracellular pools. CD8+ T cells gave a smaller calcium response than paired CD4+ T cells and showed a difference in the numbers of cells giving a transient, rather than sustained, calcium signal. The increase in oscillating cells in the CD4+ CD45RO+ population may reflect the heterogeneity of this population, particularly in terms of cytokine production. The changing patterns of calcium responses in T cells as they differentiate may explain variation in the cellular response to activation at different stages in their lifespan and emphasize the importance of the both the quantity and the quality of the calcium signal in determining the outcome of T cell activation.
Keywords: calcium, CD45, differentiation, oscillations, signalling, T lymphocyte
Introduction
T lymphocytes, divided into subsets based on their expression of CD45RA and CD45RO, respectively, have different activation requirements as well as different signalling and functional responses [1,2]. These subsets have in the past been related broadly to naive and primed cells in which contrasting cytokine secretion, adhesion, trafficking and activation dependencies have been observed (reviewed in [3]). CD45RO+ T cells proliferate more strongly to recall antigens and to CD2/CD3-mediated stimulation, while CD45RA+ T cells proliferate less well in response to exogenous cytokines [2,4,5]. CD45RO+ T cells have been shown to secrete a broad range of cytokines while CD45RA+ T cells secrete only interleukin (IL)-2 [6–8].
These differences may result from distinctive activation signalling pathways in the two cell types, and particularly notable is the reported difference in the magnitude of [Ca2+]i response [1,9], which is crucial to the regulation of a large number of T cell genes including cytokines [10]. A greater mean increase in [Ca2+]i in CD4+ CD45RA+ compared with CD4+ CD45RO+ T cells following stimulation has been reported [9] which was due to a higher response from the entire population of cells rather than only a few cells showing an elevated response. In contrast, Robinson et al. [1] found that the magnitude of the CD3-induced [Ca2+]i response was 80% greater in CD45RO+ T cells compared with the CD45RA+ subset.
On stimulating T cells through the T cell receptor (TCR), a variety of different [Ca2+]i response patterns are observed in individual cells. These patterns are determined in part by the type of stimulus, the strength of the stimulus and by the phenotype of the cell. The emerging importance of the spatiotemporal changes in [Ca2+]i signal in the functional outcome following activation of a cell has highlighted the need to study [Ca2+]i responses at the single cell level [11]. In single B cells a high, but transient, rise in [Ca2+]i has been associated with preferential activation of nuclear factor kappa B (NFκB) and c-Jun kinase (JNK) while a lower sustained rise in [Ca2+]i induced nuclear translocation of nuclear factor of activated T cells (NFAT) and extracellular-regulated kinase (ERK) [12,13]. Whether the pattern of [Ca2+]i signal leads to the differential activation of transcription factors in T cells is less clear, but there is some suggestion that this is the case, as stimuli that give rise to proliferative responses are associated with a sustained but modest increase in [Ca2+]i but not with a transient increase in individual cells [14,15]. Differential activation of transcription factors may result from the different calcium signals in T cells, as this was demonstrated in B cells, and there are strong suggestions that the patterns of calcium response regulate transcriptional activators differently in T helper 1 (Th1) and Th2 T cells resulting in their contrasting cytokine expression [16]. Therefore, a difference in [Ca2+]i response patterns could underlie a differential expression of transcription factors and hence the contrasting functions of CD45RA+ and CD45RO+ T cells.
In human pathologies depressed calcium responses have been related to decreased functional responses of the T cells [17,18] and to an increase in the number of T cells giving an oscillatory calcium response [19]. T cells in the rheumatoid arthritis joint are predominantly of a CD45RO+ memory phenotype [20], which might be expected to given an enhanced calcium response [1], but their expression of CD45RB is very low, suggesting that they are of a late memory type [20]. Because these cells proliferate poorly to mitogenic stimulation, they might also give a decreased or oscillating calcium signal, resulting in their functional phenotype, but studies on calcium signals in highly differentiated T cells have not been reported.
In this study, we have examined the patterns and magnitudes of [Ca2+]i responses in single cells following activation of different CD4 and CD8 T cell subsets, as well as in CD4 T cells at different stages of in vitro differentiation. We found that there is a shift in intracellular calcium pools, the calcium responses decline overall and become more oscillatory as the cells differentiate, which may explain the shift in function of memory and late memory T cells.
Materials and methods
Separation of T cell subsets
Peripheral blood mononuclear cells were prepared from healthy volunteers using centrifugation on Ficoll-Paque (GE Healthcare, Little Chalfont, UK) as described previously [19]. The study was approved by the South Birmingham Local Research Ethics Committee and samples were collected following informed consent of the donors. After a 1 h adhesion at 37°C on a serum-coated Petri dish, non-adherent cells were depleted of non-T cells using a cocktail of antibodies (against CD11c, CD14, CD16, CD19, glycophorin, human leucocyte antigen D-related and TCRγδ) and magnetic beads. In order to obtain specific subsets of T cells, additional antibodies were added as follows: for CD4+ CD45RA+ T cells anti-CD45RO and anti-CD8 were added; for CD4+ CD45RO+ T cells anti-CD45RA and anti-CD8 were added; for CD4+ T cells anti-CD8 was added; and for CD8+ T cells anti-CD4 was added. This negative selection procedure was repeated three times. The resulting T cells were split for use in [Ca2+]i studies and for assessment of cell phenotype by flow cytometry using a Coulter Epics XL cytometer. Cell preparations were greater than 95% of the required phenotype.
T cell culture
CD4+ CD45RA+ T cells were separated from whole peripheral blood as described above to a purity of at least 95%. Gamma-irradiated (3000 Rad) Epstein–Barr virus (EBV)-transformed cultured B lymphocytes from the same individual were added into the initial culture at a ratio of 1 : 10 (EBV-transformed B cells : T cells), T cells being included at a density of 0·25 × 106/ml. The culture medium consisted of RPMI-1640 with 2 mM glutamine, 100 units/ml penicillin, 100 μg/ml streptomycin, 1% sodium pyruvate, 1% non-essential amino acids, 1% HEPES and 5% human serum. Phytohaemagglutinin (PHA-P) (Sigma, Poole, UK) at a concentration of 1 μg/ml was added as the initial stimulus to the culture. To maintain the culture, 25 units/ml of recombinant human IL-2 were added on day 4 of the culture and cells were fed with fresh medium on days 7 and 11. On day 14, cells were removed for measurement of [Ca2+]i responses and the culture cycle was repeated as for day 1. This stimulation cycle was repeated twice more so that cells at days 0, 14, 28 and 42 could be compared. Throughout the culture period cell purity and differentiation were followed using flow cytometry to assess, in particular, the CD45RB isoform expression by the cells, which fell to very low levels by day 28, as shown previously using this culture system [21].
[Ca2+]i measurement by single cell ion imaging
Single cell calcium responses using Fura-2 (Invitrogen, Paisley, UK) loaded cells were assessed as described previously [19] using 10 μg/ml of PHA-P as the agonist. We chose to use a single concentration of this widely used agonist in order to be able to compare results with those published previously using lymphocytes from patients [19] and in functional studies on different human T cell subsets [22]. The single cell imaging system (Ionvision, Improvision, Warwick, UK) was calibrated using solutions containing a known [Ca2+] with 2 μM free Fura-2. Data were transferred into a Microsoft Excel spreadsheet and the [Ca2+]i plotted against time for each individual cell. The [Ca2+]i responses were categorized as peak–plateau, oscillating, transient or non-responding, as we have described previously [19,23] using a similar classification system used by others [24]. The groups were defined as previously [19,23] as: (i) no response: no increase in [Ca21]i signal after PHA-P stimulation; (ii) oscillating response: three or more peak–trough cycles during a period of 10 min; (iii) transient response: peak response followed by a return to baseline [Ca21]i; and (iv) peak–plateau response: peak response followed by a sustained plateau at the same or lower level, but not returning to baseline. Any cell moving significantly in the field was eliminated from the analysis, as such anomalous responses affected the overall analysis. In some experiments this categorization was assisted by a neural-network computational approach of pattern recognition which we have shown can categorize more than 70% of the cells assessed [19,23].
[Ca2+]i measurement by spectrofluorimetry
Purified T cells were resuspended at 2·5 × 106 cells/ml in 1·4 mM Ca2+ Hanks' balanced salt solution (HBSS) + 1% heat-inactivated fetal calf serum + 25 mM HEPES buffer + 7·5% NaHCO3 + 10 mM glucose to a pH of 7·4 (referred to hereafter as Ca2+ HBSS) and loaded with Indo-1 AM ester (Invitrogen) at 1 μM [25]. To confirm that the cells were resting and produced a stable baseline, the ratio of the fluorescent intensity at the two emission wavelengths was observed for 60 s and then the stimuli were added through a light occlusive stopper in the top of the fluorimeter. After addition of the stimulus the trace was observed until a stable plateau response was achieved. A calibration file was generated to allow calculation of [Ca2+]i from the ratio of fluorescence intensity, as we have described previously [19].
Statistical analysis
A paired t-test was used for comparison of both patterns and magnitudes of [Ca2+]i responses at the single cell level in different cell populations. P-values of less than 0·05 were considered statistically significant.
Results
Magnitude and patterns of [Ca2+]i responses in CD4+ CD45RA+ and CD4+ CD45RO+ T cells
In order to determine whether a difference in [Ca2+]i response patterns might underlie the different functional outcomes seen in naive and memory T cells, we separated CD4+ CD45RA+ and CD4+ CD45RO+ T cells from the peripheral blood of healthy volunteers and measured the calcium signals in response to PHA-P. Figure 1a shows the peak rise in cytoplasmic calcium in cells in suspension in the fluorimeter in cells from six individual donors and in all cases the magnitude of the calcium rise in the CD45RO+ cells was higher than in the paired CD45RA+ cells. The mean rise in the CD45RA+ cells was 233 nM [±89·8 standard deviation (SD)], while that in the CD45RO+ was 306 nM (±95·7 SD), a statistically significant (P = 0·003) increase of 30%.
Fig. 1.
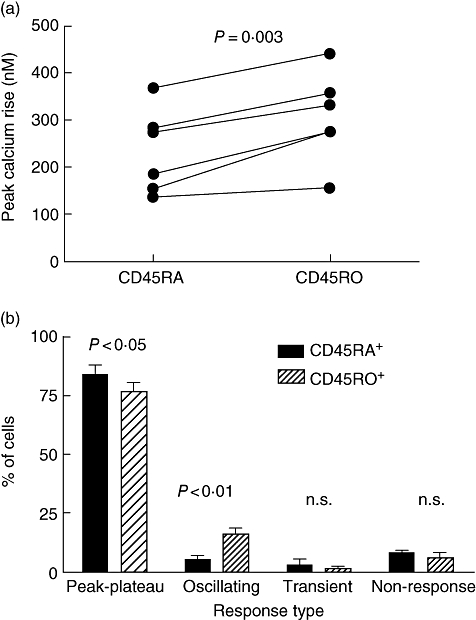
Magnitude and patterns of calcium responses are different in CD45RO+ and CD45RA+ T cells isolated from peripheral blood. (a) CD4+ CD45RA+ and CD4+ CD45RO+ T cells were isolated from the peripheral blood of the same donor, loaded with Indo-1 and calcium responses to 10 μg/ml phytohaemagglutinin (PHA-P) acquired using a fluorimeter with cells in suspension. Paired data from six different donors is shown, and plotted is the rise between baseline and maximum provoked by the lectin. (b) CD4+ CD45RA+ and CD4+ CD45RO+ T cells were isolated from the PB of the same donor, loaded with Fura-2 and calcium responses to 10 μg/ml PHA-P imaged over a period of up to 20 min. For each donor this was repeated two to three times on different cells from each population. Each cell was analysed individually and assigned to one of the four calcium patterns (peak–plateau, oscillating, transient or non-response). Shown are results from three donors; between 70 and 270 cells of each type were analysed on each occasion. The data shown were derived from 447 CD45RA+ cells and 649 CD45RO+ cells.
We then assessed the calcium responses given by CD4+ T cells from three individuals at the single cell level and the [Ca2+]i patterns given by the two subsets in response to stimulation with PHA-P were classified as ‘peak–plateau’, ‘oscillating’, ‘transient’ or ‘non-responsive’ using a classification that we adopted [19,23] based on previous work by others [24]. It was possible to allocate all cells to one of these categories and examples of individual cell responses are shown in previous publications [19,23].
In all three donors, there was a decreased proportion of peak–plateau responders and an increased proportion of oscillators in the CD45RO+ population (16·2 ± 3·1%) when compared with the CD45RA+ population (5·5 ± 2·0%) (Fig. 1b). There was no consistent trend for the proportions of transient responders or non-responders in the two populations. The increase in oscillating cells in the CD45RO+ population was balanced largely by the reduced proportion of peak–plateau responders in the CD45RO+ population compared with the CD45RA+ population (P < 0·01). Overall, there were three times as many oscillating cells in the CD45RO+ population, while the proportion of peak–plateau responders was decreased by over 10%.
[Ca2+]i signalling in CD4+ T cells undergoing progressive differentiation
While expression of CD45RA or CD45RO on T cells can be used to differentiate broadly between naive and memory cells, the CD45RO+ subset consists of a heterogeneous group of cells at various stages of differentiation, including both recently primed (CD45RBbright) and highly differentiated (CD45RBdull) cells. Variation in stage of differentiation could impact substantially on the [Ca2+]i responses seen in the CD45RO+ subset. CD45RA+ T cells taken through several rounds of stimulation during in vitro culture have been shown to differentiate progressively from a CD45RA+ CD45Rbbright CD45ROdull phenotype to a CD45RA- CD45Rbdull CD45RObright phenotype [21]. We therefore set up a long-term T cell culture system to study the effects of progressive differentiation on single cell [Ca2+]i responses.
Figure 2a shows the phenotypic changes occurring in the T cell culture where the cells initially express CD45RA, which declines rapidly as the CD45RO rises, a picture similar to that reported previously [21]. These differentiated cells were then used for signalling studies, and Fig. 2b illustrates the magnitude of the [Ca2+]i responses given by the whole population of cells stimulated on different days of culture. There was a statistically significant 45% increase from 293 nM (±48·0 SD) to 424 nM (±96·3 SD) in the size of the response between the first day of the culture, when the cells were CD45RA+, and day 14 of the culture where the phenotypic switch to CD45RO+ CD45RBbright had occurred. This observation is consistent with Fig. 1, where the CD45RO+ cells gave a higher overall response than the CD45RA+ cells. However, when the cells were differentiated further there was a statistically significant drop in the magnitude of the calcium response to below that of the original CD45RA+ cell preparation (Fig. 2b) after the next round of stimulation and this declined even further, such that by day 42 a very small calcium signal was obtained.
Fig. 2.
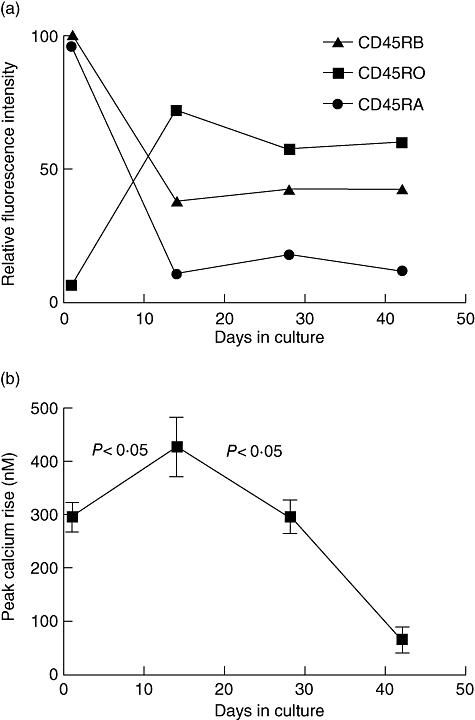
Phenotype and calcium responses to phytohaemagglutinin (PHA-P) shift as CD4+ T cells differentiate from CD45RA+ to CD45RO+. A starting population of CD4+ CD45RA+ T cells were stimulated repeatedly with PHA every 14 days over a period of 42 days in culture and cell phenotype and calcium responses assessed prior to each restimulation. (a) The expression of the CD45 isoforms CD45RA, CD45RB and CD45RO is shown from one example representative of three independent experiments. (b) The peak calcium rise at each time point in the differentiation culture is shown (n = 3).
In order to assess the effects of progressive differentiation on T cell signalling at the single cell level, we studied the single cell [Ca2+]i responses in T cells from the same culture populations as those used in the fluorimetry studies. A total of 6946 cultured T cells were examined (3205 from day 1, 1261 from day 14, 2131 from day 28 and 349 from day 42). These were taken from five to eight separate stimulations on different samples of cells from the given day of culture from three separate experiments (Fig. 3).
Fig. 3.
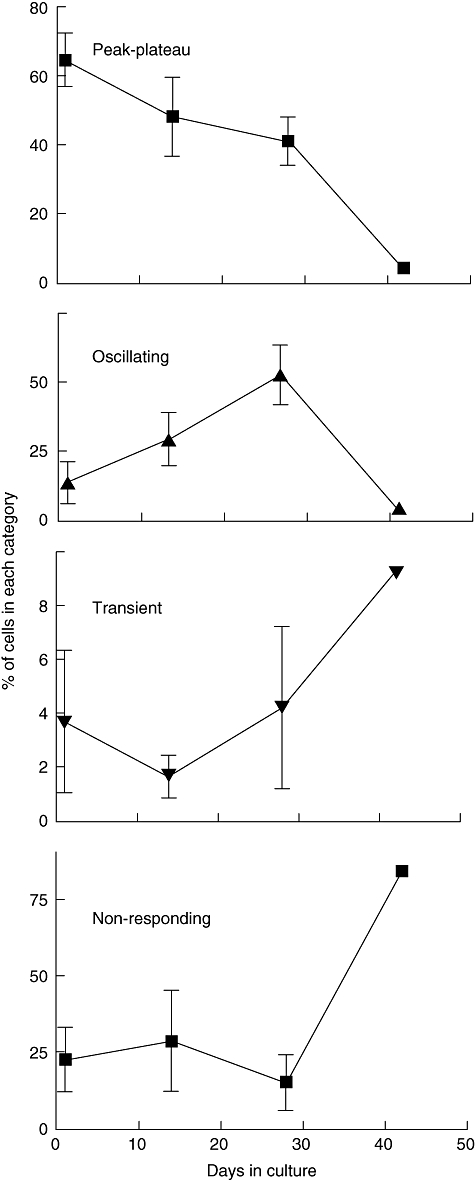
Proportions of each calcium response type vary at different stages of long-term CD4+ T cell culture. Shown are the proportions of all cells stimulated and analysed on a given day of culture giving the different patterns of calcium response. The results represent cells taken from three different cultures (day 42 represents just one culture). The results for each culture date were obtained by aggregating responses from five to eight separate stimulations on different samples of cells from the culture population. A total of 6946 cultured T cells were examined (3205 on day 1, 1261 on day 14, 2131 on day 28 and 349 on day 42).
Between days 1 and 28, there was no consistent change in the proportions of transient responders or non-responders. There was, however, a consistent increase in the proportion of oscillating cells, progressing steadily from days 1 to 14 to 28 and a concomitant decrease in the proportion of peak–plateau responders throughout the culture period. By day 42 the majority of cells were non-responders, which represented more than 75% of the cells. This may help to account for the very low overall calcium responses seen in the bulk population cells at this stage of culture (Fig. 2). While cells at this stage of differentiation can be more susceptible to apoptosis [21], the presence of exogenous IL-2 and the relatively high density of the cell cultures is protective, and the cell viability remained above 78% in these cultures. Furthermore, the cells still gave a calcium signal in response to ionomycin (data not shown), indicating that they remained intact and dye-loaded, but were unable to process a signal through the T cell antigen receptor.
In T cells the rise in cytoplasmic calcium derives from two sources: release from intracellular stores and an influx across the plasma membrane. Release from stores largely controls the plasma membrane flux and, as we have observed a redistribution of the calcium within cells from rheumatoid arthritis patients [18,19], we wished to assess whether the pools were redistributed in differentiated T cells. Figure 4 shows the analysis of intracellular stores in cells differentiated in vitro, in which we stimulated them sequentially with PHA-P [to release the inositol triphosphate (IP3) sensitive store], thapsigargin (to release any remaining endoplasmic reticulum store) and ionomycin (to release any remaining pools). There was no change in the ionomycin-released calcium over the period of culture (not shown for clarity), but there appears to be a reciprocal relationship between the PHA-P- and thapsigargin-released pools, the latter showing a slight decline in newly differentiated CD45RO+ T cells when compared with the starting CD45RA+ cells, and then increasing as the PHA-P pool declined during further culture.
Fig. 4.
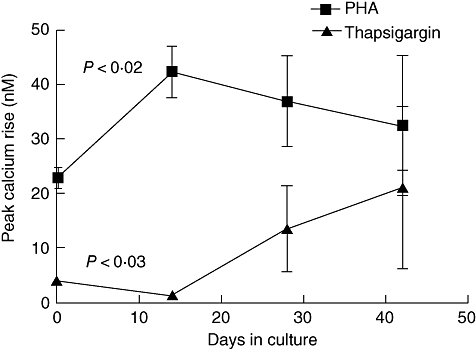
Intracellular calcium pools are altered at different stages of long-term CD4+ T cell culture. Release of calcium from intracellular pools was assessed in cells cultured as in Figs 2 and 3. Calcium responses were assessed in Ca2+-free medium by sequential addition of phytohaemagglutinin, thapsigargin and ionomycin as described previously [19]. Ionomycin responses did not change over time and so are omitted for clarity.
[Ca2+]i signalling in CD4+ and CD8+ peripheral blood T cells
Differences in calcium responses between CD4 and CD8 T cells have been reported, but studies are rather limited. We wished to determine whether the complexity of calcium responses that we had observed in CD4+ T cells were also present in CD8+ T cells.
Figure 5a illustrates a representative experiment in which a population of CD4+ and a population of CD8+ T cells, isolated from the same individual, were each stimulated with PHA-P with the resulting [Ca2+]i response being observed and measured using spectrofluorimetry. When we repeated this in CD4+ and CD8+ T cells isolated from a further three individuals we found that this was a consistent observation, with the rise in [Ca2+]i being significantly smaller in the CD8+ population when compared with the CD4+ population of cells (P < 0·05) (Fig. 5b).
Fig. 5.
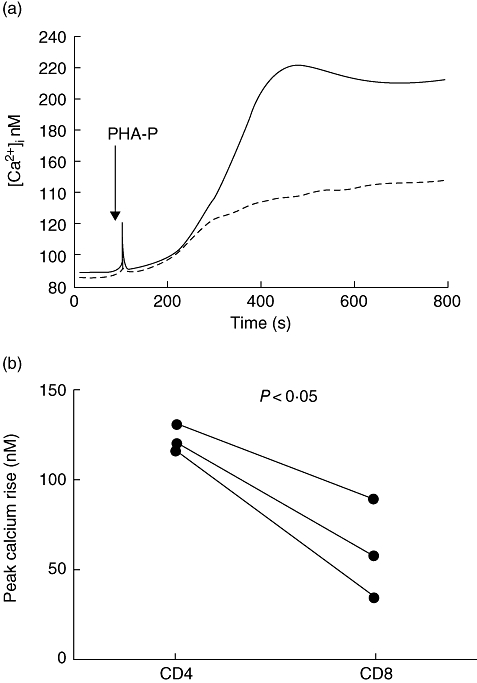
[Ca2+]i signal in response to phytohaemagglutinin (PHA-P) are lower in CD8+ than in CD4+ T cells. CD4 and CD8 T cells isolated freshly from the same donors were loaded with Indo-1 and calcium responses to PHA-P assessed in a fluorimeter. (a) A representative response of CD4+ and CD8+ T cells from one of the three donors is shown. (b) Paired data from three different donors are shown, and plotted is the rise between baseline and maximum provoked by PHA-P in the CD4 and CD8 T cells.
The decrease in magnitude of [Ca2+]i in these populations of CD8+ T cells could have been due to a decrease in the size of the [Ca2+]i response in individual cells within the population, a decrease in the number of responding cells or to a change in the patterns of [Ca2+]i responses in single cells. Therefore, we used single cell imaging to study the patterns (Fig. 6) of [Ca2+]i responses. CD4+ and CD8+ T cells from four different donors were used with a total of 1078 CD4+ and 734 CD8+ T cells analysed. Figure 6a demonstrates clear differences between the patterns of responses in CD4+ and CD8+ T cells. In comparison with CD4+ T cells, CD8+ T cells gave a decreased proportion of peak–plateau responses and an increased proportion of transient and non-responding cells, while the proportions of oscillating cells were comparable.
Fig. 6.
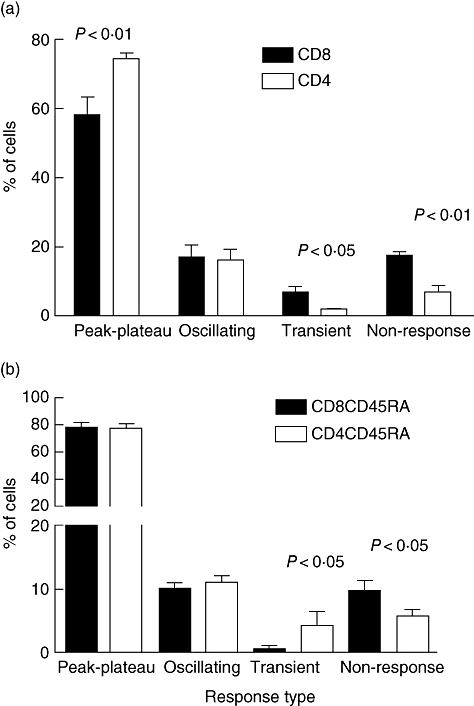
Patterns of calcium response differ in peripheral blood CD4+ and CD8+ T cells isolated from the peripheral blood. (a) CD4+ and CD8+ T cells were isolated from the peripheral blood of the same donor and responses to phytohaemagglutinin (PHA-P) imaged. This was repeated two to four times on each cell type from each of four donors. A total of 1078 CD4 and 734 CD8 T cells were assessed. (b) CD8+ CD45RA+ and CD4+ CD45RA+ T cells were isolated from the same donor. At least four fields of cells were assessed for each preparation of cells, which was repeated with three different donors. A total of 2671 CD8+ CD45RA+ and 2493 CD4+ CD45RA+ T cells were assessed.
When the results from the 1812 cells analysed were aggregated, the decrease in peak–plateau and the increase in non-responsive cells in the CD8+ population were statistically significant (P < 0·01), while the increase in transient responses was also significant at P < 0·05. Overall, the proportion of peak–plateau responders was decreased by 32% while the proportions of both transient and non-responsive cells were increased by 243%. In all four donors the median response in the CD8+ population was lower than that in the CD4+ population. This difference was statistically significant in each case (P < 0·01).
In these experiments the CD4+ and CD8+ populations that we used would have contained cells at different stages of differentiation, which we used in order to be able to compare our results with the previously published data. However, the distribution of these cells may be very different, because CD8+ T cells can undergo very rapid population shifts in response to viral infections [26]. We therefore isolated CD4+ CD45RA+ and CD8+ CD45RA+ T cells from a number of donors and compared the calcium response patterns of these ‘naive’ cells. The majority of these cells in both groups gave a peak–plateau response (Fig. 6b), and both subsets contained equal numbers of oscillating cells. However, the CD8 cells made significantly fewer transient responses, which were balanced by an increase in non-responding cells. The decrease in the numbers of the transient responders in this CD8+ CD45RA+ cell population suggests that the CD8+ CD45RO+ cells which were present in the experiments shown in Fig. 6a may have contained the significant number of transient responders seen in those experiments.
Discussion
Our results demonstrate clearly that [Ca2+]i responses differ, at the single cell level, between subsets of primary human T cells. CD4+ CD45RO+ memory T cells displayed an increased proportion of oscillating cells, a consistent trend with a decreased proportion of peak–plateau responders and a variable magnitude of response depending on their differentiation state. CD4+ T cells in long-term culture, which underwent progressive differentiation to CD45RA- CD45RO+ CD45RBdull, showed a decreasing proportion of peak–plateau and an increasing proportion of oscillating cells over their time in culture. CD8+ T cells showed a reduced proportion of peak–plateau responders, an increased proportion of transient and non-responders and a decreased magnitude of response compared with CD4+ T cells from the same donor.
The lower magnitude of [Ca2+]i response in CD4+ CD45RA+ T cells reported here appears to be due to a reduced magnitude of [Ca2+]i elevation within the responding cell population rather than an increased proportion of non-responding cells. Using the single cell approach, we have demonstrated a significantly increased proportion of oscillating cells in the CD45RO+ T cell population. These oscillations are more efficient in terms of the average [Ca2+]i required for activation, and therefore we propose that these oscillating cells are able to give rise to the enhanced functional response seen in CD45RO+ T cells despite their decreased magnitude of [Ca2+]i elevation when they differentiate. The pattern of [Ca2+]i response has been correlated with the functional outcome of a T cell in terms of proliferation and cytokine production. In particular, a sustained [Ca2+]i elevation is required for nuclear translocation of NFAT [27] and IL-2 production and proliferation [14,24]. On returning to baseline [Ca2+]i, NFAT rapidly relocalizes to the cytoplasm resulting in cessation of IL-2 transcription [27]. Therefore, a peak–plateau response, which gives rise to a sustained elevation in [Ca2+]i, would be expected to drive nuclear translocation of NFAT and subsequent IL-2 transcription and cellular proliferation. The proportion of T cells giving this [Ca2+]i pattern of response (peak–plateau) following stimulation by PHA-P is reduced in rheumatoid arthritis T cells [19] and this could underlie the functional deficiency, in terms of IL-2 production and proliferation, seen in these cells. In support of this, T cells from the rheumatoid arthritis joint, which show the greatest functional deficiencies, also show a greater reduction in the proportion of peak–plateau responders [19].
While we have used CD45 isoform expression as a marker of broad-ranging differentiation changes in T cells, a direct effect of the CD45 expression on signalling and thus cytokine production could result from differences in the function of the CD45 phosphatase isoforms [28]. CD4+ CD45RO+ T cells have a wide range of expression levels of CD45RB depending upon the stage of differentiation of the T cell [21]. In contrast, CD45RA+ T cells are all CD45RBbright. Using cultured T cells, which have undergone multiple rounds of stimulation and have therefore become progressively more differentiated to a CD45RBdull state, we found an increasing proportion of oscillating and a decreasing proportion of peak–plateau responding cells. The increased magnitude of the calcium response in the CD45RO+ cells generated after one round of stimulation might be accounted for by an increased expression of the ICRAC channels which can be increased 10-fold in activated T cells [29], as CD45RO+ cells have some of the properties of activated cells. Calcium oscillation in T cells occur mainly as a result of variations in the calcium influx [30,31] and this, in turn, is affected by membrane potential [32] regulated by potassium channels [33] and so differential expression of these components [34] or different splice variants of calcium channel proteins [35] might also affect subset signalling responses.
In addition to differential expression of CD45RB, resting naive T cells may be less differentiated with respect to their cytokine profile [36]. As cytokines are regulated by different transcription factors, cells that secrete Th1 cytokines may display distinct [Ca2+]i response patterns compared with those that secrete Th2 cytokines. The magnitude and pattern of [Ca2+]i signalling have been shown to regulate the differential activation of distinct transcription factors in B cells [12] and there is evidence to suggest that distinct transcription factors mediate cytokine gene expression patterns in Th1 and Th2 cells [37]. The IL-4 promoter contains five sites that are critical for the inducible expression of IL-4. NFAT family proteins bind specifically to these sites and co-operate with AP-1 factors to induce IL-4 transcription. The interferon (IFN)-γ promoter, however, is less dependent on NFAT proteins but contains a regulatory region that requires NFκB binding [16]. In view of the differential activation of JNK-1, NFκB and NFAT, sustained elevations in [Ca2+]i would be expected to correlate with NFAT activation and IL-4 production while non-sustained increases may be expected to result in NFκB and JNK-1 activation and hence IFN-γ production. In support of this, T cells from Itk knock-out mice, which fail to produce a sustained elevation in [Ca2+]i and demonstrate impaired NFATc translocation, fail to establish stable IL-4 production while IFN-γ production is unaffected [38,39].
In thymocytes, the avidity of the TCR engagement can determine the type of calcium response made, but this is dependent on the maturation state of the cell; high-avidity engagement initiates oscillatory responses [40]. Similarly, in mature T cells the avidity of TCR engagement can also affect outcome. Verheugen showed, in short-term studies, an increase in oscillating cells in the first 5 days after activation and for a tendency for a higher stimulation to evoke an oscillating response [41]. High avidity can lead to Th1 differentiation and low avidity to Th2. Thus the increase in the oscillating cells that we saw between CD45RA and CD45RO may represent this differentiation into functional classes of cells. Similarly, changes in SHIP expression may alter the calcium responses in terms of oscillation or magnitude in B cells [42], but its role in this context in T cells has not been examined. Ricard suggested that T cells have at least two pools of calcium, which are involved in generating calcium spikes and oscillations [43]. Our observation of a shift in the pools with differentiation state may represent a modulation resulting in different signals at different stages of development.
CD8+ T cells showed a significant increase in the proportion of transient and non-responding cells and a decrease in the proportion of peak–plateau responders in addition to a decreased magnitude of [Ca2+]i response when compared with CD4+ T cells. This could be due to an increased threshold for activation of CD8+ T cells, which may represent an important protective physiological mechanism whereby cytotoxic T cells are less likely to undergo inappropriate activation that would result in severe damage to healthy tissues. Furthermore, a transient Ca signal may be sufficient and necessary to induce cytotoxic granule release [44], and this may explain the increased proportion of transient responders we observed in the CD8+ cell population.
The patterns of responses that we have seen in CD4+ T cells from the rheumatoid arthritis joint [19] are similar to the patterns seen in both CD4+ CD45RO+ T cells and CD4+ T cells following long-term culture, in terms of high proportions of oscillators and relatively low proportions of peak–plateau responders. However, the increased proportion of non-responders is not seen in CD45RO+ T cells and is seen only on day 42 in cultured T cells, a point at which almost all T cells failed to respond to subsequent stimulation with PHA-P. As activated T cells have an increased frequency of [Ca2+]i oscillations after TCR stimulation [32], this suggests a possible explanation for the increase in frequency of [Ca2+]i oscillations in the CD4+ CD45RO+population. Furthermore, the presence of regulatory cells within this population is quite likely and, given the dependence of the function of the forkhead box p3 on its interaction with calcium regulated NFAT proteins [45], the calcium oscillations may be important in regulating the function or dysfunction of this important subset of cells.
A recent phenotypic and cytokine analysis of CD4+ human T cells suggests that at least six subsets of cells exist [22]. Some of these failed to proliferate in response to PHA; these were probably effector cells and may correspond to the large number of cells which failed to give a calcium signal in the terminally differentiated cells which we produced. These were predominantly IFN-γ-secreting cells [22], and given the apparent lack of Ca-dependence of the IFN-γ promoter with its complete lack of NFAT sites adds support to the suggestion that these cells may correspond. Other cells expressed only IL-2, and these could correspond to our calcium oscillators or peak–plateau responders, although the oscillators were seen more in the differentiated cells which may secrete less IL-2, but could represent Th2 cells which may be more Ca2+-dependent because of the NFAT dependence of the IL-2 promoter. CD45RA has been associated with naive T cells and so one might expect signalling responses of such cells to be less complex. Indeed, we have seen here that the predominant response of these cells is a peak–plateau pattern. However, CD45 subsets may encompass a memory cell population that has ‘reverted’ to CD45RA+ and may represent a subset of central memory cells [46,47]. At least some CD45RA+ cells also fail to proliferate in response to PHA [22] but secrete predominantly IFN-γ, again suggesting these are functionally differentiated effector cells. Thus the phenotypic marker description of T cells may disguise another level of functional complexity which may be better represented by their calcium signalling responses.
Using single cell imaging and spectrofluorimetry, we have described differences in the [Ca2+]i responses in a wide range of freshly isolated and in vitro-derived T cell subsets. Given the importance of calcium in regulating T cell gene expression, we propose that these differences may underlie the functional variation seen in these cells.
Acknowledgments
This study was supported by a Wellcome Trust PhD studentship, the Arthritis Research Campaign and the Birmingham Arthritis Appeals Trust.
References
- 1.Robinson AT, Miller N, Alexander DR. CD3 antigen-mediated calcium signals and protein kinase C activation are higher in CD45R0+ than in CD45RA+ human T lymphocyte subsets. Eur J Immunol. 1993;23:61–8. doi: 10.1002/eji.1830230111. [DOI] [PubMed] [Google Scholar]
- 2.Young JL, Ramage JM, Gaston JS, Beverley PC. In vitro responses of human CD45R0brightRA– and CD45R0–RAbright T cell subsets and their relationship to memory and naive T cells. Eur J Immunol. 1997;27:2383–90. doi: 10.1002/eji.1830270937. [DOI] [PubMed] [Google Scholar]
- 3.Gray D. Immunological memory. Ann Rev Immunol. 1993;11:49–77. doi: 10.1146/annurev.iy.11.040193.000405. [DOI] [PubMed] [Google Scholar]
- 4.Sanders ME, Makgoba MW, June CH, Young HA, Shaw S. Enhanced responsiveness of human memory T cells to CD2 and CD3 receptor-mediated activation. Eur J Immunol. 1989;19:803–8. doi: 10.1002/eji.1830190504. [DOI] [PubMed] [Google Scholar]
- 5.Merkenschlager M, Terry L, Edwards R, Beverley PC. Limiting dilution analysis of proliferative responses in human lymphocyte populations defined by the monoclonal antibody UCHL1: implications for differential CD45 expression in T cell memory formation. Eur J Immunol. 1988;18:1653–61. doi: 10.1002/eji.1830181102. [DOI] [PubMed] [Google Scholar]
- 6.Salmon M, Kitas GD, Bacon PA. Production of lymphokine messenger-RNA by CD45R+ and CD45R– helper T-cells from human peripheral-blood and by human CD4+ T-cell clones. J Immunol. 1989;143:907–12. [PubMed] [Google Scholar]
- 7.Lee CL, Lee SH, Jay FT, Rozee KR. Immunobiological study of interferon-gamma-producing cells after staphylococcal enterotoxin B stimulation. Immunol. 1990;70:94–9. [PMC free article] [PubMed] [Google Scholar]
- 8.Bottomly K, Luqman M, Greenbaum L, et al. A monoclonal antibody to murine CD45R distinguishes CD4 T cell populations that produce different cytokines. Eur J Immunol. 1989;19:617–23. doi: 10.1002/eji.1830190407. [DOI] [PubMed] [Google Scholar]
- 9.Hall SR, Heffernan BM, Thompson NT, Rowan WC. CD4+ CD45RA+ and CD4+ CD45RO+ T cells differ in their TCR-associated signaling responses. Eur J Immunol. 1999;29:2098–106. doi: 10.1002/(SICI)1521-4141(199907)29:07<2098::AID-IMMU2098>3.0.CO;2-B. [DOI] [PubMed] [Google Scholar]
- 10.Feske S, Giltnane J, Dolmetsch R, Staudt LM, Rao A. Gene regulation mediated by calcium signals in T lymphocytes. Nat Immunol. 2001;2:316–24. doi: 10.1038/86318. [DOI] [PubMed] [Google Scholar]
- 11.Gallo EM, Cante-Barrett K, Crabtree GR. Lymphocyte calcium signaling from membrane to nucleus. Nat Immunol. 2006;7:25–32. doi: 10.1038/ni1295. [DOI] [PubMed] [Google Scholar]
- 12.Dolmetsch RE, Lewis RS, Goodnow CC, Healy JI. Differential activation of transcription factors induced by Ca2+ response amplitude and duration. Nature. 1997;386:855–8. doi: 10.1038/386855a0. [DOI] [PubMed] [Google Scholar]
- 13.Healy JI, Dolmetsch RE, Timmerman LA, et al. Different nuclear signals are activated by the B cell receptor during positive versus negative signaling. Immunity. 1997;6:419–28. doi: 10.1016/s1074-7613(00)80285-x. [DOI] [PubMed] [Google Scholar]
- 14.Wacholtz MC, Lipsky PE. Anti-CD3-stimulated Ca2+ signal in individual human peripheral T-cells − activation correlates with a sustained increase in intracellular Ca2+ J Immunol. 1993;150:5338–49. [PubMed] [Google Scholar]
- 15.Lewis RS. Calcium oscillations in T-cells: mechanisms and consequences for gene expression. Biochem Soc Trans. 2003;31:925–9. doi: 10.1042/bst0310925. [DOI] [PubMed] [Google Scholar]
- 16.Rengarajan J, Szabo SJ, Glimcher LH. Transcriptional regulation of Th1/Th2 polarization. Immunol Today. 2000;21:479–83. doi: 10.1016/s0167-5699(00)01712-6. [DOI] [PubMed] [Google Scholar]
- 17.Allen ME, Young SP, Michell RH, Bacon PA. Altered T lymphocyte signaling in rheumatoid-arthritis. Eur J Immunol. 1995;25:1547–54. doi: 10.1002/eji.1830250612. [DOI] [PubMed] [Google Scholar]
- 18.Carruthers DM, Naylor WG, Allen ME, Kitas GD, Bacon PA, Young SP. Characterization of altered calcium signalling in T lymphocytes from patients with rheumatoid arthritis (RA) Clin Exp Immunol. 1996;105:291–6. doi: 10.1046/j.1365-2249.1996.d01-768.x. [DOI] [PMC free article] [PubMed] [Google Scholar]
- 19.Carruthers DM, Arrol HP, Bacon PA, Young SP. Dysregulated intracellular calcium stores and calcium signaling in synovial fluid T lymphocytes from patients with chronic inflammatory arthritis. Arthritis Rheum. 2000;43:1257–65. doi: 10.1002/1529-0131(200006)43:6<1257::AID-ANR8>3.0.CO;2-Q. [DOI] [PubMed] [Google Scholar]
- 20.Matthews N, Emery P, Pilling D, Akbar A, Salmon M. Subpopulations of primed T helper cells in rheumatoid arthritis. Arthritis Rheum. 1993;36:603–7. doi: 10.1002/art.1780360505. [DOI] [PubMed] [Google Scholar]
- 21.Salmon M, Pilling D, Borthwick NJ, et al. The progressive differentiation of primed T-cells is associated with an increasing susceptibility to apoptosis. Eur J Immunol. 1994;24:892–9. doi: 10.1002/eji.1830240417. [DOI] [PubMed] [Google Scholar]
- 22.Amyes E, McMichael AJ, Callan MFC. Human CD4+ T cells are predominantly distributed among six phenotypically and functionally distinct subsets. J Immunol. 2005;175:5765–73. doi: 10.4049/jimmunol.175.9.5765. [DOI] [PubMed] [Google Scholar]
- 23.Payne SJ, Arrol HP, Hunt SV, Young SP. Automated classification and analysis of the calcium response of single T lymphocytes using a neural network approach. IEEE Trans Neural Net. 2005;16:949–58. doi: 10.1109/TNN.2005.849820. [DOI] [PubMed] [Google Scholar]
- 24.Wulfing C, Rabinowitz JD, Beeson C, Sjaastad MD, McConnell HM, Davis MM. Kinetics and extent of T cell activation as measured with the calcium signal. J Exp Med. 1997;185:1815–25. doi: 10.1084/jem.185.10.1815. [DOI] [PMC free article] [PubMed] [Google Scholar]
- 25.Rabinovitch PS, June CH, Grossman A, Ledbetter JA. Heterogeneity among T cells in intracellular free calcium responses after mitogen stimulation with PHA or anti-CD3. Simultaneous use of indo-1 and immunofluorescence with flow cytometry. J Immunol. 1986;137:952–61. [PubMed] [Google Scholar]
- 26.Akbar AN, Savill J, Gombert W, et al. The specific recognition by macrophages of CD8(+), CD45RO(+) T-cells undergoing apoptosis − a mechanism for T-cell clearance during resolution of viral-infections. J Exp Med. 1994;180:1943–7. doi: 10.1084/jem.180.5.1943. [DOI] [PMC free article] [PubMed] [Google Scholar]
- 27.Timmerman LA, Clipstone NA, Ho SN, Northrop JP, Crabtree GR. Rapid shuttling of NF-AT in discrimination of Ca2+ signals and immunosuppression. Nature. 1996;383:837–40. doi: 10.1038/383837a0. [DOI] [PubMed] [Google Scholar]
- 28.Dornan S, Sebestyen Z, Gamble J, et al. Differential association of CD45 isoforms with CD4 and CD8 regulates the actions of specific pools of p56lck tyrosine kinase in T cell antigen receptor signal transduction. J Biol Chem. 2002;277:1912–18. doi: 10.1074/jbc.M108386200. [DOI] [PubMed] [Google Scholar]
- 29.Fomina AF, Fanger CM, Kozak JA, Cahalan MD. Single channel properties and regulated expression of Ca(2+) release-activated Ca(2+) (CRAC) channels in human T cells. J Cell Biol. 2000;150:1435–44. doi: 10.1083/jcb.150.6.1435. [DOI] [PMC free article] [PubMed] [Google Scholar]
- 30.Donnadieu E, Bismuth G, Trautmann A. Calcium fluxes in T lymphocytes. J Biol Chem. 1992;267:25864–72. [PubMed] [Google Scholar]
- 31.Dolmetsch RE, Lewis RS. Signaling between intracellular Ca2+ stores and depletion-activated Ca2+ channels generates [Ca2+] (i) oscillations in T-lymphocytes. J Gen Physiol. 1994;103:365–88. doi: 10.1085/jgp.103.3.365. [DOI] [PMC free article] [PubMed] [Google Scholar]
- 32.Hess SD, Oortgiesen M, Cahalan MD. Calcium oscillations in human T and natural killer cells depend upon membrane potential and calcium influx. J Immunol. 1993;150:2620–33. [PubMed] [Google Scholar]
- 33.Verheugen JAH, Vijverberg HPM. Intracellular Ca2+ oscillations and membrane potential fluctuations in intact human T lymphocytes: role of K+ channels in Ca2+ signaling. Cell Calcium. 1995;17:287–300. doi: 10.1016/0143-4160(95)90075-6. [DOI] [PubMed] [Google Scholar]
- 34.Feske S, Prakriya M, Rao A, Lewis RS. A severe defect in CRAC Ca2+ channel activation and altered K+ channel gating in T cells from immunodeficient patients. J Exp Med. 2005;202:651–62. doi: 10.1084/jem.20050687. [DOI] [PMC free article] [PubMed] [Google Scholar]
- 35.Kotturi MF, Jefferies WA. Molecular characterization of 1-type calcium channel splice variants expressed in human T lymphocytes. Molec Immunol. 2005;42:1461–74. doi: 10.1016/j.molimm.2005.01.014. [DOI] [PubMed] [Google Scholar]
- 36.Mosmann TR, Coffman RL. Heterogeneity of cytokine secretion patterns and functions of helper T cells. Adv Immunol. 1989;46:111–47. doi: 10.1016/s0065-2776(08)60652-5. [DOI] [PubMed] [Google Scholar]
- 37.Rincon M, Flavell RA. T-cell subsets: transcriptional control in the Th1/Th2 decision. Curr Biol. 1997;7:R729–R732. doi: 10.1016/s0960-9822(06)00368-x. [DOI] [PubMed] [Google Scholar]
- 38.Fowell DJ, Shinkai K, Liao XC, et al. Impaired NFATc translocation and failure of Th2 development in Itk-deficient CD4+ T cells. Immunity. 1999;11:399–409. doi: 10.1016/s1074-7613(00)80115-6. [DOI] [PubMed] [Google Scholar]
- 39.Liu KQ, Bunnell SC, Gurniak CB, Berg LJ. T cell receptor-initiated calcium release is uncoupled from capacitative calcium entry in Itk-deficient T cells. J Exp Med. 1998;187:1721–7. doi: 10.1084/jem.187.10.1721. [DOI] [PMC free article] [PubMed] [Google Scholar]
- 40.Freedman BD, Liu QH, Somersan S, Kotlikoff MI, Punt JA. Receptor avidity and costimulation specify the intracellular Ca2+ signaling pattern in CD4+CD8+ thymocytes. J Exp Med. 1999;190:943–52. doi: 10.1084/jem.190.7.943. [DOI] [PMC free article] [PubMed] [Google Scholar]
- 41.Verheugen JAH, Le Deist F, Devignot V, Korn H. Enhancement of calcium signaling and proliferation responses in activated human T lymphocytes. Inhibitory effects of K+ channel block by charybdotoxin depend on the T cell activation state. Cell Calcium. 1997;21:1–17. doi: 10.1016/s0143-4160(97)90092-0. [DOI] [PubMed] [Google Scholar]
- 42.Hashimoto A, Hirose K, Okada H, Kurosaki T, Iino M. Inhibitory modulation of B cell receptor-mediated Ca2+ mobilization by Src homology 2 domain-containing inositol 5′-phosphatase (SHIP) J Biol Chem. 1999;274:11203–8. doi: 10.1074/jbc.274.16.11203. [DOI] [PubMed] [Google Scholar]
- 43.Ricard I, Martel J, Dupuis L, Dupuis G, Payet MD. A caffeine/ryanodine-sensitive Ca2+ pool is involved in triggering spontaneous variations of Ca2+ in Jurkat T lymphocytes by Ca2+-induced Ca2+ release (CICR) mechanism. Cell Signal. 1997;9:197–206. doi: 10.1016/s0898-6568(96)00141-6. [DOI] [PubMed] [Google Scholar]
- 44.Lyubchenko TA, Wurth GA, Zweifach A. Role of calcium influx in cytotoxic T lymphocyte lytic granule exocytosis during target cell killing. Immunity. 2001;15:847–59. doi: 10.1016/s1074-7613(01)00233-3. [DOI] [PubMed] [Google Scholar]
- 45.Wu Y, Borde M, Heissmeyer V, et al. FOXP3 controls regulatory T cell function through cooperation with NFAT. Cell. 2006;126:375–87. doi: 10.1016/j.cell.2006.05.042. [DOI] [PubMed] [Google Scholar]
- 46.Richards D, Chapman MD, Sasama J, Lee TH, Kemeny DM. Immune memory in CD4+ CD45RA+ T cells. Immunol. 1997;91:331–9. doi: 10.1046/j.1365-2567.1997.00274.x. [DOI] [PMC free article] [PubMed] [Google Scholar]
- 47.Faint JM, Annels NE, Curnow SJ, et al. Memory T cells constitute a subset of the human CD8+CD45RA+ pool with distinct phenotypic and migratory characteristics. J Immunol. 2001;167:212–20. doi: 10.4049/jimmunol.167.1.212. [DOI] [PubMed] [Google Scholar]