

Abstract
AIMS
The aim of this study was to explore and optimize the in vitro and in silico approaches used for predicting clinical DDIs. A data set containing clinical information on the interaction of 20 Pfizer compounds with ketoconazole was used to assess the success of the techniques.
METHODS
The study calculated the fraction and the rate of metabolism of 20 Pfizer compounds via each cytochrome P450. Two approaches were used to determine fraction metabolized (fm); 1) by measuring substrate loss in human liver microsomes (HLM) in the presence and absence of specific chemical inhibitors and 2) by measuring substrate loss in individual cDNA expressed P450s (also referred to as recombinant P450s (rhCYP)) The fractions metabolized via each CYP were used to predict the drug–drug interaction due to CYP3A4 inhibition by ketoconazole using the modelling and simulation software SIMCYP®.
RESULTS
When in vitro data were generated using Gentest supersomes, 85% of predictions were within two-fold of the observed clinical interaction. Using PanVera baculosomes, 70% of predictions were predicted within two-fold. In contrast using chemical inhibitors the accuracy was lower, predicting only 37% of compounds within two-fold of the clinical value. Poorly predicted compounds were found to either be metabolically stable and/or have high microsomal protein binding. The use of equilibrium dialysis to generate accurate protein binding measurements was especially important for highly bound drugs.
CONCLUSIONS
The current study demonstrated that the use of rhCYPs with SIMCYP® provides a robust in vitro system for predicting the likelihood and magnitude of changes in clinical exposure of compounds as a consequence of CYP3A4 inhibition by a concomitantly administered drug.
WHAT IS ALREADY KNOWN ABOUT THIS SUBJECT
Numerous retrospective analyses have shown the utility of in vitro systems for predicting potential drug–drug interactions (DDIs).
Prediction of DDIs from in vitro data is commonly obtained using estimates of enzyme Ki, inhibitor and substrate concentrations and absorption rate for substrate and inhibitor.
WHAT THIS STUDY ADDS
Using a generic approach for all test compounds, the findings from the current study showed the use of recombinant P450s provide a more robust in vitro measure of P450 contribution (fraction metabolized, fm) than that achieved when using chemical inhibitors in combination with human liver microsomes, for the prediction of potential CYP3A4 drug–drug interactions prior to clinical investigation.
The current study supported the use of SIMCYP®, a modelling and simulation software in utilizing the in vitro measures in the prediction of potential drug–drug interactions.
Keywords: cytochrome P450, drug-drug interactions, baculosomes, supersomes, CYP3A4, ketoconazole
Introduction
Drug discovery and development is an expensive process with a high attrition rate, factors that the pharmaceutical industry continually strives to improve. There are a number of reasons for such attrition including poor efficacy, insufficient risk : benefit ratio and safety issues arising either as a result of animal toxicity testing or in the clinical programme itself [1]. Inappropriate pharmacokinetics of the compound under investigation, either when administered alone or in the presence of other medications, can also result in the discontinuation of clinical development programmes. Consequently in vitro approaches are increasingly employed early in discovery to identify compounds likely to present challenges with respect to drug–drug interactions (DDIs) in drug development [2–4].
In vitro assessment of the metabolic fate of new compounds by each of the major CYPs is routinely carried out to determine the relative contributions played by enzymes in the metabolism of new compounds (cytochrome P450 reaction phenotyping). Generally two in vitro approaches are used for this assessment. Firstly, the commonly used approach measuring substrate depletion, and secondly, a more informative but lengthier approach, assessing rate of metabolite formation. Determining P450 contribution is not only useful in the prediction of potential DDIs but also highlights potential for metabolic contribution from polymorphically expressed CYP, a factor leading to large interindividual variability in the clinical setting and a complication to dose estimation for the individual [5]. In addition, the likelihood of DDIs increases when a compound has a high affinity for a single metabolizing enzyme compared with a compound with affinity for a number of different enzymes.
Combining in vitro metabolism data together with appropriate modelling and simulation tools should increase the confidence in prediction of the in vivo profile of a compound. One such program is SIMCYP® (http://www.SIMCYP.com). Using data generated from human in vitro experiments, SIMCYP® can predict clearance (CL) for compounds which are primarily metabolized by cytochromes P450 and the magnitude of any DDIs that may arise from co-administration with other drugs (as reviewed in [6]). It can been utilized not only to simulate results from clinical studies where the clearance and effects of other compounds are known, but also to predict these values at an earlier stage when clinical data are not available. In addition the software can be used to optimize the design of a clinical trial to ensure that any interaction is appropriately measured. SIMCYP® software enables known physiological covariates such as age, height, weight and sex, together with variability in CYP expression to generate distributions of pharmacokinetic data representing patient or healthy volunteer populations. One of the most commonly studied drug interaction in clinical development is that with the potent CYP3A4 inhibitor ketoconazole. Pfizer has generated ketoconazole interaction studies on 20 of its own development compounds in the past few years. This presents an ideal data set for comparing the success of in vitro and SIMCYP® for predicting clinical DDIs with data that can be generated preclinically. SIMCYP® contains models of a number of established CYP substrates and inhibitors for which extensive clinical data are available, including ketoconazole [7].
This current study made use of the extensive data base of clinical ketoconazole drug interaction studies with substrates of CYP3A4. Using SIMCYP® the magnitude of ketoconazole interactions was predicted from in vitro data collected using liver microsomes and different sources of rhCYPs in an attempt to identify which approach gave the most reliable prediction of the clinical DDI and to optimize the procedure.
Methods
Materials
Phosphate buffer, NADP, DL-isocitric acid, isocitric dehydrogenase, quinidine and DMSO were obtained from Sigma-Aldrich Company Ltd. Magnesium chloride was purchased from BDH (Poole, UK), organic solvents were obtained from Romil Ltd. (Cambridge, UK). Furafylline, sulphaphenazole, benzylnirvarnol, ketoconazole and midazolam were synthesized in house at Pfizer. Pooled human liver microsomes (HLMix-101) were obtained from BD-Gentest, Inc. (Woburn, MA). Two sources of recombinant cytochrome 450 enzymes (rhCYP1A2, 2C9, 2C19, 2D6, 3A4, and control) were used; BD Gentest® Supersomes (Oxford, UK) and PanVera Corp baculosomes (Madison, WI). For details on each rhCYP see enzymes source data in Tables 1 and 2.
Table 1.
Summary data for rhCYPs purchased from PanVera®
| rhCYP 1A2 | rhCYP 2C9 | rhCYP 2C19 | rhCYP 2D6 | rhCYP 3A4 | rhCYP control | HL-MIX-101 | |
|---|---|---|---|---|---|---|---|
| Lot number | 30248A | 29897A | 29896A | 21248 | 29736A | 29870A | 1 |
| Specific activity (pmol mg−1) | 105 | 244 | 113 | 118 | 133 | 330 | |
| Protein content (mg ml−1) | 10.4 | 4.5 | 9.8 | 8.5 | 8.3 | 10 | 20.4 |
| CYP content (pmol ml−1) | 1092 | 1098 | 1107.4 | 1003 | 1103.9 | 6732 | |
| Vmax RAF | 0.514 | 1.593 | 0.376 | 0.479 | 0.277 | ||
| CLint RAF | 0.319 | 0.900 | 0.292 | 0.138 | 0.146 |
Table 2.
Summary data for rhCYPs purchased from BD Gentest®
| rhCYP 1A2 | rhCYP 2C9 | rhCYP 2C19 | rhCYP 2D6 | rhCYP 3A4 | rhCYP control | HL-MIX-101 | |
|---|---|---|---|---|---|---|---|
| Lot number | 18 682 | 21 | 21 | 22 362 | 24 175 | 13 | 1 |
| Specific activity (pmol mg−1) | 200 | 571 | 217.4 | 129.8 | 244 | 330 | |
| Protein content (mg ml−1) | 5 | 3.5 | 4.6 | 7.7 | 4.1 | 5 | 20.4 |
| CYP content (pmol ml−1) | 1 000 | 2000 | 1000 | 1 000 | 1 000 | 6732 | |
| Vmax RAF* | 0.571 | 1.705 | 0.569 | 1.069 | 0.223 | ||
| CLint RAF | na | na | na | na | na |
Values determined using velocity data reported in suppliers data sheets. na, not available.
Choice of test compounds
The compounds studied included eletriptan, tolteradine, celecoxib, alprazolam, triazolam, conivaptin, eplerenone, lasofoxifene, tirilazed, ziprasidone, dofetilide, and PF-A –PF-I. Test compounds were chosen based upon available clinical DDI data with ketoconazole, from studies performed within Pfizer in young healthy volunteers. Full details of the clinical designs are out of the scope of this manuscript however, each trial was a cross-over design which gave pharmacokinetics of each Pfizer compound in each individual in the presence or absence of ketoconazole. Ketoconazole produced increases in the exposure of the Pfizer compound ranging from 1.1 to 12.7 fold based upon area under the curve from time zero to infinity, AUC(0,∞).
Incubation process
Stock solutions of test compounds were prepared at 30 mm in DMSO, diluted to 2 mm in methanol and finally 83 μm in water. Incubation mix was prepared using (values in parenthesis represent final concentrations); potassium phosphate buffer (50 mm), magnesium chloride (5 mm), isocitric acid (5 mm), isocitric acid dehydrogenase (1 U ml−1) and water. An appropriate volume of HLMix-101 or rhCYPs (PanVera or Gentest) was then added to this incubation mix, giving a final protein concentration with HLMix-101 of 1.5 mg ml−1 (0.5 μm total cytochrome P450), or 150 pmol ml−1 with rhCYPs. The final protein content of rhCYP incubations was also adjusted to 1.5 mg ml−1 using control baculosomes/supersomes (depending on rhCYPs system being studied).
For chemical inhibition studies furafylline (CYP1A2 inhibitor), sulphaphenazole (CYP2C9 inhibitor), benzylnirvarnol (CYP2C19 inhibitor), quinidine (CYP2D6 inhibitor) and ketoconazole (CYP3A4 inhibitor), were prepared water : methanol (1 : 1 v : v) and added to HLMix-101 to give final concentrations of 10, 10, 3, 1 and 1 μm, respectively. Application of the inhibitors at these concentrations have been shown to be inhibit a single P450 [7] and not multiple P450s as is the case for ketoconazole if used at higher concentrations [8, 9].
Samples were allowed to equilibrate to 37°C, from which aliquots were taken for the no drug and no cofactor control samples Freshly prepared 20 mm NADP (55 μl) was then added to incubation mixes, followed by the addition of 15 μl drug (final concentration 1 μm) to initiate the reaction. Aliquots (75 μl) of the incubation mix were then removed at 3, 6, 10, 20, 40, and 60 min and added to 100 μl ice-cold acetonitrile quench solution (internal standard, 0.2 μg ml−1 midazolam) to terminate the reaction. No cofactor and no drug controls were also terminated at 60 min. Samples were then centrifuged at 1500 g for 45 min at 4°C, and samples analyzed by LC-MS/MS (see Analytical procedure). All compounds were studied in triplicate, performed over 3 separate days to account for interday variability.
Protein binding measurements
Ultra filtration
In brief HLMix-101 was added to incubation mix (1.5 mg ml−1) as described previously, and left at room temperature overnight to ensure loss in microsome viability. Test compounds were then spiked into the incubation mix (final concentration 1 μm). An aliquot (400 μl) of this was added to an ultrafiltration plate (Millipore, UK) and centrifuged at 2000 g for 50 min at 37°C. Filtrate (50 μl) was taken from the bottom of the ultrafiltration plate, and added into a 96-well block containing acetonitrile. Samples were then analyzed by LC-MS/MS (see Analytical procedure) and concentrations determined from a calibration curve.
Equilibrium dialysis
Test compounds were spiked into incubation mixture to give a known concentration (typically 500 ng ml−1)). The incubation mixture (150 μl) containing drug was then placed in a chamber (half-cell) of a 96 well equilibrium dialysis block, separated by a semipermeable membrane from microsomal buffer (150 μl). The system was incubated at 37°C in a vibrating water bath for 4 h to allow equilibration. At the end of the incubation period samples from the incubation mixture and microsomal buffer side were collected and analyzed by LC-MS/MS (see Analytical procedure) and concentrations determined from a calibration curve.
Analytical procedure
Measurement of substrate depletion was performed by LC-MS/MS using a Sciex API2000 (Agilent, Hertfordshire, UK), operating in positive ion mode, in conjunction with an Agilent 1100 LC binary pump (Cheshire, UK). Samples (80 μl), were injected onto a C18 Opti-lynx column (2.1 × 15 mm), peaks were separated by reversed phase chromatography (0–10 s 100% A 0% B, 11–50 s 0% A 100% B, 51–60 s 100% A, 0% B) using the following mobile phases; (A) MeOH/CAN : H2O (10 : 90) containing 2 mm ammonium acetate and 0.025% formic acid (v : v) (B) MeOH/CAN : H2O (90 : 10): containing 2 mm ammonium acetate and 0.025% formic acid (v : v), at a flow rate of 3 ml min−1, split 1 : 5. Test compounds were quantified by comparison of the ratio of the peak area of the compound with that of an internal standard at each time point in the incubation process.
Intrinsic clearance determinations
Chemical inhibition
The kinetic data were analyzed using a linear fit of the natural logarithm of the ratio of the compound peak area to the internal standard peak area against time and the disappearance rate constant (k) determined from the gradient of this line. These rate constants determined in the presence (k(I)) and absence (k) of chemical inhibitor were used to calculate the percentage of contribution of each CYP enzyme to the in vitro metabolism of test compound using Equation 1.
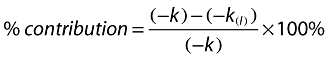 |
(1) |
Intrinsic clearances (CLint app) of the uninhibited reactions were determined as shown below, from which the CLint app for each CYP were calculated based upon the percentages determined using Equation 1.
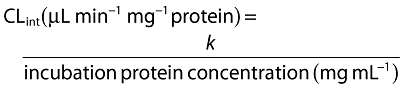 |
(2) |
Recombinant cytochrome P450s
Intrinsic clearances were predicted from incubations with rhCYP using Equation 3.
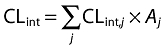 |
(3) |
where CLint,j represents the intrinsic clearance (CLint) from a single CYP enzyme and Aj the abundance of that enzyme in human liver.
However, the CLint per unit amount of CYP (intrinsic activity or turnover number) varies between liver microsomes and rhCYP enzymes and has been attributed to differences in the concentrations of accessory proteins and the lipid microenvironment of the enzyme [10–12]. This discrepancy was overcome by using relative activity factors (RAF). The RAF defines the amount of rhCYP required to give an equivalent reaction velocity to that of the particular liver microsome sample used (Equation 4) [13].
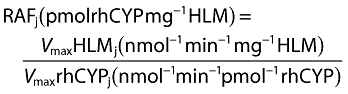 |
(4) |
However this approach does not address interindividual variability in CYP expression nor the apparent substrate specificity of RAFs. This may be overcome through the use of intersystem extrapolation factors (ISEFs) which compare the intrinsic activities of rhCYP vs. liver microsomes and provide CYP abundance scaling by mathematical means. This employs the RAF approach and adjusts for the actual amount of liver microsomes CYP present (measured by immunochemistry) rather than a theoretical amount (Equation 5).
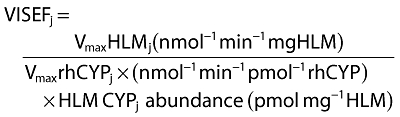 |
(5) |
Although correction for relative activity factors based upon Vmax values have been used in equations 2 and 3, CLint values can also be used (Equation 6) [13].
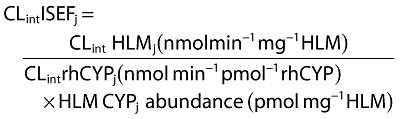 |
(6) |
ISEF values (CLint and Vmax) have previously been determined in house for PanVera baculosomes and were applied in these studies. In house information was not available for Gentest supersomes. Consequently, the Vmax values provided by the vendor were used to generate the relevant ISEF value. However as no Km values for probe substrates were provided, a CLint ISEF value could not be calculated and thus not applied to this series of experiments.
Drug–drug interaction predictions
Modelling and simulation using SIMCYP®
For both chemical inhibition and rhCYP studies, apparent CLint values determined in vitro were inputted into SIMCYP®, together with in vitro measures of fraction unbound in both microsomes and plasma, fumicrosomes, fuplasma, and any information on alternative non-P450 routes of clearance (for example Phase II metabolism or renal clearance) (Table 3). SIMCYP® then predicted the magnitude of the drug interaction in the presence of ketoconazole using the Rowland-Matin equation [14] described below (Equation 7):
Table 3.
Inputs used within SIMCYP to predict the DDIs for 20 victim compounds when co-administered with the CYP3A4 inhibitor ketoconazole, under steady state conditions
| Pharmacokinetic inputs | In vitro measurements | Clinical information | ||||||||
|---|---|---|---|---|---|---|---|---|---|---|
| Compound | MW | fuplasma | fumic | Renal clearance (l h−1) | B : P ratio* | Intrinsic clearance (μl min−1 mg−1) | fm CYP | Dose | Ketoconazole | |
| 1.eletriptan | 383 | 0.240 | 0.99 | – | 2.42 | 16.0 | 1A2 2C9 2C19 2D6 3A4 | 0.00 0.00 0.89 9.17 89.94 | 80 mg qd | 400 mg qd × 4 days |
| 2.tolteradine | 326 | 0.037 | 0.65 | Low | 1.61 | 77.5 | 1A2 2C9 2C19 2D6 3A4 | 0.00 0.00 5.13 66.71 28.15 | 2 mg qd | 400 mg qd × 4 days |
| 3.celecoxib | 391 | 0.030 | 0.09 | – | – | 223.2 | 1A2 2C9 2C19 2D6 3A4 | 1.56 88.90 1.45 5.06 3.03 | 200 mg qd | 200 mg bd × 7 days |
| 4.alprazolam | 309 | 0.290 | 0.48 | – | 1.06 | <9 | 1A2 2C9 2C19 2D6 3A4 | 0.00 0.00 0.00 0.00 100.00 | 1 mg qd | 200 mg bd × 7 days |
| 5.triazolam | 343 | 0.100 | 0.66 | Low | 0.65 | 37.8 | 1A2 2C9 2C19 2D6 3A4 | 0.00 0.00 0.00 0.00 100.00 | 0.25 mg qd | 200 mg bd × 7 days |
| 6.conivaptin | 499 | 0.050 | 0.14 | – | – | 119.7 | 1A2 2C9 2C19 2D6 3A4 | 0.00 0.00 0.00 0.00 100.00 | 10 mg qd | 200 mg bd × 7 days |
| 7.eplerenone | 415 | 0.600 | 0.92 | Low | – | <9 | 1A2 2C9 2C19 2D6 3A4 | 0.00 0.00 0.00 0.00 100.00 | 100 mg qd | 200 mg bd × 7 days |
| 8.lasofoxifene | 414 | 0.001 | 0.05 | Low | – | 77.0 | 1A2 2C9 2C19 2D6 3A4 | 0.00 0.00 0.00 8.19 91.81 | 0.25 mg qd | 400 mg qd × 20 days |
| 9.tirilazed | 624 | 0.006 | 0.01 | Low | – | 1264.4 | 1A2 2C9 2C19 2D6 3A4 | 0.00 0.00 0.00 0.12 99.88 | 100 mg qd | 200 mg bd × 7 days |
| 10.ziprasidone | 413 | 0.010 | 0.08 | Low | 0.74 | 256.7 | 1A2 2C9 2C19 2D6 3A4 | 0.00 5.87 0.21 0.25 93.68 | 40 mg qd | 200 mg qd 1 day then 400 mg qd × 4 days |
| 11.dofetilide | 442 | 0.360 | 0.52 | 14.6 | 0.62 | <9 | 1A2 2C9 2C19 2D6 3A4 | 0.00 0.00 0.00 0.00 100.00 | 0.5 mg qd | 400 mg qd × 7 days |
| 12.PF-A | 408 | 0.002 | 0.06 | – | – | 733.3 | 1A2 2C9 2C19 2D6 3A4 | 5.96 28.52 14.78 0.00 50.74 | 0.6 mg qd | 200 mg bd × 7 days |
| 13.PF-B | 506 | 0.420 | 0.62 | – | – | 39.6 | 1A2 2C9 2C19 2D6 3A4 | 0.000 0.000 0.000 0.000 100.00 | 3 mg bid | 200 mg bid × 8 days |
| 14.PF-C | 507 | 0.070 | 0.42 | – | – | 27.3 | 1A2 2C9 2C19 2D6 3A4 | 0.00 0.00 0.00 0.00 100.00 | 3 mg qd | 400 mg qd × 9 days |
| 15.PF-D | 583 | 0.380 | 0.64 | – | – | 38.0 | 1A2 2C9 2C19 2D6 3A4 | 0.00 0.00 1.33 0.00 98.67 | 200 mg qd | 400 mg qd × 6 days |
| 16.PF-E | 520 | 0.330 | 1.00 | LOW | 2.42 | 21.4 | 1A2 2C9 2C19 2D6 3A4 | 0.00 0.00 0.00 0.00 100.00 | 100 mg qd | 400 mg qd × 7 days |
| 17.PF-F | 274 | 0.060 | 0.30 | LOW | 2.1 | 91.7 | 1A2 2C9 2C19 2D6 3A4 | 19.03 18.35 42.99 2.08 17.54 | 30 mg qd | 400 mg qd × 4 days |
| 18.PF-G | 448 | 0.004 | 0.04 | – | – | 1343.0 | 1A2 2C9 2C19 2D6 3A4 | 0.00 1.96 1.50 3.12 93.43 | 10 mg qd | 200 mg bd × 16 days |
| 19.PF-H | 427 | 0.033 | 0.38 | LOW | – | 19.0 | 1A2 2C9 2C19 2D6 3A4 | 0.00 0.00 0.00 7.20 92.80 | 10 mg qd | 400 mg qd × 13 days |
| 20.PF-I | 396 | 0.012 | 1.00 | 0.24 | – | <9 | 1A2 2C9 2C19 2D6 3A4 | 0.00 0.00 0.00 0.00 100.00 | 100 mg qd | 400 mg qd × 5 days |
B:P values depicted by (−) indicate no in house measure was available, consequently a default value of 0.55 was used.
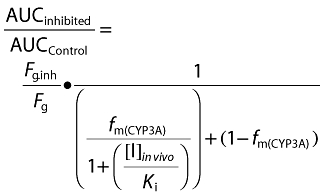 |
(7) |
where, Fg is the fraction of the drug passing through the intestinal wall unchanged, Fg.inh is the fraction of drug passing through the intestine wall in the inhibited state and fm(CYP3A) is the fraction of total clearance mediated by CYP3A4; these values were all calculated within SIMCYP®. Additional parameters used in the prediction included; [I]in vivo, the concentration of the inhibitor in vivo (estimated maximum free portal vein of the inhibitory drug during absorption), and Ki (the inhibitory potency of the inhibitor for the target enzyme). Unbound values of [I]in vivo and Ki for ketoconazole used in this study were 0.33 μm and 0.015 μm, respectively. These values were used throughout the study for modelling and simulation of DDIs using ketoconazole as the inhibitor. Predictions were made, assuming inhibitor and substrate concentrations were at steady state, no additional pharmacokinetic values such as fraction absorbed (Fa), absorption rate constant (ka) and volume of distribution (Vdss) were used.
Clinical data
Natural-log AUC(0,∞) values were analyzed using a mixed effects model. Sequence, period and treatment were considered fixed effects and subject within sequence was considered a random effect. The observed magnitude of an interaction was determined as the estimated ratio (substrate with inhibitor : substrate alone) of adjusted geometric mean AUC(0,∞) values determined from the statistical model.
Statistical analysis
Categorical analyses
The observed clinical and predicted DDI values were categorized into the following groups; ≤two- and >two-fold increase and reported in contingency tables. The two-fold reference value was chosen as it serves as the boundary between designations of moderate and weak inhibition via CYP3A4 in the FDAs guidance for drug drug interaction studies (http://www.fda.gov/cder/guidance/6695dft.htm). Categorical analysis showed the success of the prediction, i.e. if the interaction was small or large. Further comparisons were made graphically, where clinical DDI values were plotted against the predicted DDI values, to visualize the accuracy of the predictions (i.e. if they are within a ± two fold boundary). All plots included a line of equality and ± two-fold ranges.
The precision of each of the prediction methods was determined by calculating the root mean square error (RMSE) (Equation 8), lower values indicating greater precision.
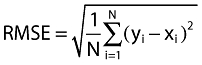 |
(8) |
where yi = predicted value, xi = observed clinical value for observations i = 1,2,3, …, N.
The subsequent bias of each prediction method was calculated as the mean error (ME) (Equation 9),
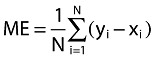 |
(9) |
where yi = predicted value, xi = observed clinical value for observations i = 1,2,3, …, N.
Systematic error increases as ME increases or decreases from zero. Negative bias indicates underestimation of the prediction whilst a positive bias indicates overestimation. To allow for the data not being normally distributed median error and median absolute error were also calculated. In the case of non-normal distribution the median will give more robust results than the RMSE and ME both of which may be inflated due to outliers.
Results
A total of 20 compounds were identified that had been investigated in clinical DDI studies with ketoconazole in young healthy volunteers. Table 3 shows the various inputs used within SIMCYP to predict in vivo DDI. Figure 1A shows the observed clinical DDI values plotted against the SIMCYP predicted DDI values for each of the four methods. Using chemical inhibitors and HLMix-101 only 16 predictions could be made, owing to the metabolic stability of the four other compounds. Of these 5/16 of the predicted values fell within two-fold of the clinical DDI. Six of the observations falling outside the two-fold boundary were over estimated, with the largest prediction having a DDI value of approximately 71 (observed value = 3.2). The two prediction methods using PanVera baculosomes both correctly predicted 12/20 compounds within two-fold of the clinical DDI (Figure 1B,C). Of the remaining eight compounds falling outside the two-fold boundary, seven were overestimated using both methods. Gentest Vmax ISEF had the highest number of predictions within the two-fold boundary (14/20 predictions, Figure 1D). The remaining six observations outside of two-fold, were found to be overestimations of the clinical DDI.
Figure 1.
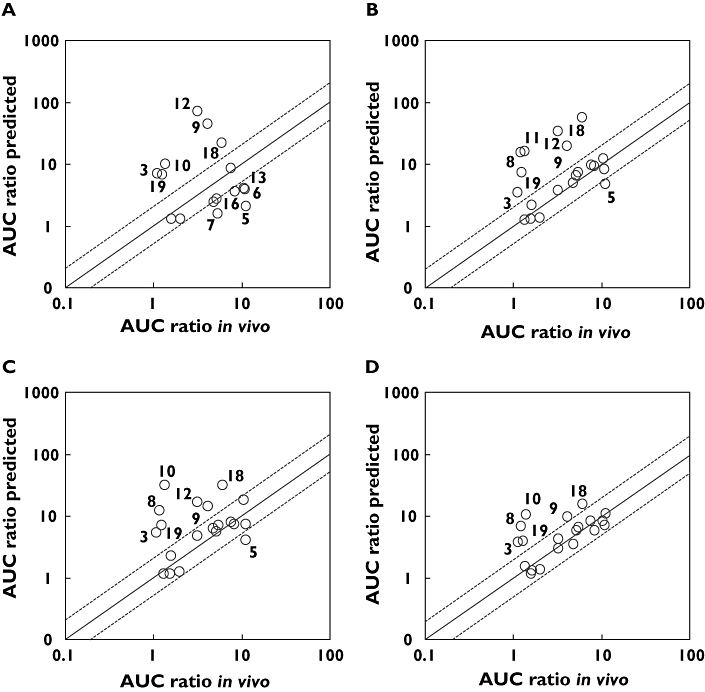
Observed and predicted AUC increases for CYP3A4 DDIs, where fumic was determined for all compounds by ultrafiltration. (A) Chemical inhibitors, (B) Panvera Vmax ISEF, (C) PanVera Clint ISEF, (D) Gentest Vmax ISEF. Solid line represents line of unity, and dashed lines represent ± two-fold boundaries
Two variables, microsomal protein binding and CLint, which are used in the prediction of the clinical DDIs, were explored to identify reasons for the overprediction. 3-D plots were created for each of the prediction methods looking at the log of the protein binding vs. the log of the ratio of the intrinsic clearance in rhCYPs/intrinsic clearance in HLMix-101 vs. the ratio of the clinical and predicted DDI values. A representative example is shown in Figure 2. All three methods of prediction showed a clear pattern of differentiation; the majority of compounds having been overestimated were highly protein bound. However, two compounds that fell outside the two-fold boundary were found to have low protein binding values. In these cases the poor predictions were attributed to low intrinsic clearance ratios.
Figure 2.
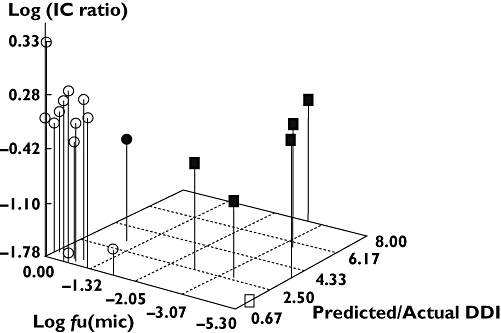
Representative 3-D scatter plot of the log of the microsomal unbound fraction (fu(mic)) vs. the log of the ratio of the intrinsic clearance (IC ratio) in rhCYPs/intrinsic clearance in HLMix-101 vs. ratio of the predicted/actual DDI. Compounds whose predicted values were outside of the two-fold boundary are shown in black. The squares represent compounds which have an unbound fraction of < 0.1
Equilibrium dialysis produces more accurate and reproducible measurement of protein binding than the high throughput ultra-flitration approach for highly bound compounds. Drug–drug interaction predictions were reassessed using the values of protein binding from equilibrium dialysis of the eight highly bound compounds (microsomal binding data not shown). These, together with the DDI predictions for the remaining 12 compounds, are listed in Table 4. For the approach using chemical inhibitors, only one compound was re-predicted as falling within the boundary (Figure 3A). The two PanVera methods yielded similar results with two out of eight compounds being re-predicted to fall within the two-fold boundary (Figure 3B,C). Using Gentest Supersomes five out of eight compounds which were already within the two-fold of the clinical DDI remained within this boundary upon re-prediction. However, the three additional compounds were re-predicted within the two-fold boundary (Figure 3D).
Table 4.
List of clinical AUC fold increases (with ± two-fold boundary values) for 20 test compounds compared with the in vitro predicted interactions, determined from chemical inhibitor and recombinant cytochrome P450 experiments (see Methods). Values in bold represent predictions falling outside of the two-fold boundaries
| Predicted AUC fold increase | ||||||||
|---|---|---|---|---|---|---|---|---|
| Clinical AUC fold increase | Two-fold boundaries | Chemical inhibitors | PanVera CLint ISEF | PanVera Vmax ISEF | Gentest Vmax ISEF | |||
| 1 | Eletriptan | 4.8 | 2.40 | 9.60 | 2.40 | 4.92 | 6.15 | 3.54 |
| 2 | Tolteradine | 2.1 | 1.00 | 4.20 | 1.30 | 2.16 | 2.25 | 1.34 |
| 3 | Celecoxib | 1.1 | 0.55 | 2.20 | 2.51 | 1.46 | 1.63 | 1.09 |
| 4 | Alprazolam | 3.00 | 1.50 | 6.00 | ND | 3.79 | 4.77 | 3.03 |
| 5 | Triazolam | 12.7 | 6.40 | 25.40 | 1.96 | 4.51 | 3.59 | 6.40 |
| 6 | Conivaptin | 10.9 | 5.45 | 21.80 | 3.85 | 8.09 | 7.29 | 7.26 |
| 7 | Eplerenone | 4.90 | 2.45 | 9.80 | 1.56 | 7.24 | 6.86 | 6.8 |
| 8 | Lasofoxefene | 1.2 | 0.60 | 2.40 | ND | 8.53 | 8.02 | 4.75 |
| 9 | Tirilazed | 4.1 | 2.05 | 8.20 | 30 | 36.13 | 20.03 | 7.65 |
| 10 | Ziprasidone | 1.35 | 0.68 | 2.70 | 5.87 | 6.18 | 4.49 | 6.26 |
| 11 | Dofetilide | 1.55 | 0.78 | 3.10 | ND | 1.28 | 1.16 | 1.15 |
| 12 | PF-A | 3.2 | 1.60 | 6.40 | 7.94 | 7.14 | 6.73 | 3.04 |
| 13 | PF-B | 10.5 | 5.25 | 21.00 | 4.05 | 12.16 | 17.85 | 8.55 |
| 14 | PF-C | 5.16 | 2.58 | 10.32 | 2.69 | 6.48 | 5.54 | 6 |
| 15 | PF-D | 7.6 | 3.80 | 15.20 | 8.48 | 9.57 | 7.69 | 8.44 |
| 16 | PF-E | 8.3 | 4.15 | 16.60 | 3.59 | 9.08 | 7.21 | 5.99 |
| 17 | PF-F | 2 | 1.00 | 4.00 | 1.30 | 1.36 | 1.27 | 1.36 |
| 18 | PF-G | 6 | 3.00 | 12.00 | 9.97 | 8.7 | 7.57 | 7.37 |
| 19 | PF-H | 1.25 | 0.63 | 2.50 | 6.76 | 5.86 | 6.2 | 4.64 |
| 20 | PF-I | 1.34 | 0.67 | 2.68 | ND | 1.25 | 1.14 | 1.57 |
Figure 3.
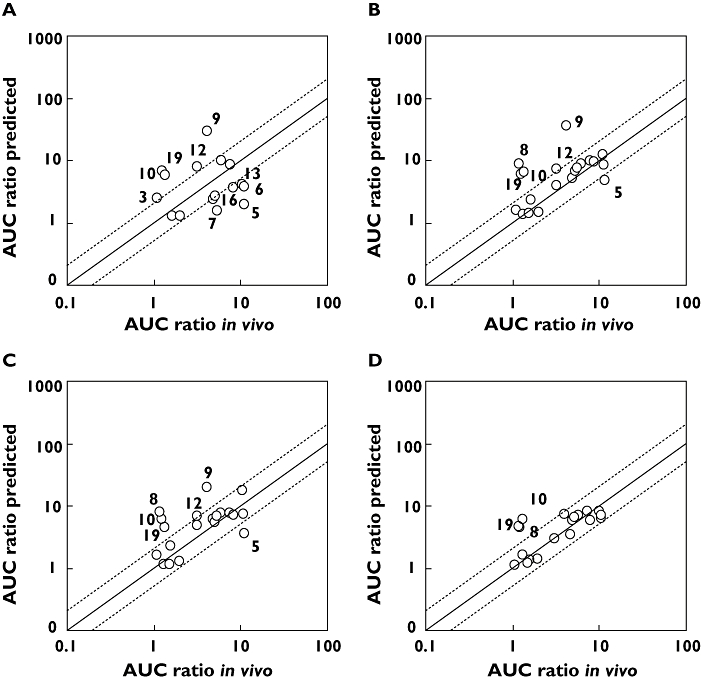
Observed and predicted AUC increases for CYP3A4 DDIs, where fumic was determined for compounds by equilibrium dialysis (if found to have fumic < 0.1 by ultrafiltration). (A) Chemical inhibitors, (B) Panvera Vmax ISEF, (C) PanVera CLint ISEF, (D) Gentest Vmax ISEF. Solid line represents line of unity, and dashed lines represent ± two-fold boundaries
All methods showed an improvement in prediction when equilibrium dialysis was used to generate a fu to correct for nonspecific protein binding of the highly bound compounds (Table 5). The Gentest Vmax ISEF approach showed the smallest RMSE with a value of 2.38 when including all observations. The mean errors were positive with the rhCYPs, showing an overestimation of results. The smallest bias was with Gentest Vmax ISEF (0.23), indicating a slight overestimation in predictions. When only investigating compounds with free fraction ≥0.1, the RMSE of the various prediction methods did not differ significantly from those which included all the observations, with the exception of PanVera Vmax ISEF which showed a significant improvement. In contrast the RMSE and bias of the two PanVera approaches were poorer when investigating compounds with free fraction < 0.1, whilst those for the chemical inhibitor and Gentest Vmax ISEF approach, were not too dissimilar from the predictions which included all the observations. However it should be noted that despite a similar level of precision observed using chemical inhibitors, this was based upon fewer observations compared those for predictions using the Gentest Vmax ISEF approach. No plausible explanation for the difference in RMSE between the in vitro systems is apparent.
Table 5.
Precision of each of the in vitro approaches (as determined by the root mean square error (RMSE)) at predicting the DDI compared with that of the clinical value
| Precision | ||||
|---|---|---|---|---|
| n | Bias Mean error | Root mean square error (RMSE) | Median absolute error (MAE) | |
| All observations | ||||
| Chemical inhibitors | 16 | −1.07 | 4.59 | 3.97 |
| Gentest Vmax ISEF | 20 | 0.23 | 2.38 | 1.32 |
| PanVera CLint ISEF | 20 | 1.79 | 4.91 | 1.51 |
| PanVera Vmax ISEF | 20 | 2.71 | 7.78 | 1.75 |
| Compounds with free fraction ≥0.1 | ||||
| Chemical inhibitors | 11 | −2.79 | 4.82 | −2.47 |
| Gentest Vmax ISEF | 14 | −0.62 | 2.10 | −0.34 |
| PanVera CLint ISEF | 14 | 0.30 | 3.35 | 0.23 |
| PanVera Vmax ISEF | 14 | 0.22 | 2.48 | 0.58 |
| Compounds with free fraction <0.1 | ||||
| Chemical inhibitors | 5 | 3.66 | 3.89 | 4.25 |
| Gentest Vmax ISEF | 6 | 2.20 | 2.92 | 2.46 |
| PanVera CLint ISEF | 6 | 5.25 | 7.36 | 3.34 |
| PanVera Vmax ISEF | 6 | 8.53 | 13.70 | 4.39 |
Highly bound compounds (fu < 0.1) had fumic determined using equilibrium dialysis.
Categorical analyses were also performed to examine the strength of the different in vitro models for predicting if the interaction was small (≤2) or large (>2) (Table 6). The two ISEF methods (Vmax ISEF and CLint ISEF) using PanVera Baculosomes, were found to correctly predict values within the same category as the clinical value for 16 of the 20 compounds. The Gentest Vmax ISEF method correctly predicted 17 compounds into the same category as the clinical DDI.
Table 6.
Frequency of categorized predicted DDI values and clinical DDI values, includes highly bound compounds with fumic determined using equilibrium dialysis
| Clinical DDI | ||||
|---|---|---|---|---|
| Prediction | Predicted DDI | ≤2 | >2 | Total |
| Chemical Inhibitors | ≤2 | 2 | 1 | 3 |
| >2 | 3 | 10 | 13 | |
| Total | 5 | 11 | 16 | |
| GENTEST Vmax ISEF | ≤2 | 5 | 0 | 5 |
| >2 | 3 | 12 | 15 | |
| Total | 8 | 12 | 20 | |
| PANVERA Vmax ISEF | ≤2 | 4 | 0 | 4 |
| >2 | 4 | 12 | 16 | |
| Total | 8 | 12 | 20 | |
| PANVERA CLint ISEF | ≤2 | 4 | 0 | 4 |
| >2 | 4 | 12 | 16 | |
| Total | 8 | 12 | 20 | |
Shaded boxes represent number of compounds where predicted DDIs were correctly categorized with the clinical DDIs.
Discussion
Several in vitro approaches have been developed to study and predict the in vivo behaviour of new drugs at an early stage of drug development, with prediction of potential DDIs often the main focus of these studies. Prediction of in vivo pharmacokinetics from in vitro data is still complex and variable. The results of studies carried out to predict the magnitude of DDIs in vivo from in vitro data are often diverse and with different success rates [13, 15–23]. The quality of the results from these in vitro studies was influenced by the in vitro experimental model used, type of substrate, extent of protein binding, and the model used to calculate the prediction, all of which resulted in considerable interlaboratory variations.
The aim of the current study was to investigate two commonly used in vitro approaches. The first approach studied metabolic clearance using human liver microsomes in the presence of specific CYP inhibitors. The second approach studied the in vitro clearance data generated from incubations with rhCYPs. The contribution made by the five major CYPs to the metabolic clearance of the test compounds (fmCYP) were then used to predict the in vivo DDIs (Equation 7) for each compound as objects of interaction with the known CYP3A4 inhibitor, ketoconazole. In vitro inhibition constants (Ki) for ketoconazole have been shown to vary within the literature 0.0037–0.7 [21]. The present study employed a Ki value of 0.015 μm, consistent with previous studies demonstrating good predictions of in vivo DDIs with CYP3A4 [24, 25]. The importance of these various inputs has been discussed in detail elsewhere [26] and hence will not be addressed here.
Drug–drug interaction predictions were initially performed using fu values determined by ultrafiltration. Twelve compounds were accurately predicted to be within two-fold of the clinical values was seen with PanVera rhCYPs (60% success rate) using both Vmax ISEF and CLint ISEF corrections. In comparison, the DDI for 14 compounds was predicted within two-fold with Gentest rhCYPs corrected using Vmax ISEF (70% success rate). In contrast, only 31% accuracy (5/16) was seen when performing studies using chemical inhibitors. Closer scrutiny of the compounds whose DDIs were poorly predicted, found that the majority had fumic values < 0.05. Small changes in these fumic values are likely to have a significant impact when correcting CLint values, and as a consequence the predicted DDIs. The study initially used binding values generated by ultrafiltration. Upon reanalyzing with protein binding values determined by equilibrium dialysis the prediction of DDI improved in each system. Gentest supersomes exhibited the greatest accuracy in predictions accurately predicting 85% (17/20) of the compounds within two-fold of the known clinical interaction. Using PanVera baculosomes an improvement in prediction accuracy was also observed, correctly identifying 70% (14/20) of the compounds. In contrast using chemical inhibitors the accuracy remained the lowest, predicting only 37% (6/16) of compounds within two-fold of the clinical value. The lower success seen with chemical inhibitors is due in part to the inability to predict DDIs for slowly metabolized compounds, highlighting one of the limitations of this approach. However, the higher intrinsic activity of rhCYPs enabled measurement of CYP contributions to be made for all compounds in the test set.
Using Gentest supersomes, 17 were correctly predicted within two-fold of the clinical values. The three compounds not predicted were lasofoxifene (compound 8), ziprasidone (compound 10) and PF-H (compound 19). Two pharmacokinetic properties that are important in DDI predictions are the blood-plasma partition ratio (B : P ratio), used to determine whole blood clearance and information on alternative routes of clearance, i.e. phase II, non-P450 or renal. As stated earlier, predictions were made based upon available in house in vitro measures. Lasofoxifine predictions were made using a default B : P ratio of 0.55. However, this compound is a lipophilic base, which could drive partition into the red blood cells, increasing the B : P ratio consequently reducing the blood clearance and as a result the predicted DDI. This is also the case for PF-H, whose structure suggests it too could have a B : P value greater than the default value used of 0.55. Moreover, both compounds contain structural motifs conducive to phase II metabolism, which could provide additional clearance routes, thereby reducing the CYP3A4 contribution and. as a consequence. the magnitude of the DDI. However this information was not available so was not included in the simulations. Ziprasidone was known to the cleared both renally and via aldehyde oxidase. These alternative clearance routes were included in the predictions. An over prediction in the intrinsic clearance generated using rhCYP3A4 may have resulted in the higher than expected DDI prediction.
Besides alternative in vivo routes of metabolism, the limited success seen with a number of predictions could potentially be due a lack of specificity by ketoconazole at inhibiting the metabolic clearance route for the test compounds in vivo and/or a role played by intestinal P450s and transporters. CYP3A4 constitutes the major CYP present in the gut and the abundance of the isozyme has been quantified [27, 28]. The SIMCYP® model incorporates the substrate CYP3A4 CLint value together with the gut CYP3A4 abundance and calculates a total CYP3A4 CLint value for the gut. However, it is recognized that the substrate concentration available to gut CYP3A4 will be modified if the compound is also a substrate for transporters such as P-glycoprotein (P-gp). Thus, the overall gut availability of drug (Fg) may depend not only on CYP3A4 mediated metabolism but also the interplay between transporters, passive membrane permeability and the blood flow to the enterocyte. In the current test set, information on transporter interactions was known for five compounds. Four were P-gp substrates (eletriptan, PF-C, PF-D and PF-E) and one (dofetilide), a substrate for the organic cation transporter (OCT). However, DDI predictions for these compounds were within two-fold of the clinical value, suggesting that inhibition of CYP3A4 represents a significant contribution of the DDI.
The findings reported here are in agreement with recent studies which have demonstrated that in vitro data can be used to predict potential CYP3A4 DDIs in vivo[22, 23]. In these, the refinement of inhibitor inputs has been suggested to account for predictions that do not fall within the expected two-fold criteria. Amongst these inputs are the value of [I] and the absorption rate constant (ka). Reports suggest that the use of [I]in results in over-predictions and false-positives, and that using free [I]in concentrations results in significant under-predictions [22]. However, it was shown that when inclusion of the fm term is used (Equation 7) predictions are improved. More recently Brown and coworkers suggested [I]av provided a better estimation of the inhibitor concentration, reducing the chance of overestimations. However, the inclusion of a refined ka value together with [I]in has also been shown to improve predictions. The current study employed a value of 1.9 h−1 consistent with other studies [23, 25]. As a consequence, the over-estimations observed in this study do not appear to be due to the ketoconazole inputs used, but potentially the fm value used for CYP3A4 and contributions for other CYPs to the metabolism of the test compounds, and/or the ISEF values.
In conclusion, the greatest accuracy in DDI predictions was made using rhCYPs (Gentest > PanVera) compared with chemical inhibitors. The current study demonstrated that the use of rhCYPs with SIMCYP® provides a robust in vitro system for predicting the likelihood and magnitude of changes in clinical exposure of compounds as a consequence of CYP3A4 inhibition with a concomitantly administered drug. It is clear that careful consideration should be paid to identifying the most suitable in vitro approach based upon the properties of the drug under investigation, enabling a confident prediction of the likelihood and magnitude of clinical DDI. This enables an earlier and more informed management of a drug's development plan.
REFERENCES
- 1.Walker DK. The use of pharmacokinetic and pharmacodynamic data in the assessment of drug safety in early drug development. Br J Clin Pharmacol. 2004;58:601–8. doi: 10.1111/j.1365-2125.2004.02194.x. [DOI] [PMC free article] [PubMed] [Google Scholar]
- 2.Shou M. Prediction of pharmacokinetics and drug–drug interactions from in vitro metabolism data. Curr Opin Drug Discov Devel. 2005;8:66–77. [PubMed] [Google Scholar]
- 3.Andersson TB, Bredberg E, Ericsson H, Sjoberg H. An evaluation of the in vitro metabolism data for predicting the clearance and drug–drug interaction potential of CYP2C9 substrates. Drug Metab Dispos. 2004;32:715–21. doi: 10.1124/dmd.32.7.715. [DOI] [PubMed] [Google Scholar]
- 4.McGinnity DF, Riley RJ. Predicting drug pharmacokinetics in humans from in vitro metabolism studies. Biochem Soc Trans. 2001;29:135–9. doi: 10.1042/0300-5127:0290135. [DOI] [PubMed] [Google Scholar]
- 5.Gibbs JP, Hyland R, Youdim K. Minimizing polymorphic metabolism in drug discovery: evaluation of the utility of in vitro methods for predicting pharmacokinetic consequences associated with CYP2D6 metabolism. Drug Metab Dispos. 2006;8:8. doi: 10.1124/dmd.105.008714. [DOI] [PubMed] [Google Scholar]
- 6.Rostami-Hodjegan A, Tucker G. In silico simulations to assess the in vivo consequences of in vitro metabolic drug–drug interactions. Drug Disc Today Technol. 2004;1:441–8. doi: 10.1016/j.ddtec.2004.10.002. [DOI] [PubMed] [Google Scholar]
- 7.Li AP, Lu C, Brent JA, Pham C, Fackett A, Ruegg CE, Silber PM. Cryopreserved human hepatocytes: characterization of drug-metabolizing enzyme activities and applications in higher throughput screening assays for hepatotoxicity, metabolic stability, and drug–drug interaction potential. Chem Biol Interact. 1999;121:17–35. doi: 10.1016/s0009-2797(99)00088-5. [DOI] [PubMed] [Google Scholar]
- 8.Venkatakrishnan K, von Moltke LL, Greenblatt DJ. Application of the relative activity factor approach in scaling from heterologously expressed cytochromes p450 to human liver microsomes: studies on amitriptyline as a model substrate. J Pharmacol Exp Ther. 2001;297:326–37. [PubMed] [Google Scholar]
- 9.Yong WP, Ramirez J, Innocenti F, Ratain MJ. Effects of ketoconazole on glucuronidation by UDP-glucuronosyltransferase enzymes. Clin Cancer Res. 2005;11:6699–704. doi: 10.1158/1078-0432.CCR-05-0703. [DOI] [PubMed] [Google Scholar]
- 10.Tang W, Stearns RA. Heterotropic cooperativity of cytochrome P450 3A4 and potential drug–drug interactions. Curr Drug Metab. 2001;2:185–98. doi: 10.2174/1389200013338658. [DOI] [PubMed] [Google Scholar]
- 11.Nakajima M, Tane K, Nakamura S, Shimada N, Yamazaki H, Yokoi T. Evaluation of approach to predict the contribution of multiple cytochrome P450s in drug metabolism using relative activity factor: effects of the differences in expression levels of NADPH-cytochrome P450 reductase and cytochrome b (5) in the expression system and the differences in the marker activities. J Pharm Sci. 2002;91:952–63. doi: 10.1002/jps.10091. [DOI] [PubMed] [Google Scholar]
- 12.Venkatakrishnan K, Obach RS. In vitro-in vivo extrapolation of CYP2D6 inactivation by paroxetine: prediction of nonstationary pharmacokinetics and drug interaction magnitude. Drug Metab Dispos. 2005;33:845–52. doi: 10.1124/dmd.105.004077. [DOI] [PubMed] [Google Scholar]
- 13.Proctor NJ, Tucker GT, Rostami-Hodjegan A. Predicting drug clearance from recombinantly expressed CYPs: intersystem extrapolation factors. Xenobiotica. 2004;34:151–78. doi: 10.1080/00498250310001646353. [DOI] [PubMed] [Google Scholar]
- 14.Rowland M, Matin SB. Kinetics of drug–drug interactions. J Pharmacokinet Biopharm. 1973;1:553–67. [Google Scholar]
- 15.Bertz RJ, Granneman GR. Use of in vitro and in vivo data to estimate the likelihood of metabolic pharmacokinetic interactions. Clin Pharmacokinet. 1997;32:210–58. doi: 10.2165/00003088-199732030-00004. [DOI] [PubMed] [Google Scholar]
- 16.Nakasa H, Nakamura H, Ono S, Tsutsui M, Kiuchi M, Ohmori S, Kitada M. Prediction of drug–drug interactions of zonisamide metabolism in humans from in vitro data. Eur J Clin Pharmacol. 1998;54:177–83. doi: 10.1007/s002280050442. [DOI] [PubMed] [Google Scholar]
- 17.Bachmann KA, Ghosh R. The use of in vitro methods to predict in vivo pharmacokinetics and drug interactions. Curr Drug Metab. 2001;2:299–314. doi: 10.2174/1389200013338504. [DOI] [PubMed] [Google Scholar]
- 18.Shiran MR, Proctor NJ, Howgate EM, Rowland-Yeo K, Tucker GT, Rostami-Hodjegan A. Prediction of metabolic drug clearance in humans: in vitro-in vivo extrapolation vs allometric scaling. Xenobiotica. 2006;36:567–80. doi: 10.1080/00498250600761662. [DOI] [PubMed] [Google Scholar]
- 19.Howgate EM, Rowland Yeo K, Proctor NJ, Tucker GT, Rostami-Hodjegan A. Prediction of in vivo drug clearance from in vitro data. I. Impact of inter-individual variability. Xenobiotica. 2006;36:473–97. doi: 10.1080/00498250600683197. [DOI] [PubMed] [Google Scholar]
- 20.Emoto C, Murase S, Iwasaki K. Approach to the prediction of the contribution of major cytochrome P450 enzymes to drug metabolism in the early drug-discovery stage. Xenobiotica. 2006;36:671–83. doi: 10.1080/00498250600709778. [DOI] [PubMed] [Google Scholar]
- 21.Galetin A, Ito K, Hallifax D, Houston JB. CYP3A4 substrate selection and substitution in the prediction of potential drug–drug interactions. J Pharmacol Exp Ther. 2005;314:180–90. doi: 10.1124/jpet.104.082826. Epub 2005 March 22. [DOI] [PubMed] [Google Scholar]
- 22.Brown HS, Galetin A, Hallifax D, Houston JB. Prediction of in vivo drug–drug interactions from in vitro data: factors affecting prototypic drug–drug interactions involving CYP2C9, CYP2D6 and CYP3A4. Clin Pharmacokinet. 2006;45:1035–50. doi: 10.2165/00003088-200645100-00006. [DOI] [PubMed] [Google Scholar]
- 23.Brown HS, Ito K, Galetin A, Houston JB. Prediction of in vivo drug–drug interactions from in vitro data: impact of incorporating parallel pathways of drug elimination and inhibitor absorption rate constant. Br J Clin Pharmacol. 2005;60:508–18. doi: 10.1111/j.1365-2125.2005.02483.x. [DOI] [PMC free article] [PubMed] [Google Scholar]
- 24.Gibbs MA, Thummel KE, Shen DD, Kunze KL. Inhibition of cytochrome P-450 3A (CYP3A) in human intestinal and liver microsomes: comparison of Ki values and impact of CYP3A5 expression. Drug Metab Dispos. 1999;27:180–7. [PubMed] [Google Scholar]
- 25.Chien JY, Lucksiri A, Ernest CS, Gorski JC, Wrighton SA, Hall SD. Stochastic prediction of CYP3A-mediated inhibition of midazolam clearance by ketoconazole. Drug Metab Dispos. 2006;34:1208–19. doi: 10.1124/dmd.105.008730. Epub 2006 April 12. [DOI] [PubMed] [Google Scholar]
- 26.Obach RS, Walsky RL, Venkatakrishnan K, Gaman EA, Houston JB, Tremaine LM. The utility of in vitro cytochrome P450 inhibition data in the prediction of drug–drug interactions. J Pharmacol Exp Ther. 2006;316:336–48. doi: 10.1124/jpet.105.093229. Epub 2005 September 28. [DOI] [PubMed] [Google Scholar]
- 27.Paine MF, Khalighi M, Fisher JM, Shen DD, Kunze KL, Marsh CL, Perkins JD, Thummel KE. Characterization of interintestinal and intraintestinal variations in human CYP3A-dependent metabolism. J Pharmacol Exp Ther. 1997;283:1552–62. [PubMed] [Google Scholar]
- 28.Yang J, Tucker GT, Rostami-Hodjegan A. Cytochrome P450 3A expression and activity in the human small intestine. Clin Pharmacol Ther. 2004;76:391. doi: 10.1016/j.clpt.2004.07.001. [DOI] [PubMed] [Google Scholar]