

Abstract
AIMS
To examine the recovery time course of CYP3A after enzyme induction by St John's wort administration.
METHODS
The subjects were 12 healthy men, aged 20–33 years. On the first day, they received an oral dose of midazolam 5 mg without St John's wort (day −14). From the next day, they took St John's wort for 14 days. On the last day of St John's wort treatment (day 0) and 3 and 7 days after completion of St John's wort treatment (days 3 and 7), they received the same dose of midazolam. On each day, blood samples were obtained until 8 h after midazolam administration. Plasma concentrations of midazolam were measured by HPLC. Pharmacokinetic parameters of midazolam were determined using noncompartmental analysis.
RESULTS
Apparent oral clearance of midazolam was significantly increased after St John's wort administration from 65.3 ± 8.4 l h−1 (day −14) to 86.8 ± 17.3 l h−1 (day 0). It returned to the control level 7 days after the completion of St John's wort (day 7, 59.7 ± 3.8 l h−1). No significant difference in the elimination half-life between the four periods of the study was observed. The changes in apparent oral clearance after St John's wort discontinuation indicated that CYP3A activity recovers from enzyme induction with an estimated half-life of 46.2 h.
CONCLUSIONS
CYP3A activity induced by St John's wort administration progressively returns to the basal level after approximately 1 week. This finding may provide useful information to avoid clinically significant interactions of St John's wort with CYP3A substrates.
WHAT IS ALREADY KNOWN ABOUT THIS SUBJECT
St John's wort causes the induction of CYP3A. Little is known about how long the effect remains after cessation of St John's wort.
WHAT THIS STUDY ADDS
The in vivo CYP3A activity returns progressively to the basal level approximately 1 week after cessation of St John's wort administration
Keywords: CYP3A, enzyme induction, recovery time course, St John's wort
Introduction
St John's wort (Hypericum perforatum) has been one of the most commonly used herbal remedies for mood disorders [1], and is also well-known as a potent inducer of cytochrome P450 (CYP) 3A [2–5]. A great number of studies have demonstrated the potential reduction in drug efficacy due to the decrement of plasma drug concentrations during the period of concomitant use of St John's wort [6, 7]. However, little attention has been paid to the recovery time course of the interaction caused by CYP3A induction by St John's wort. This can be an important issue not only in clinical practice, but also in clinical studies. First, we have a large population that consumes St John's wort in the world. Information about the recovery of CYP3A activity after discontinuation of St John's wort, if available, will be helpful to decide a suitable dosage of a drug in patients who discontinue St John's wort. Second, for studying interactions of St John's wort and drugs in humans, a crossover design is often used. This design requires a washout period between treatments. The period has to be sufficient to avoid the carry-over effect of the proceeding treatment. Data concerning the recovery time of the CYP3A after stopping St John's wort will provide essential information for designing studies of drug interactions with an adequate washout period.
St John's wort affects the activities of transporters such as P-glycoprotein (MDR-1) as well as CYP3A [8]. Midazolam is an in vivo probe for human CYP3A activity and the clinical pharmacokinetics of midazolam are not influenced by P-glycoprotein. In the present study, we examined the pharmacokinetics of midazolam to determine the time course changes in CYP3A activity after discontinuation of St John's wort.
Methods
Subjects
The Institutional Review Board of Oita University Hospital reviewed and approved the protocol, and all participants provided written informed consent before the study was initiated. The subjects were 12 healthy Japanese men, aged 20–33 years. They were nonsmokers, taking no medications and ascertained to be healthy by a medical history, a physical examination, electrocardiogram, whole blood cell counts, serum chemical analysis and urinalysis. They were asked to refrain from consuming herbal dietary supplements and grapefruit 2 weeks before the start of the study and throughout the study, and also asked to stop taking alcohol and caffeine containing beverages 1 day before receiving midazolam. Adherence to these instructions, including compliance of St John's wort intake, and any study-related symptoms were assessed three times during the period of St John's wort treatment on an outpatient basis.
Experimental protocol
This was an open-labelled, repeated measurements study. The study design is shown in Figure 1. The subjects received a single oral dose of 5 mg midazolam (Dormicum®, Yamanouchi, Tokyo, Japan) (day −14). From the next day, they took St John's wort (TruNature®, Leiner Health Products, Carson, CA) 300 mg three times per day with meals for 14 days. On the last day of St John's wort treatment (day 0) and 3 and 7 days after completion of St John's wort treatment (day 3 and 7), they received the same dose of midazolam. On each day, subjects entered the Clinical Pharmacology Unit in Oita University Faculty of Medicine at 08.00 h. At first, subjects were carefully interviewed to ascertain whether they had taken any other drugs, caffeine and alcohol. Subjects took a light breakfast at 08.30 h. At 09.00 h, subjects received a single oral dose of midazolam. Blood samples were collected via a cannula placed in a forearm vein which was kept patent with heparinized saline. Before each blood sampling, the fluid remaining within the cannula and a small amount of blood were withdrawn and discarded. Blood samples (9 ml) were obtained before dosing, and at 0.33, 0.67, 1, 1.5, 2, 3, 4, 6 and 8 h after midazolam administration. Samples were collected in heparinized tubes and centrifuged at 3000 g for 10 min, and the plasma was stored at −20°C. The brand and the dose of St John's wort used in this study were chosen on the basis of previous reports [9, 10]. The content of hypericin (an ingredient of St John's wort) in 10 randomly chosen caplets was measured by Sato Pharmaceutical Co., Ltd. (Tokyo, Japan). The content of hypericin was 0.807 ± 0.002 mg caplet−1 (mean ± SD).
Figure 1.

A scheme of the study design. Arrows represent midazolam (MDZ) dosing. SJW: St John's wort
Determination of midazolam concentrations
Plasma concentrations of midazolam were measured by high performance liquid chromatography (HPLC) with solid-phase extraction. The guard column (XTerra® RP18, 5 μm, 3.9 × 20 mm, Waters, Milford, MA) and analytical column (XTerra® RP18, 5 μm, 4.6 × 150 mm, Waters, Milford, MA) were operated at 40°C. The mobile phase consisted of 10 mM ammonium acetate buffer, acetonitrile, and methanol (65 : 26 : 9, v : v : v). The final solution was adjusted to a pH of 7.9 with NaOH and filtered through a 0.20 μm membrane filter. The flow rate was 1.5 ml min−1 and the UV detector wavelength was 230 nm. One hundred μl of 1 N NaOH, 1 ml of plasma, and 20 ng of flurazepam as an internal standard were applied to the solid columns (Extrelut® NT1, Merck, Darmstadt, Germany). After 10 min, the columns were eluted with 3 × 4 ml volumes of dichloromethane, and the eluents were evaporated to dryness by a centrifugal concentrator. The residues were dissolved in 200 μl of mobile phase and a volume of 100 μl was injected onto the analytical column. The retention times of 4-OH midazolam, 1-OH midazolam, midazolam, and flurazepam were 7.8, 8.5, 16.0, and 24.0 min, respectively. The peaks of midazolam and flurazepam were not overlapped with blank plasma peaks from any of the volunteers even after St John's wort administration. The lower limit of quantification was 1 ng ml−1. The standard curves for midazolam were linear within the ranges of 1 ng ml−1 to 100 ng ml−1 in plasma, and the correlation coefficients were greater than 0.999. For the lower limit of quantification, less than 20% of precision and within 20% of accuracy were considered to be acceptable. Three concentrations (100 ng ml−1, 20 ng ml−1, and 1 ng ml−1) were used to validate this assay. For these concentrations, the intraday coefficient of variation (CV) was 2.9, 3.7, and 14.7% (n = 5), the interday CV for three consecutive days was 0.87, 3.55, and 3.33% (n = 3), and accuracy (average of five standard samples) was −2.9, 3.7, and 1.9%, respectively. The analysis was performed in duplicate and mean concentrations were used for data analysis.
Pharmacokinetic analysis
Pharmacokinetic parameters of midazolam were determined by a noncompartmental analysis using WinNonlin Professional (Ver 5.2, Pharsight Co, Mountain View, CA). The log-linear trapezoidal method with extrapolation to infinite time was used to calculate the area under the plasma concentration–time curve (AUC(0, ∞)). The terminal elimination half-life (t1/2) was calculated by ln2/λz, where λz is the terminal slope calculated by linear regression of the time vs. log concentration. Apparent oral clearance (CL/F) was calculated by Dose/ AUC(0, ∞).
Statistical analysis
Statistical analyses were performed with SPSS for Windows (Ver 12.0 J, SPSS Inc, Tokyo, Japan). Based on a SD value of CL/F of midazolam obtained in our previous study [11], it was estimated that approximately 12 subjects were required to detect 20% difference in apparent oral clearance with a two-sided level of significance of 0.05 and 80% power. Differences between the four periods of the study were analyzed by use of repeated measures anova test (after logarithmic transformation except for tmax) and when there was a significant difference (P < 0.05), we continued the comparison using Student's paired t-test with Bonferroni's correction (α = 0.05/6). For analysis of tmax which is a discrete variable, we used Friedman's test. Differences between the periods were considered statistically significant when the P value was less than 0.05/6.
Model-based analysis of de-induction timecourse
The disappearance process of the inductive effect of CYP3A activity was estimated with CL/F ratios between the periods. The ratio (R) was defined as
 |
(1) |
EdayX represents a fractional increase in apparent oral clearance X days after cessation of St John's wort. Assuming that EdayX decreases with time in a first order process, it can be calculated as follows.
| (2) |
(E0 initial value of E, k rate constant, ε error term)
For estimating k and its confidence interval, pooled data obtained from all individuals were subjected to a nonlinear regression analysis using SPSS for Windows (Ver 12.0 J, SPSS Inc, Tokyo, Japan), and the recovery half-life (t1/2) was calculated using the point estimate (ln2/k).
Results
All volunteers completed the study protocol, and no drug-related adverse events occurred except for mild drowsiness after midazolam dosing.
Mean plasma concentrations of midazolam are shown in Figure 2 and pharmacokinetic parameters of midazolam are shown in Table 1. Apparent oral clearance (CL/F) of midazolam was significantly increased after St John's wort administration, from 65.3 ± 8.4 l h−1 (day −14) to 86.8 ± 17.3 l h−1 (day 0) (P = 0.001). It returned to the control level 7 days after completion of St John's wort (day 7, 59.7 ± 3.8 l h−1). Individual time courses of CL/F ratios are presented in Figure 3. A nonlinear regression analysis of the time course changes in CL/F ratios showed a significant correlation (correlation coefficient 0.49, P < 0.05). The recovery half-life of CYP3A activity calculated from the point estimate was 46.2 h (95% CI 20.4, 115.5 h). No significant difference in the elimination half-life between the four periods of the study was observed.
Figure 2.
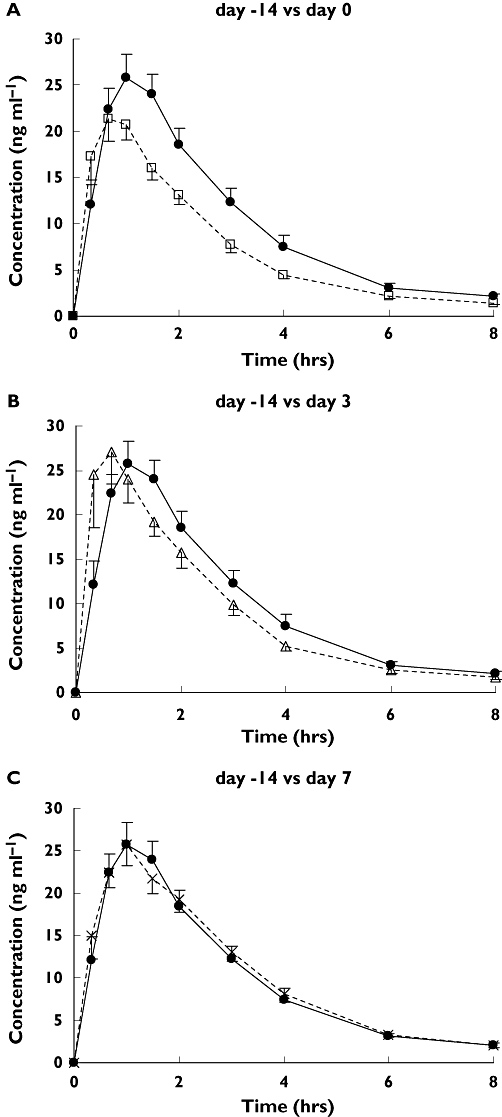
Mean (±SEM) plasma concentrations of midazolam on day 0 (□) (A), day 3 (▵) (B), and day 7 (×) (C) compared with day −14 (•) (control) in 12 subjects
Table 1.
Pharmacokinetic parameters of midazolam after a single oral administration of 5 mg dose
| PK parameters | Day −14 (control) | Day 0 | Day 3 | Day 7 |
|---|---|---|---|---|
| Cmax (ng ml−1) | 28.2 ± 2.5 | 24.7 ± 2.4 | 32.4 ± 5.1 | 28.5 ± 2.3 |
| ratio vs. control (95% CI) | 0.91 (0.74, 1.08) | 1.16 (0.85, 1.47) | 1.06 (0.90, 1.22) | |
| tmax (h)a | 1.0 (0.33–2.0) | 0.67 (0.33–2.0) | 0.67 (0.33–2.0) | 1.0 (0.33–2.0) |
| AUC(0, ∞) (ng ml−1 h) | 84.4 ± 8.0 | 60.5 ± 4.4* | 75.7 ± 8.7 | 87.6 ± 5.7 |
| ratio vs. control (95% CI) | 0.75 (0.65, 0.85) | 0.91 (0.77, 1.05) | 1.09 (0.95, 1.23) | |
| CL/F (l h−1) | 65.3 ± 8.4 | 86.8 ± 17.3* | 75.1 ± 6.3 | 59.7 ± 3.8 |
| ratio vs. control (95% CI) | 1.40 (1.20, 1.60) | 1.17 (1.01, 1.33) | 0.96 (0.86, 1.06) | |
| t1/2 (h) | 1.84 ± 0.18 | 1.54 ± 0.10 | 1.71 ± 0.1 | 1.86 ± 0.14 |
| ratio vs. control (95% CI) | 0.91 (0.74, 1.08) | 1.01 (0.81, 1.21) | 1.12 (0.84, 1.40) | |
| Vd/F (l) | 165.7 ± 16.5 | 188.9 ± 12.7 | 180.2 ± 16.2 | 162.2 ± 18.8 |
| ratio vs. control (95% CI) | 1.20 (1.08, 1.32) | 1.12 (0.99, 1.25) | 1.01 (0.86, 1.16) | |
| MRT (h) | 2.95 ± 0.18 | 2.49 ± 0.15 | 2.59 ± 0.12 | 3.04 ± 0.12 |
| ratio vs. control (95% CI) | 0.86 (0.78, 0.94) | 0.89 (0.81, 0.97) | 1.06 (0.94, 1.18) |
P < 0.05/6 compared with day −14. Data are given as mean ± SEM, except for tmax, which is given as median and range. Cmax, peak plasma concentration; tmax, time to peak plasma concentration; AUC(0,∞), area under the plasma concentration-time curve extrapolated to infinity; CL/F, apparent oral clearance; t1/2, terminal elimination half-life; Vd/F, apparent oral volume of distribution; MRT, mean residence time.
Figure 3.
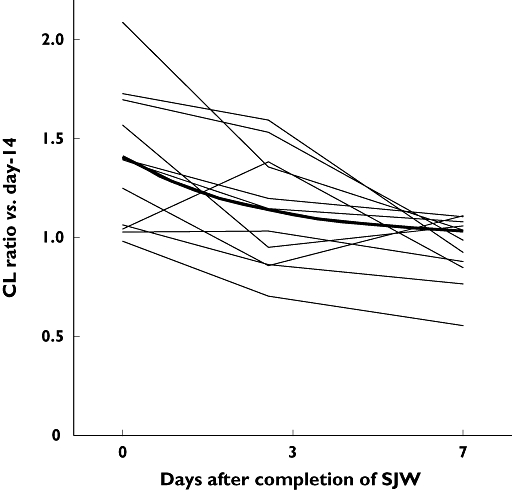
Individual changes of apparent oral clearance ratio (vs. day −14 as control) after completion of St John's wort (SJW) administration. Bold line represents a recovery process curve of apparent oral clearance ratio calculated from point estimates by nonlinear regression analysis
Discussion
In the present study, the repeated 14 day treatment with St John's wort produced a significant decrease in AUC of midazolam. This result is consistent with other studies [4, 5], and confirms that the repeated treatment with St John's wort induced CYP3A activity. The present study could not separate the effect sites (the intestine and/or liver) of St John's wort since only oral midazolam was administered. In agreement with the study by Wang et al.[4] and Dresser et al.[8], the decrease in AUC of midazolam was not accompanied by a change in t1/2, suggesting that long-term treatment with St John's wort mainly induces intestinal CYP3A rather than hepatic CYP3A. Wang et al. studied the effect of St John's wort with oral and intravenous midazolam, and demonstrated that St John's wort induced both intestinal and, to a lesser extent, hepatic CYP3A activity [4]. Although it is suggested that a greater part of the time course change in midazolam pharmacokinetics observed in the present study is attributable to altered intestinal CYP3A activity, it is unclear whether the time course differs between organs. Further studies are needed concerning this issue.
The extent of the decrease in AUC of midazolam showed a large interindividual difference in this study as well as in other studies. In the current study, one subject showed a slight increase in AUC of midazolam after treatment with St John's wort (control vs. day 0: 55.4 vs. 56.3 ng ml−1 h). Genetic polymorphism of CYP3A, which was not examined in the present study, might be one of the factors that cause a large interindividual variability. Concerning this issue, genetic polymorphisms of CYP3A4 and 3A5, which have been identified so far, have only a limited impact on CYP3A-mediated drug metabolism [12], and do not sufficiently reflect the interindividual variability of CYP3A activity [13]. However, it has been suggested that the presence of the CYP3A4*1B and the inversely linked CYP3A5*3 polymorphism might influence the induction of oral clearance of midazolam by rifampicin [14]. This indicates that interindividual variability in the extent of CYP3A induction might be partly attributable to genetic polymorphism of CYP3A4 and 3A5. Further studies are necessary to determine the relationship between genetic polymorphism and the variability in the induction of CYP3A4/5.
The increment in CL/F of midazolam observed in the present study (33%) is smaller than that reported by Wang et al. (109%) [4] and Dresser et al. (159%) [8]. One of the issues to be considered is ingredient variability among products. Commercial versions of St John's wort show significant differences in their constituents [15]. The St John's wort tablets used in the present study contained 0.807 ± 0.002 mg of hypericin. This was similar to the content of hypericin used in the study reported by Wang et al. (0.84 mg) [4]. However, the content of hypericin does not reflect that of hyperforin which shows a large variability among brands [15]. The hyperforin content of St John's wort affects the extent of the pharmacokinetic interaction between cyclosporin and St John's wort [16], indicating that hyperforin plays an important role in the induction of CYP3A. The St John's wort used in the present study might contain less hyperforin, which could be a cause of the lower magnitude of the interaction between St John's wort and midazolam compared with other studies. However, the brand of SJW chosen for the present study has been used in other interaction studies [9, 10]. These studies showed that St John's wort caused a significant reduction in the AUC of simvastatin and quazepam. It is conceivable that the brand used in the present study contained a sufficient quantity of hyperforin to produce a significant interaction with other drugs. Another issue to be discussed is food intake. In the present study, the volunteers had breakfast 30 min prior to oral midazolam intake. In the study of Wang et al.[4], midazolam was administered 1 h after breakfast, and in the study of Dresser et al.[8], fasting conditions were adopted for midazolam dosing. Food intake increases blood flow in the gut and liver, and may affect the first-pass metabolism. A previous study reported a small but significant decrease in the bioavailability of midazolam when the drug was given 1 h after a meal [17]. Food intake may partly contribute to the difference in results between the current study and the other earlier studies.
Apparent oral clearance of midazolam showed a progressive return toward the control value after the discontinuation of St John's wort. The return yielded a recovery half-life of 46.2 h. There is a possibility that the recovery half-life was overestimated since CYP3A might have been already fully recovered before day 7 as shown in Figures 2 and 3. However, the recovery half-life was similar to that of decrease in enzyme activity regarding CYP3A metabolism of S- and R-verapamil (50.4 and 36 h, respectively) after discontinuation of rifampicin treatment [18, 19]. These data including the results of the present study are in agreement with a half-life for CYP3A in human hepatocytes of 31.2–43.2 h [20]. The elimination half-lives of the inducers should be taken into consideration. The half-life of hyperforin, an active component in St John's wort for CYP3A induction, was reported to be 9 h [21]. The recovery half-life may be longer if the induction is produced by a drug with a longer elimination half-life such as phenobarbital or carbamazepine.
Concerning the recovery after mechanism-based inhibition (MBI) of CYP3A, Greenblatt et al. studied the time course of recovery of CYP3A function after single doses of grapefruit juice [22]. They estimated a recovery half-life of CYP3A at 23 h. A previous animal study showed that the content of metabolite-intermediate (MI) complex produced by MBI in the liver proportionally reflects the decrease in CYP3A activity [23]. Assuming that the turnover rate of induced CYP3A is similar to that of MI complex, the recovery half-life after CYP3A induction and MBI should resemble each other. However, the half-life of 46 h obtained in the present study was longer than that estimated from MBI by grapefruit juice. This may be attributable to differences in anatomic sites of the interaction. St John's wort induces both intestinal and, to a lesser extent, hepatic CYP3A activity [4], whereas grapefruit juice selectively inhibits CYP3A in the intestine [22]. The difference in the turnover rate of CYP between organs is the subject of further investigation.
The recovery of CYP3A activity after St John's wort discontinuation may require a reduction of the dose of CYP3A substrates with a narrow therapeutic range. Again, the magnitude and the recovery time course vary among individuals, and factors that cause interindividual variability are still to be determined. Therefore, therapeutic drug monitoring (TDM) contributes to the dose adjustment after cessation of St John's wort for a drug with a narrow therapeutic range.
A crossover design is often used for studies of drug–drug and food–drug interaction. This design requires a washout period that is long enough to avoid the carry-over effect of the proceeding treatment. Using the recovery half-life obtained in the present study (46.2 h), approximately 92% recovery can be achieved 168 h (7 days, 3.6 half-lives) after St John's wort discontinuation. However, as mentioned above, we should consider several factors such as a large interindividual difference in the induction effect of St John's wort and ingredient variability among different preparations. Seven days washout may not be sufficient to ensure the reliability of data in interaction studies of St John's wort. So far, most of the studies have been carried out with 2 weeks or longer washout period. A two week period allows approximately 87% recovery even if an individual shows a recovery half-life of 115.5 h, the maximum of 95% confidence interval obtained in the present study. It is not likely that there would be a significant carryover effect after a 2 week washout period in interaction studies of St John's wort.
In summary, the repeated 14 day treatment with St John's wort produced a significant decrease in AUC of midazolam. This change progressively attenuates after cessation of St John's wort with a recovery half-life of 46.2 h. These results indicate that CYP3A activity induced by St John's wort returns to the baseline level after approximately 1 week. However, the great interindividual difference and ingredient variability among St John's wort preparations should also be considered.
Acknowledgments
This work was supported in part by Grant-in-Aid for Scientific Research (C) from Japan Society for the Promotion of Science (no. 13672393).
REFERENCES
- 1.Linde K, Ramirez G, Mulrow CD, Pauls A, Weidenhammer W, Melchart D. St John's wort for depression: an overview and meta-analysis of randomised clinical trials. BMJ. 1996;313:253–8. doi: 10.1136/bmj.313.7052.253. [DOI] [PMC free article] [PubMed] [Google Scholar]
- 2.Roby CA, Anderson GD, Kantor E, Dryer DA, Burstein AH. St John's Wort: effect on CYP3A4 activity. Clin Pharmacol Ther. 2000;67:451–7. doi: 10.1067/mcp.2000.106793. [DOI] [PubMed] [Google Scholar]
- 3.Greeson JM, Sanford B, Monti DA. St. John's wort (Hypericum perforatum): a review of the current pharmacological, toxicological, and clinical literature. Psychopharmacology. 2001;153:402–14. doi: 10.1007/s002130000625. [DOI] [PubMed] [Google Scholar]
- 4.Wang Z, Gorski JC, Hamman MA, Huang SM, Lesko LJ, Hall SD. The effects of St John's wort (Hypericum perforatum) on human cytochrome P450 activity. Clin Pharmacol Ther. 2001;70:317–26. [PubMed] [Google Scholar]
- 5.Markowitz JS, Donovan JL, DeVane CL, Taylor RM, Ruan Y, Wang JS, Chavin KD. Effect of St John's wort on drug metabolism by induction of cytochrome P450 3A4 enzyme. JAMA. 2003;290:1500–4. doi: 10.1001/jama.290.11.1500. [DOI] [PubMed] [Google Scholar]
- 6.Mills E, Montori VM, Wu P, Gallicano K, Clarke M, Guyatt G. Interaction of St John's wort with conventional drugs: systematic review of clinical trials. BMJ. 2004;329:27–30. doi: 10.1136/bmj.329.7456.27. [DOI] [PMC free article] [PubMed] [Google Scholar]
- 7.Izzo AA. Drug interactions with St. John's Wort (Hypericum perforatum): a review of the clinical evidence. Int J Clin Pharm Ther. 2004;42:139–48. doi: 10.5414/cpp42139. [DOI] [PubMed] [Google Scholar]
- 8.Dresser GK, Schwarz UI, Wilkinson GR, Kim RB. Coordinate induction of both cytochrome P4503A and MDR1 by St John's wort in healthy subjects. Clin Pharmacol Ther. 2003;73:41–50. doi: 10.1067/mcp.2003.10. [DOI] [PubMed] [Google Scholar]
- 9.Sugimoto K, Ohmori M, Tsuruoka S, Nishiki K, Kawaguchi A, Harada K, Arakawa M, Sakamoto K, Masada M, Miyamori I, Fujimura A. Different effects of St John's wort on the pharmacokinetics of simvastatin and pravastatin. Clin Pharmacol Ther. 2001;70:518–24. doi: 10.1067/mcp.2001.120025. [DOI] [PubMed] [Google Scholar]
- 10.Kawaguchi A, Ohmori M, Tsuruoka S, Nishiki K, Harada K, Miyamori I, Yano R, Nakamura T, Masada M, Fujimura A. Drug interaction between St John's Wort and quazepam. Br J Clin Pharmacol. 2004;58:403–10. doi: 10.1111/j.1365-2125.2004.02171.x. [DOI] [PMC free article] [PubMed] [Google Scholar]
- 11.Okudaira T, Kotegawa T, Imai H, Tsutsumi K, Nakano S, Ohashi K. Effect of the treatment period with erythromycin on cytochrome P450 3A activity in humans. J Clin Pharmacol. 2007;47:871–6. doi: 10.1177/0091270007302562. [DOI] [PubMed] [Google Scholar]
- 12.He P, Court MH, Greenblatt DJ, von Moltke LL. Genotype–phenotype associations of cytochrome P450 3A4 and 3A5 polymorphism with midazolam clearance in vivo. Clin Pharmacol Ther. 2005;77:373–87. doi: 10.1016/j.clpt.2004.11.112. [DOI] [PubMed] [Google Scholar]
- 13.Eap CB, Buclin T, Hustert E, Bleiber G, Golay KP, Aubert AC, Baumann P, Telenti A, Kerb R. Pharmacokinetics of midazolam in CYP3A4- and CYP3A5-genotyped subjects. Eur J Clin Pharmacol. 2004;60:231–6. doi: 10.1007/s00228-004-0767-7. [DOI] [PubMed] [Google Scholar]
- 14.Floyd MD, Gervasini G, Masicca AL, Mayo G, George AL, Bhat K, Kim RB, Wilkinson GR. Genotype–phenotype associations for common CYP3A4 and CYP3A5 variants in the basal and induced metabolism of midazolam in European- and African-American men and women. Pharmacogenetics. 2003;13:595–606. doi: 10.1097/00008571-200310000-00003. [DOI] [PubMed] [Google Scholar]
- 15.De los Reyes GC, Koda RT. Determining hyperforin and hypericin content in eight brands of St John's wort. Am J Health Syst Pharm. 2002;59:545–7. doi: 10.1093/ajhp/59.6.545. [DOI] [PubMed] [Google Scholar]
- 16.Mai I, Bauer S, Perloff ES, Johne A, Uehleke B, Frank B, Budde K, Roots I. Hyperforin content determines the magnitude of the St John's wort–cyclosporine drug interaction. Clin Pharmacol Ther. 2004;76:330–40. doi: 10.1016/j.clpt.2004.07.004. [DOI] [PubMed] [Google Scholar]
- 17.Bornemann LD, Crews T, Chen SS, Twardak S, Patel IH. Influence of food on midazolam absorption. J Clin Pharmacol. 1986;26:55–9. doi: 10.1002/j.1552-4604.1986.tb02903.x. [DOI] [PubMed] [Google Scholar]
- 18.Fromm MF, Busse D, Kroemer HK, Eichelbaum M. Differential induction of prehepatic and hepatic metabolism of verapamil by rifampin. Hepatology. 1996;24:796–801. doi: 10.1002/hep.510240407. [DOI] [PubMed] [Google Scholar]
- 19.Niemi M, Backman JT, Fromm MF, Neuvonen PJ, Kivistö KT. Pharmacokinetic interactions with rifampicin. Clin Pharmacokinet. 2003;42:819–50. doi: 10.2165/00003088-200342090-00003. [DOI] [PubMed] [Google Scholar]
- 20.Pichard L, Fabre I, Daujat M, Domergue J, Joyeux H, Maurel P. Effect of corticosteroids on the expression of cytochromes P450 and on cyclosporin A oxidase activity in primary cultures of human hepatocytes. Mol Pharmacol. 1992;41:1047–55. [PubMed] [Google Scholar]
- 21.Biber A, Fischer HR, ömer A, Chatterjee SS. Oral bioavailability of hyperforin from hypericum extracts in rats and human volunteers. Pharmacopsychiat. 1998;31(Suppl.):36–43. doi: 10.1055/s-2007-979344. [DOI] [PubMed] [Google Scholar]
- 22.Greenblatt DJ, von Moltke LL, Harmatz JS, Chen G, Weemhoff JL, Jen C, Kelly CJ, LeDuc BW, Zinny MA. Time course of recovery of cytochrome P450 3A function after single doses of grapefruit juice. Clin Pharmacol Ther. 2003;74:121–9. doi: 10.1016/S0009-9236(03)00118-8. [DOI] [PubMed] [Google Scholar]
- 23.Takedomi S, Matsuo H, Yamano K, Ohtani H, Sawada Y. In-vivo kinetics of the interaction between midazolam and erythromycin in rats, taking account of metabolic intermediate complex formation. J Pharm Pharmacol. 2001;53:643–51. doi: 10.1211/0022357011775974. [DOI] [PubMed] [Google Scholar]