

Abstract
AIMS
To investigate the impact of CYP2C19 mutations *2-*6 and *17 on acid-inhibition and pharmacokinetics of lansoprazole (L15), omeprazole (O10, O20) and pantoprazole (P40) in Caucasians.
METHODS
CYP2C19 genotyping for *2–*6 and *17 mutations was assessed in subjects who were H. pylori negative in two randomized crossover trials. The influence of CYP2C19 mutations on single and repeated administration of L15 and O10 (study A) and O20 and P40 (study B) was investigated. Pharmacokinetics and the cumulative percentage of time with intragastric pH above 4 (% > pH 4) were assessed on day 1 and 6.
RESULTS
For study A CYP2C19 genotyping found five *1/*1, four *1/*2, one *1/*17 and one *2/*17. For study B the results were six *1/*1, two *1/*2, six *1/*17, one *2/*2 and one *2/*17. For all PPIs AUC was highest in *2/*2 and lowest in *1/*17. On day 1, all PPIs significantly increased percentage >pH 4 compared with baseline. *1/*1 genotype showed no significant acid-inhibition after L15, O10 and O20. *1/*17 genotype showed no significant acid-inhibition after O20 and P40. *1/*2 genotype showed significant acid-inhibition after L15 and O10. On day 6, all four PPIs showed significantly increased acid-inhibition. *1/*1 and *1/*17 showed a significantly increased percentage > pH 4 after treatment with O20 and P40. However, in *1/*1 subjects percentage > pH 4 was not significantly increased after L15 and O10. *1/*2 genotype showed a significant acid-inhibitory effect after repeated dosing with L15 and O10.
CONCLUSIONS
Caucasian subjects with *1/*1 and *1/*17 genotype need stronger acid-suppression therapy, especially during the first days of treatment or with on-demand therapy.
WHAT IS ALREADY KNOWN ABOUT THIS SUBJECT
The influence of CYP2C19 on the kinetics and dynamics of omeprazole, lansoprazole and rabeprazole has been studied in Japanese subjects.
It has been suggested that subjects with *1/*1 genotype might need stronger acid suppression than *1/*2 and *2/*2 subjects. This suggestion comes from data in Japanese subjects and has not been confirmed in Caucasians.
Furthermore, a novel CYP2C19 mutation, *17, which mainly occurs in Caucasians has been discovered. This mutation has been associated with clinical failure, but its relevance for therapy with PPIs has not been studied yet.
WHAT THIS STUDY ADDS
In this study, the influence of CYP2C19 on both the pharmacokinetics and dynamics in Caucasian subjects after single and repeated dosing has been investigated.
This is the first study showing that Caucasian subjects with *1/*1 and *1/*17 mutations need stronger acid-inhibition. In this study three proton pump inhibitors (omeprazole, lansoprazole and pantoprazole, in different doses) were studied of which pantoprazole had not been studied before in this setting, not even in Japanese.
Keywords: CYP2C19 polymorphlsm, proton pump inhibitors, intragastric pH, CYP2C19*2 mutation, CYP2C19*17 mutation, pharmacogenetics
Introduction
Proton pump inhibitors (PPIs) are metabolized in the liver by the cytochrome P450 system (CYP), specifically CYP2C19 and CYP3A4. Omeprazole for example is mainly metabolized to 5-hydroxyomeprazole by CYP2C19 and to omeprazole sulphone by CYP3A4. CYP2C19 shows genetically determined polymorphisms, which affect the pharmacokinetics and pharmacodynamics of PPIs [1–8].
The genetic basis for the polymorphic expression of CYP2C19 activity has been determined. Several single nucleotide polymorphic variants (SNPs) of the CYP2C19 gene have been identified with impact on the capacity to metabolize PPIs [9]. CYP2C19*2, *3, *4, *5 and *6 mutations are associated with reduced metabolism of omeprazole, leading to higher AUCs and more profound acid inhibition [9–11]. CYP2C19*17 mutations are likely to cause increased metabolism of omeprazole, which may result in lower AUCs and reduced acid inhibition [12]. The prevalence of CYP2C19 mutations differs among populations and considering the Eurasian part of the world, an increase in *2 and *3 mutations is seen from West to East. In the Caucasian population about 30–40% has the *1/*2 genotype and 2–5% has the *2/*2 genotype [13]. In the Chinese population, about 50% has the *1/*2 or *1/*3 and 24% has the *2/*2, *2/*3 or *3/*3 genotype. The prevalence of the CYP2C19*17 mutation is the opposite. About 36% of the Caucasian population has the *1/*17 or *17/*17 genotype, about 8% of the Chinese, and about 1% of the Japanese population [12, 14].
Standard doses for the initial treatment of GERD are once daily doses of lansoprazole 30 mg, omeprazole 20 mg, or pantoprazole 40 mg. In many countries the recommended doses for maintenance treatment are once daily doses of lansoprazole 15 mg, omeprazole 10 or 20 mg and pantoprazole 20 or 40 mg. Furthermore, omeprazole 10 mg and 20 mg have been registered in several countries as the first PPIs available over-the-counter. Standard approved doses of PPIs are based on studies performed in subjects with an unknown CYP2C19 genotype [15]. Regarding the current knowledge of pharmacogenetics, it can be speculated that therapy with approved doses of PPIs in Caucasian subjects with fast metabolism (e.g. subjects with *1/*1 genotype or subjects with *17 mutations) could lead to a diminished acid-inhibitory effect and this may result in therapeutic failure. The aim of this study was to investigate the impact of CYP2C19 mutations *2, *3, *4, *5, *6 and *17 on the acid-inhibitory effects and pharmacokinetics of lansoprazole, omeprazole and pantoprazole in a Caucasian population.
Methods
Study protocol
We performed in Caucasian subjects two comparative randomized, two-way crossover, investigator-blinded studies. In study A the acid-inhibitory effect of lansoprazole 15 mg (L15) was compared with omeprazole 10 mg (O10). In study B the acid-inhibitory effect of omeprazole 20 mg (O20) was compared with pantoprazole 40 mg (P40). To assess the influence of CYP2C19 polymorphism on the pharmacodynamics and kinetics of these PPIs CYP2C19 genotype was established in all subjects. In this paper we discuss the effect of CYP2C19 genotype on pharmacodynamics and kinetics.
Both studies were designed to include healthy H. pylori-negative subjects whose intragastric pH was below pH 4 for more than 70% of the time during a 24 h baseline period. CYP2C19 genotyping procedures identifying the wild-type gene, CYP2C19*1, and the mutated alleles CYP2C19*2, CYP2C19*3, CYP2C19*4, CYP2C19*5, CYP2C19*6 and CYP2C19*17 were performed by a polymerase chain reaction-restriction fragment length polymorphism (PCR-RFLP) method, by the laboratories of Clinical Chemistry of Haga Teaching Hospital and Erasmus University Medical Center as previously described [12, 16]. The Ethics Committee of Haga Teaching Hospital approved the study protocol.
In study A, the subjects were first assigned to 6 day treatment with either lansoprazole capsules 15 mg once daily or omeprazole capsules 10 mg once daily, followed after a wash-out period of at least 14 days by treatment with the other drug for 6 days. In study B, subjects were assigned to a 6 day treatment with either omeprazole MUPS 20 mg once daily or pantoprazole tablets 40 mg once daily in a similar two-way crossover design with treatment with the second drug for 6 days after a wash-out period of at least 14 days. In both studies 24 h intragastric pH monitoring took place at day 0 (baseline) prior to drug administration and at days 1 and 6 of administration as previously described [17].
In study A, blood samples (5 ml) for the determination of O10 and L15 pharmacokinetics were drawn at day 1 and at day 6 at predose and at 1, 1.5, 2, 3, 4, 6, and 8 h after intake of the study drug.
In study B, blood samples (5 ml) for the determination of O20 and P40 pharmacokinetics were drawn at day 1 and day 6 at predose and at 0.5, 0.75, 1, 1.5, 2, 2.5, 3, 4, 5, 6, 7, 8 and 9 h after dose. Plasma concentrations for study A were determined by means of liquid chromatography techniques at the laboratory of the Central Hospital Pharmacy, The Hague [18, 19]. Plasma concentrations for study B were determined by means of liquid chromatography techniques at the Bio-analytical Chemistry Laboratory, Astra Hässle AB, Mölndal, Sweden [19, 20].
Subjects
Twelve Dutch Caucasian subjects participated in study A and 11 subjects were genotyped (one subject refused genotyping for personal reasons). Sixteen Dutch Caucasian subjects participated in study B and all subjects were genotyped. Subject characteristics and genotypes are shown in Table 1. All subjects gave written informed consent.
Table 1.
Subject characteristics and genotypes
| Study A | Study B | |
|---|---|---|
| All (M/F)* | 11 (5/6) | 16 (7/9) |
| *1/*1 (M/F)† | 5 (3/2) | 6 (3/3) |
| *1/*2 (M/F) | 4 (1/3) | 2 (0/2) |
| *1/*17 (M/F) | 1 (1/0) | 6 (3/3) |
| *2/*2 (M/F) | 0 | 1 (1/0) |
| *2/*17 (M/F) | 1 (0/1) | 1 (0/1) |
| Age (years) mean (range) | 24.2 (20–29) | 24.7 (21.4–30) |
| Weight (kg) mean (range) | 70 (50–90) | 73 (55–97) |
| Height (cm) mean (range) | 174 (157–190) | 176 (157–192) |
(M/F = male/female).
*3, *4, *5 or *6 mutations were not found.
Data analysis and statistical evaluation of pH data
Evaluation of pH data was performed as previously described [17]. Cumulative percentages of time during which intragastric pH was above 4 for 24 h time periods, were compared between baseline data and the studied PPIs at days 1 and 6 for the total group and for the subgroups with a specific CYP2C19 genotype. To determine the net response to the study drug, the cumulative percentage of time with pH above threshold 4 at baseline was subtracted from the cumulative percentage of time with pH above threshold 4 at day 1 and day 6 for each individual subject. This gain is represented as Δ percentage of time with intragastric pH > 4. A change in this Δ percentage of time of less than 10% was considered as a nonresponse, given the accuracy of the technique of intragastric pH monitoring and the variability in 24 h intragastric acidity [21]. We defined individuals showing a Δ of ≥10% as responders and individuals with a Δ of <10% as nonresponders.
Data were analyzed using the SPSS statistical package (SPSS 12.0.1 for Windows, SPSS Inc, Chicago, USA). In various genotype groups the data were too scarce for performing nonparametric tests. Therefore parametric tests were used: paired-samples t-test for testing changes from baseline at day 1 and day 6 and independent-samples t-test for comparison of these changes between genotypes. However, with scarce data these t-tests lean heavily on the assumption of a normal (Gaussian) distribution of the changes from baseline considered. In order to enhance the plausibility of this assumption, a logit transformation of the cumulative percentage of time with pH above the threshold of 4 was made prior to calculating changes from baseline and performing t-tests. If x denotes the cumulative percentage of time with pH above threshold 4, then the logit of x is defined as the (natural) logarithm of the odds: log(x/(100–x)). The logit transformation is an appropriate variance-stabilizing transformation for proportions.
As it should, test results based on it would remain the same, when pH-levels below threshold 4 would have been used for calculating the percentage of time. Mean changes from baseline and their confidence limits on the logit scale can be back-transformed by exponentiation, yielding the odds ratios with their confidence limits. The significance level of each test was set at 0.05. Two-sided P values were presented as calculated with each test, no correction being made for multiple testing.
Pharmacokinetic data
Pharmacokinetic parameters shown as clearance/F (CL/F, in l h−1, F is bioavailability), half life (t1/2, in h), time of maximum observed concentration (tmax, h), and the maximum observed concentration (Cmax, mg l−1) were derived by noncompartmental analysis using WinNonlin software (version 5.1, Pharsight Corporation, Mountain View, USA). For each individual the terminal elimination rate constant (λz) was determined by log-linear regression of the terminal phase of the plasma concentration–time curve separately on day 1 (study A and B) and day 6 (study B). The area under the concentration–time curve (AUC, in mg l−1 h) was estimated by the linear-logarithmic trapezoidal method up to the last measured data point with extrapolation to 24 h using λz. Differences between genotypes were evaluated using the independent-samples t-test. The level of significance was set at 0.05.
Results
Pharmacokinetics
Differences in AUCs between the genotypes in study A and B are displayed in Table 2 and in Figure 1.
Table 2.
AUC (mean values ± SD) at day 1 (Study A and B) and day 6 (Study B) for genotypes
| Study A AUC (mg l−1 h) | *1/*1 (n = 5) | *1/*2 (n = 4) | *1/*17 (n = 1) | *2/*17 (n = 1) | P value *1/*1 vs.*1/*2 |
|---|---|---|---|---|---|
| O10 day 1 | 0.25 ± 0.18 | 0.52 ± 0.31 | 0.14 | 0.41 | 0.141 |
| L15 day 1 | 1.04 ± 0.77 | 1.75 ± 1.05 | 0.47 | 1.39 | 0.282 |
| Study B AUC (mg l−1 h) | *1/*1 (n = 6) | *1/*2 (n = 2) | *1/*17 (n = 6) | *2/*2 (n = 1) | *2/*17 (n = 1) | P-value *1/*1 vs.*1/*17 |
|---|---|---|---|---|---|---|
| O20 day 1 | 0.64 ± 0.34 | 3.42; 1.30 | 0.49 ± 0.22 | 3.44 | 1.06 | 0.365 |
| O20 day 6 | 1.11 ± 0.52 | 5.04; 2.29 | 0.86 ± 0.56 | 4.22 | 2.03 | 0.465 |
| P40 day 1 | 4.56 ± 1.60 | 25.72; 7.16 | 3.42 ± 2.10 | 13.56 | 6.29 | 0.314 |
| P40 day 6 | 4.21 ± 1.91 | 26.87; 8.49 | 3.32 ± 1.33 | 20.71 | 5.95 | 0.374 |
Figure 1.
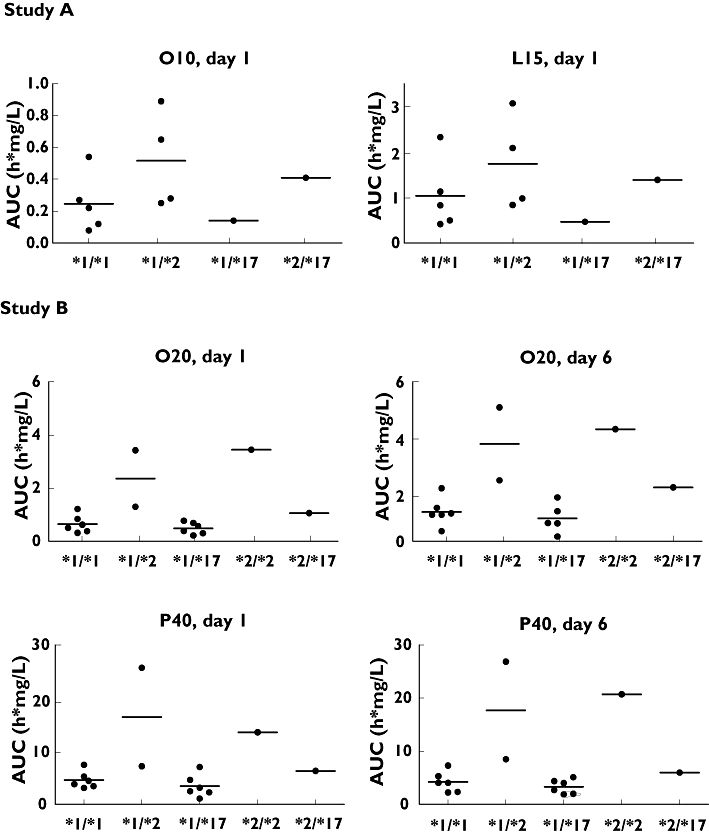
Individual and mean (horizontal bar) AUC of *1/*1, *1/*2, *1/*17, *2/*2 and *2/*17 genotypes after administration of L15, O10, O20 and P40 on day 1 (study A and B) and day 6 (study B)
For all studied PPIs, the same pattern was seen between genotype and AUC on day 1 and on day 6 with AUC being highest in *2/*2, and lowest in *1/*17. Differences between AUCs of *1/*1 and *1/*2 in study A and between *1/*1 and *1/*17 in study B were not significant (all P values ≥0.14). The clearance showed the same genotypic trend as the AUC with lowest clearance in *2/*2 and highest in *1/*17 (data not displayed). The *2 and *17 mutations did not influence the pharmacokinetic parameters t1/2, tmax and Cmax (data for total group shown in Table 3).
Table 3.
Pharmacokinetic parameters (mean values ± SD) at day 1 (Study A and B) and day 6 (Study B) for total group
| tmax (h) | Cmax (mg l−1) | CL/F (l h−1) | t1/2 (h) | |
|---|---|---|---|---|
| O10 day 1 | 1.55 ± 0.63 | 0.18 ± 0.11 | 72.39 ± 61.73 | 1.21 ± 0.11 |
| L15 day 1 | 1.29 ± 0.27 | 0.40 ± 0.17 | 32.05 ± 10.09 | 1.72 ± 0.99 |
| O20 day 1 | 1.48 ± 1.38 | 0.46 ± 0.27 | 36.10 ± 24.06 | 1.33 ± 1.46 |
| O20 day 6 | 1.33 ± 1.23 | 0.75 ± 0.31 | 24.73 ± 28.17 | 1.15 ± 0.58 |
| P40 day 1 | 1.78 ± 1.19 | 2.85 ± 0.90 | 10.73 ± 8.29 | 1.45 ± 0.65 |
| P40 day 6 | 2.14 ± 1.90 | 2.92 ± 0.88 | 10.40 ± 6.21 | 1.59 ± 1.17 |
Acid-inhibition at day 1
Cumulative mean percentage of time with intragastric pH > 4 (± 1 s.d.) at baseline and during day 1 for the four treatment regimens of the total group and of each genotype are shown in Table 4. Odds ratios with 95% CI and P-values (compared with baseline) are shown in Table 5. Δ percentage intragastric pH > 4 for each subject and genotype is shown in Figure 2. Compared with baseline and not differentiating for genotype, L15, O10, O20 and P40 significantly increased the mean percentage of time with intragastric pH above 4 (all P values 0.042 or less). Differentiating for genotype, the *1/*1 genotype showed no significant acid-inhibitory effect after a single dose of L15 (P = 0.116), O10 (P = 0.497) and O20 (P = 0.315). In subjects with *1/*17 genotype, no significant acid-inhibitory effect was seen after a single dose of O20 (P = 0.102) and P40 (P = 0.258). Only with P40 was there a significant acid-inhibitory effect after a single dose in *1/*1 subjects (P = 0.034). Subjects with the *1/*2 genotype showed a significant acid-inhibitory effect after L15 (P = 0.022) and O10 (P = 0.036). In both studies *1/*1 and *1/*17 genotypes showed lower responses than *1/* 2, *2/*17 or *2/*2 genotypes. However, either the differences between *1/*1 and *1/*2 for L15 and for O10 as well as the differences between *1/*1 and *1/*17 for O20 and for P40 were not significant (all P values ≥1 0.204) or the numbers were too small to test the differences. Table 6 shows the percentage of subjects with a response (Δ percentage of acid-inhibition >10%) to the administered PPI.
Table 4.
Mean percentage of time (± SD) with intragastric pH > 4 during 24 h for total group and genotypes
| Study A | All (n = 11) | *1/*1 (n = 5) | *1/*2 (n = 4) | *1/*17 (n = 1) | *2/*17 (n = 1) |
|---|---|---|---|---|---|
| Baseline | 13.2 ± 7.4 | 14.9 ± 9.9 | 11.9 ± 6.3 | 13.9 | 9.5 |
| L15 day 1 | 34.2 ± 17.3 (P = 0.002*) | 35.6 ± 21.1† | 38.3 ± 16.4 | 15.9 | 29.7 |
| L15 day 6 | 44.2 ± 15.0 (P < 0.0005*) | 43.1 ± 20.1‡ | 49.4 ± 6.8 | 26.7 | 46.1 |
| O10 day 1 | 22.4 ± 10.9 (P = 0.042*) | 19.1 ± 10.1§ | 29.7 ± 11.5 | 12.3 | 19.5 |
| O10 day 6 | 40.3 ± 20.9 (P = 0.006*) | 36.0 ± 20.0¶ | 46.8 ± 18.8 | 11.5 | 64.9 |
| Study B | All (n = 16) | * 1/* 1 (n = 6) | * 1/* 2 (n = 2) | * 1/* 17 (n = 6) | * 2/* 2 (n = 1) | * 2/* 17 (n = 1) |
|---|---|---|---|---|---|---|
| Baseline | 13.5 ± 6.1 | 14.0 ± 5.5 | 10.7; 15.3 | 14.5 ± 8.1 | 6.1 | 13.0 |
| O20 day 1 | 27.9 ± 16.3 (P = 0.003*) | 20.4 ± 8.9†† | 48.1; 62.5 | 21.5 ± 13.4 | 35.3 | 48.6 |
| O20 day 6 | 51.3 ± 16.6 (P < 0.0005*) | 50.2 ± 21.0‡‡ | 62.2; 61.9 | 47.3 ± 17.3 | 47.7 | 62.0 |
| P40 day 1 | 31.4 ± 14.6 (P = 0.001*) | 31.5 ± 10.3§§ | 50.9; 55.8 | 20.9 ± 12.8 | 43.7 | 37.4 |
| P40 day 6 | 47.8 ± 16.4 (P < 0.0005*) | 44.5 ± 11.9¶¶ | 68.1; 62.0 | 46.1 ± 20.8 | 59.8 | 30.3 |
P values: compared with baseline.
P value *1/*1 vs. *1/*2 after logit-transformation: 0.627,
0.602,
0.289,
0.532.
P value *1/*1 vs. *1/*17 after logit-transformation: 0.981,
0.822,
0.204,
0.900.
Table 5.
Odds ratios (range 95% CI) indicating changes from baseline and P-values
| Study A | *1/*1 (n = 5) | *1/*2 (n = 4) |
|---|---|---|
| L15 day 1 | 3.25 (0.63, 16.64) (P = 0.116) | 4.73 (1.52, 14.70) (P = 0.022) |
| L15 day 6 | 5.14 (0.85, 31.02) (P = 0.065) | 7.89 (2.87, 21.71) (P = 0.007) |
| O10 day 1 | 1.49 (0.33, 6.67) (P = 0.497) | 3.24 (1.15, 9.12) (P = 0.036) |
| O10 day 6 | 3.54 (0.39, 31.86) (P = 0.185) | 6.75 (1.61, 28.37) (P = 0.024) |
| Study B | *1/*1 (n = 6) | *1/*17 (n = 6) |
|---|---|---|
| O20 day 1 | 1.59 (0.54, 4.66) (P = 0.315) | 1.61 (0.87, 2.98) (P = 0.102) |
| O20 day 6 | 6.66 (1.75, 25.32) (P = 0.015) | 5.82 (2.99, 11.32) (P = 0.001) |
| P40 day 1 | 2.96 (1.13, 7.75) (P = 0.034) | 1.51 (0.66, 3.47) (P = 0.258) |
| P40 day 6 | 5.32 (2.29, 12.37) (P = 0.004) | 5.70 (1.88, 17.26) (P = 0.010) |
Figure 2.
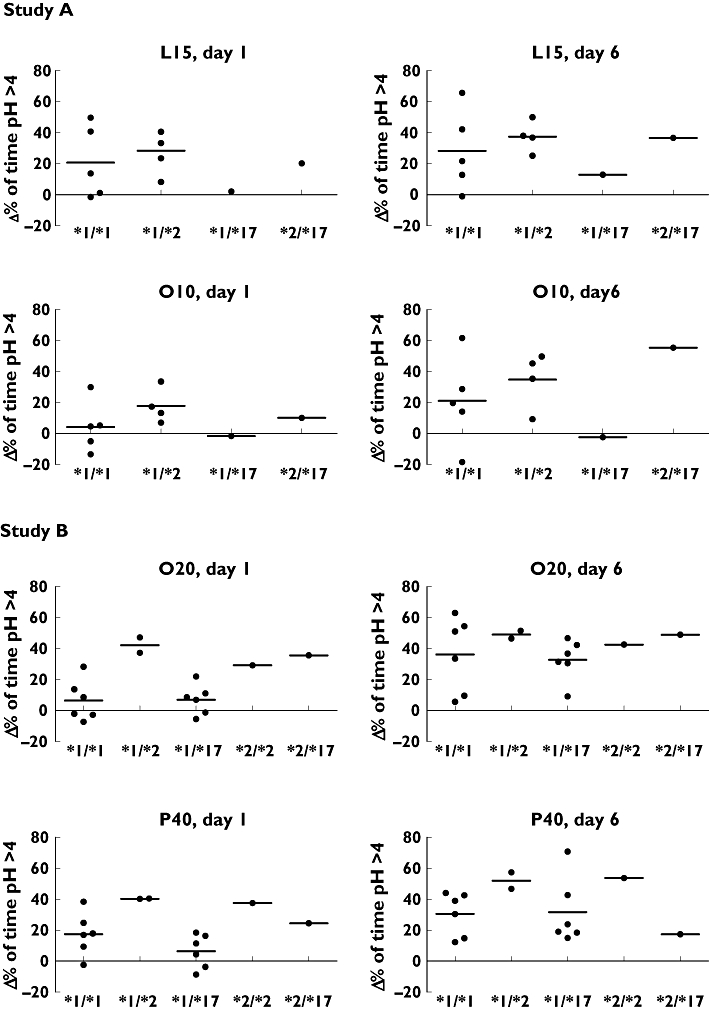
Individual and mean (horizontal bar) responses of *1/*1, *1/*2, *1/*17, *2/*2 and *2/*17 genotypes to L15, O10, O20 and P40 on day 1 and day 6, corrected for baseline (Δ percentage of time pH > 4)
Table 6.
Number and percentage of subjects with an acid-inhibitory response of >10%
| PPI | All | *1/*1 | *1/*2 | *1/*17 | *2/*2 | *2/*17 |
|---|---|---|---|---|---|---|
| Study A | n = 11 | n = 5 | n = 4 | n = 1 | – | n = 1 |
| L15 | ||||||
| Day 1 | 7 (64%) | 3 (60%) | 3 (75%) | 0 (0%) | 1 (100%) | |
| Day 6 | 10 (91%) | 4 (80%) | 4 (100%) | 1 (100%) | 1 (100%) | |
| O10 | ||||||
| Day 1 | 5 (45%) | 1 (20%) | 3 (75%) | 0 (0%) | 1 (100%) | |
| Day 6 | 8 (73%) | 4 (80%) | 3 (75%) | 0 (0%) | 1 (100%) | |
| Study B | n = 16 | n = 6 | n = 2 | n = 6 | n = 1 | n = 1 |
| O20 | ||||||
| Day 1 | 8 (50%) | 2 (33%) | 2 (100%) | 2 (33%) | 1 (100%) | 1 (100%) |
| Day 6 | 13 (81%) | 4 (67%) | 2 (100%) | 5 (83%) | 1 (100%) | 1 (100%) |
| P40 | ||||||
| Day 1 | 11 (69%) | 4 (67%) | 2 (100%) | 3 (50%) | 1 (100%) | 1 (100%) |
| Day 6 | 16 (100%) | 6 (100%) | 2 (100%) | 6 (100%) | 1 (100%) | 1 (100%) |
Acid-inhibition at day 6
Cumulative mean percentage of time with intragastric pH > 4 (± SD) at baseline and during day 6 for the four treatment regimens of the total group and of each genotype are shown in Table 4. Odds ratios with 95% CI and P values (compared with baseline) are shown in Table 5. Δ percentage intragastric pH > 4 for each subject and genotype is shown in Figure 2. Compared with baseline and not differentiating for genotype, the mean percentage of time with an intragastric pH above pH 4 was significantly increased in all subjects with all four regimens studied (all P values ≤ 0.006). Differentiating for genotype, *1/*1 and *1/*17 showed a significantly increased percentage of time with intragastric pH above 4 after treatment with O20 (P = 0.015 and P = 0.001, respectively) and P40 (P = 0.004 and 0.010, respectively). However, in *1/*1 subjects treated with L15 and O10 this percentage of time was not significantly increased (P = 0.065 and P = 0.185, respectively). The *1/*2 genotype showed a significant acid-inhibitory effect after repeated dosing with L15 (P = 0.007) and O10 (P = 0.024). No significant difference between *1/*1 and *1/*2 for L15 and for O10 and between *1/*1 and *1/*17 for O20 and P40 was seen was seen at day 6 (all P values 0.532 or more). Table 6 shows the percentage of subjects with a response (Δ percentage of acid-inhibition >10%) to the administered PPI.
Discussion
The aim of the study was to examine the influence of CYP2C19 mutations on the acid-inhibitory effects and pharmacokinetics of lansoprazole, omeprazole and pantoprazole in a Caucasian population. The study showed an effect of CYP2C19 polymorphism on the pharmacodynamics of standard dose pantoprazole, low dose lansoprazole, and low/standard dose omeprazole. This effect was not supported by pharmacokinetic data, probably due to the fact that the power of the studies was based on the comparison omeprazole vs. lansoprazole and omeprazole vs. pantoprazole. Further studies are needed to give a decisive answer on the significance of CYP2C19 polymorphism in Caucasians.
Genotypic analysis of the subjects in study A demonstrated 45% *1/*1, 36% *1/*2, 9% *1/*17, 0% *2/*2 and 9% *2/*17 mutations. Genotypic analysis of the subjects in study B showed 37.5% *1/*1, 12.5% *1/*2, 37.5% *1/*17, 6% *2/*2 and 6% *2/*17 mutations. During genotyping for *3, *4, *5 and *6 mutations we did not find any of these mutations in our population [11]. It is known that the *3 mutation mainly occurs in Asian subjects. The allelic frequency in our studies reflected the Western genotypes with a slight under representation of the *1/*2 genotype, which is reported to occur in 30–40% of the Western population.
Irrespective of genotype, L15, O10, O20 and P40 produced significant acid inhibition after a single dose and all PPIs studied produced significant acid reduction after repeated dosing.
We have shown in Caucasian subjects with *1/*1 genotype, that on the first day of administration the acid suppression with lansoprazole 15 mg and omeprazole 10 or 20 mg is not significant. In contrast to lansoprazole 15 mg and omeprazole 10 mg, acid suppression with omeprazole 20 mg reached significance after repeated dosing. Only pantoprazole 40 mg showed significant acid-inhibition in *1/*1 subjects after both single and repeated administration. However, in *1/*17 subjects there was no significant acid-inhibitory effect after single administration. At day 6 of administration the acid-inhibitory effect of pantoprazole 40 mg reached significance in *1/*17.
Omeprazole is the only PPI known to have auto-inhibition of its metabolism [22]. Our study showed that for *1/*1 subjects in contrast to pantoprazole 40 mg, clearance for omeprazole 20 mg was reduced resulting in an increased AUC on day 6 compared with day 1. The increased AUC and the pharmacological steady state explain the more potent inhibition of gastric acid production after repeated dosing with omeprazole. Our pharmacodynamic data nicely illustrate that in *1/*1 subjects a dose of 10 mg omeprazole is too low to benefit from this effect.
Regarding *2 mutations, our data were in keeping with the findings from Japanese studies that *2 mutations lead to increased AUC and more profound acid inhibition of PPIs [9]. With L15, significant acid-inhibition was seen in *1/*2 subjects after single as well as after repeated administration. The same occurs with O10. It can be concluded that in *1/*2 subjects, compared with *1/*1 subjects, metabolism of omeprazole is already reduced resulting in a significant acid-inhibitory effect after a single dose. Due to auto-inhibition of its metabolism after repeated dosing, a dose as low as 10 mg will lead to a further increase of intragastric pH.
The novel *17 mutation is associated with therapeutic failure of PPIs [12]. This assumption is based on a decreased metabolic ratio of omeprazole in Caucasian subjects with the *17 genotype. Our study in subjects treated with omeprazole and pantoprazole demonstrated that a *17 mutation may lead to less acid-inhibition and a decreased AUC compared with *1/*1 genotypic subjects. In contrast to the findings in *1/*1 subjects, we found no significant acid-inhibitory effect in *1/*17 subjects after single administration of P40. Repeated administration of pantoprazole showed significant acid-inhibition for *1/*17 subjects with unchanged AUC compared with single administration. This demonstrated that the increase in acid-inhibitory effect after repeated dosing of pantoprazole was caused by a pharmacodynamic effect (reaching a pharmacological steady state) rather than a kinetic effect (c.f. omeprazole).
The majority (e.g. up to 70%) of the Caucasian population has the*1/*1 or *1/*17 genotype and only 30% to 40% has a *2 mutation. In the Asian population however, *2, and *3 mutations are seen with an allelic frequency up to 75%. In contrast to the *1/*1 or *1/*17 mutation, *2 and *3 mutations are associated with decreased metabolism of PPIs. The differences in pharmacokinetics between subjects with *1/*1 or *1/*17 genotypes on the one hand and subjects with *1/*2 genotypes on the other hand, explains another finding of our study, i.e. that omeprazole 10 or 20 mg and lansoprazole 15 mg have no significant acid-suppressive effect after a single dose in these genotypes as well as pantoprazole in subjects with the *1/*17 genotype. Subjects with *1/*1 or *1/*17 genotypes may need higher doses of PPIs or drugs that inhibit CYP2C19 or CYP3A4 metabolism (e.g. some macrolides) to reach the same acid-inhibitory effect as we found in subjects with *2 mutations. The difference in occurrence of *2 and *17 mutations in Asian and Caucasian populations makes it difficult to extrapolate results found in studies performed in Japanese and Chinese populations to the Caucasian population.
A considerable proportion of our subjects, mainly with the *1/*1 and *1/*17 genotype, did not show a more than 10% gain in the proportion of time that intragastric pH was above 4 in a 24 h period. Even with a single dose of pantoprazole 40 mg, 31% of the subjects did not reach this criterion. We think that this criterion is a pertinant parameter for clinically relevant acid-inhibition, given the accuracy of the technique of intragastric pH monitoring and the variability in 24 h intragastric acidity [21]. With all studied PPIs, the number of nonresponders decreased substantially after repeated administration.
In conclusion, this study showed that the acid-inhibitory effects of lansoprazole, omeprazole and pantoprazole in Caucasians were influenced by CYP2C19 status. Due to this effect, single and repeated administration of omeprazole 10 mg and lansoprazole 15 mg in *1/*1 subjects did not provide significant acid-inhibition when compared with baseline. After a single dose, acid-inhibition in *1/*1 or *1/*17 subjects with omeprazole 20 mg was not significant, but became significant after repeated administration. Pantoprazole 40 mg provided significant acid-inhibition in *1/*1 but not in *1/*17 subjects after a single dose,. After repeated dosing pantoprazole 40 mg showed significant acid inhibition in *1/*17 subjects as well. Because of a remarkably lower (and often inadequate) acid-inhibitory effect in subjects with *1/*1 and *1/*17 genotype for CYP2C19, who comprise together up to 70% of the Caucasian population, stronger acid-suppression therapy needs to be considered, especially during the first days of therapy or with on-demand therapy.
Acknowledgments
Conflicts of interest: None of the authors has any financial or other relationships that could lead to conflicts of interest in the context of this study.
Financial support: Study A was supported in part by a grant from sanofi-aventis (Gouda, the Netherlands) provided to Haga Teaching Hospital and to the Central Hospital Pharmacy. Study B was supported in part by a grant from AstraZeneca (Mölndal, Sweden) provided to Haga Teaching Hospital. Genotyping was supported by a grant from Altana Pharma (Hoofddorp, the Netherlands). Data collection, data analysis and preparation and writing of this paper were performed independently of the sponsoring companies.
We are indebted to the following people: Cecile Bekkers for the invitation of the subjects for genotyping, Martin van Vliet, Coby Postma and Anja Spaans for the genotyping of CYP2C19, Gerlinde Peters for the analytical assistance, and Johan Kooiman for his assistance in the pH data software.
REFERENCES
- 1.Furuta T, Shirai N, Sugimoto M, Nakamura C, Hishida A, Ishizaki T. Influence of CYP2C19 pharmacogenetic polymorphism on proton pump inhibitor-based therapies. Drug Metab Pharmacokinet. 2005;20:153–67. doi: 10.2133/dmpk.20.153. [DOI] [PubMed] [Google Scholar]
- 2.Ishizaki T, Horai Y. Review article: cytochrome P450 and the metabolism of proton pump inhibitors-emphasis on rabeprazole. Aliment Pharmacol Ther. 1999;13(Suppl. 3):27–36. doi: 10.1046/j.1365-2036.1999.00022.x. [DOI] [PubMed] [Google Scholar]
- 3.Furuta T, Shirai N, Xiao F, Ohashi K, Ishizaki T. Effect of high-dose lansoprazole on intragastric pH in subjects who are homozygous extensive metabolizers of cytochrome P4502C19. Clin Pharmacol Ther. 2001;70:484–92. doi: 10.1067/mcp.2001.119721. [DOI] [PubMed] [Google Scholar]
- 4.Adachi K, Katsube T, Kawamura A, Takashima T, Yuki M, Amano K, Ishihara S, Fukuda R, Watanabe M, Kinoshita Y. CYP2C19 genotype status and intragastric pH during dosing with lansoprazole or rabeprazole. Aliment Pharmacol Ther. 2000;14:1259–66. doi: 10.1046/j.1365-2036.2000.00840.x. [DOI] [PubMed] [Google Scholar]
- 5.Shirai N, Furuta T, Moriyama Y, Okochi H, Kobayashi K, Takashima M, Xiao F, Kosuge K, Nakagawa K, Hanai H, Chiba K, Ohashi K, Ishizaki T. Effects of CYP2C19 genotypic differences in the metabolism of omeprazole and rabeprazole on intragastric pH. Aliment Pharmacol Ther. 2001;15:1929–37. doi: 10.1046/j.1365-2036.2001.01108.x. [DOI] [PubMed] [Google Scholar]
- 6.Schwab M, Klotz U, Hofmann U, Schaeffeler E, Leodolter A, Malfertheiner P, Treiber G. Esomeprazole-induced healing of gastroesophageal reflux disease is unrelated to the genotype of CYP2C19: evidence from clinical and pharmacokinetic data. Clin Pharmacol Ther. 2005;78:627–34. doi: 10.1016/j.clpt.2005.08.017. [DOI] [PubMed] [Google Scholar]
- 7.Chang M, Tybring G, Dahl ML, Gotharson E, Sagar M, Seensalu R, Bertilsson L. Interphenotype differences in disposition and effect on gastrin levels of omeprazole – suitability of omeprazole as a probe for CYP2C19. Br J Clin Pharmacol. 1995;39:511–8. doi: 10.1111/j.1365-2125.1995.tb04488.x. [DOI] [PMC free article] [PubMed] [Google Scholar]
- 8.Egan LJ, Myhre GM, Mays DC, Dierkhising RA, Kammer PP, Murray JA. CYP2C19 pharmacogenetics in the clinical use of proton-pump inhibitors for gastro-oesophageal reflux disease: variant alleles predict gastric acid suppression, but not oesophageal acid exposure or reflux symptoms. Aliment Pharmacol Ther. 2003;17:1521–8. doi: 10.1046/j.1365-2036.2003.01645.x. [DOI] [PubMed] [Google Scholar]
- 9.Furuta T, Ohashi K, Kosuge K, Zhao XJ, Takashima M, Kimura M, Nishimoto M, Hanai H, Kaneko E, Ishizaki T. CYP2C19 genotype status and effect of omeprazole on intragastric pH in humans. Clin Pharmacol Ther. 1999;65:552–61. doi: 10.1016/S0009-9236(99)70075-5. [DOI] [PubMed] [Google Scholar]
- 10.Yamada S, Onda M, Kato S, Matsuda N, Matsuhisa T, Yamada N, Miki M, Matsukura N. Genetic differences in CYP2C19 single nucleotide polymorphisms among four Asian populations. J Gastroenterol. 2001;36:669–72. doi: 10.1007/s005350170029. [DOI] [PubMed] [Google Scholar]
- 11.Andersson T, Flockhart DA, Goldstein DB, Huang SM, Kroetz DL, Milos PM, Ratain MJ, Thummel K. Drug-metabolizing enzymes: evidence for clinical utility of pharmacogenomic tests. Clin Pharmacol Ther. 2005;78:559–81. doi: 10.1016/j.clpt.2005.08.013. [DOI] [PubMed] [Google Scholar]
- 12.Sim SC, Risinger C, Dahl ML, Aklillu E, Christensen M, Bertilsson L, Ingelman-Sundberg M. A common novel CYP2C19 gene variant causes ultrarapid drug metabolism relevant for the drug response to proton pump inhibitors and antidepressants. Clin Pharmacol Ther. 2006;79:103–13. doi: 10.1016/j.clpt.2005.10.002. [DOI] [PubMed] [Google Scholar]
- 13.Tamminga WJ, Wemer J, Oosterhuis B, de Zeeuw RA, de Leij LF, Jonkman JH. The prevalence of CYP2D6 and CYP2C19 genotypes in a population of healthy Dutch volunteers. Eur J Clin Pharmacol. 2001;57:717–22. doi: 10.1007/s002280100359. [DOI] [PubMed] [Google Scholar]
- 14.Furuta T, Sugimoto M, Kodaira C, Nishino M, Shirai N, Ikuma M, Hishida A. The influence of the CYP2C19*17 allele on the eradication rates of H. pylori by a triple therapy with lansoprazole, clarithromycin and amoxicillin in Japan. Gastroenterology. 2007;132:T2057. [Google Scholar]
- 15.Anonymous. [12 June 2007]. Package Inserts of omeprazole, lansoprazole and pantoprazole. Dutch Medicine Evaluation Board. Available at http://www.cbg-meb.nl/
- 16.Goldstein JA, Blaisdell J. Genetic tests which identify the principal defects in CYP2C19 responsible for the polymorphism in mephenytoin metabolism. Methods Enzymol. 1996;272:210–8. doi: 10.1016/s0076-6879(96)72025-6. [DOI] [PubMed] [Google Scholar]
- 17.Geus WP, Mathot RA, Mulder PG, Lamers CB. Pharmacodynamics and kinetics of omeprazole MUPS 20 mg and pantoprazole 40 mg during repeated oral administration in Helicobacter pylori-negative subjects. Aliment Pharmacol Ther. 2000;14:1057–64. doi: 10.1046/j.1365-2036.2000.00806.x. [DOI] [PubMed] [Google Scholar]
- 18.Karol MD, Granneman GR, Alexander K. Determination of lansoprazole and five metabolites in plasma by high-performance liquid chromatography. J Chromatogr B Biomed Appl. 1995;668:182–6. doi: 10.1016/0378-4347(95)00068-t. [DOI] [PubMed] [Google Scholar]
- 19.Lagerstrom PO, Persson BA. Determination of omeprazole and metabolites in plasma and urine by liquid chromatography. J Chromatogr. 1984;309:347–56. doi: 10.1016/0378-4347(84)80042-0. [DOI] [PubMed] [Google Scholar]
- 20.Huber R, Muller W, Banks MC, Rogers SJ, Norwood PC, Doyle E. High-performance liquid chromatographic determination of the H+/K+ ATPase inhibitor (BY 1023/SK and F 96 022) and its sulphone metabolite in serum or plasma by direct injection and fully automated pre–column sample clean–up. J Chromatogr. 1990;529:389–401. doi: 10.1016/s0378-4347(00)83845-1. [DOI] [PubMed] [Google Scholar]
- 21.Merki HS, Witzel L, Walt P, Cohnen E, Harre K, Heim J, Mappes A, Röhmel J. Day-to-day variation of 24-hour intragastric acidity. Gastroenterology. 1988;94:887–91. doi: 10.1016/0016-5085(88)90543-4. [DOI] [PubMed] [Google Scholar]
- 22.Andersson T. Pharmacokinetics and bioavailability of omeprazole after single and repeated oral administration in healthy subjects. Br J Clin Pharmacol. 1990;29:557–63. doi: 10.1111/j.1365-2125.1990.tb03679.x. [DOI] [PMC free article] [PubMed] [Google Scholar]