

Abstract
AIMS
To assess the correlation between plasma total warfarin concentration, plasma 7-hydroxywarfarin concentration and INR and the weekly doses of warfarin in patients on long-term anticoagulation.
METHODS
Twenty-five patients on long-term anticoagulation with warfarin were studied. Plasma total warfarin and 7-hydroxywarfarin concentrations and INR were determined. Equations were derived with the weekly warfarin dose as the dependent variable and plasma total warfarin concentration : plasma 7-hydroxywarfarin concentration, INR : plasma total warfarin concentration and INR : plasma 7-hydroxywarfarin concentration as independent variables.
RESULTS
There was a good correlation between INR : plasma total warfarin concentration and the weekly dose of warfarin (y = 46.73e−0.30x, r2 = 0.65). There was a better correlation between INR : plasma 7-hydroxywarfarin concentration and the weekly dose of warfarin (y = 156.52x−0.63, r2 = 0.74)
CONCLUSIONS
Pharmacokinetic parameters along with INR seem to correlate with the weekly doses of warfarin in patients on long-term anticoagulation. These parameters may therefore be useful for predicting warfarin doses.
WHAT IS ALREADY KNOWN ABOUT THIS SUBJECT
Warfarin is a widely used anticoagulant with a low therapeutic index.
There is wide interindividual variation in the pharmacokinetics and pharmacodynamics of warfarin which is also reflected in the warfarin dose requirement.
CYP2C9 and VKORC1 polymorphisms have been shown to affect warfarin dose requirement. However a large amount of the variation in warfarin dose remains unaccounted for.
WHAT THIS STUDY ADDS
Our findings suggest that in patients who are on long-term warfarin therapy, INR : plasma 7-hydroxywarfarin concentration correlates well with warfarin requirement and also accounts for a large amount of variation in warfarin dose.
Keywords: international normalized ratio, warfarin
Introduction
Warfarin is a widely used anticoagulant with a low therapeutic index. There is wide interindividual variation in the pharmacokinetics and pharmacodynamics of warfarin. Polymorphisms of CYP2C9 and VKORC1 have been shown to affect warfarin dose requirement. Previous studies have evaluated the utility of genotyping for CYP2C9 and VKORC1 in predicting warfarin dose in patients on long-term anticoagulation, but have found that these genotypes account for only about 60% of variation in dose [1]. Hence genotyping for CYP2C9 and VKORC1 is not used currently for optimizing warfarin therapy. Many factors other than CYP2C9 and VKORC1 polymorphisms also affect warfarin requirement including polymorphisms in other genes, concomitant drug intake, ethnicity and vitamin K content of the diet [2]. Therefore, models for prediction of warfarin doses using parameters other than gene polymorphisms are necessary. Hence the present study was undertaken to assess the correlation between plasma total warfarin concentration, plasma 7-hydroxywarfarin concentration and INR and the weekly dose of warfarin in patients on long-term anticoagulation.
Methods
Twenty-five patients on long-term warfarin therapy were studied as per a protocol approved by the Institutional Ethics Committee, after obtaining written informed consent. At screening, two INR measurements 15 days apart were done. If these were within the therapeutic range without any change in the dose, then the patient was eligible for recruitment to the study. As per the treatment protocol followed in the hospital, the target range for INR was between 2 and 3 for all indications except for patients with prosthetic mitral valves where the range was 2.5–3.5. Venous blood (7 ml) was collected from all patients 12 h after the last dose of warfarin. This sample was used to perform a third INR as well as estimate the concentration of total warfarin and 7-hydroxywarfarin by high performance liquid chromatography (HPLC) using a C-18 column. Briefly, isopropanol with phosphate buffer was the mobile phase, flow rate was 1 ml min−1, pressure range up to 5000 psi, and wavelength (λ) of the UV lamp was as 308 nm at 30°C. The standard concentrations for the drug and metabolite were 0.05, 0.1, 0.5, 1.0, 2.5 and 5 μg ml−1. The assay was linear in the range of 0.05–5.0 μg ml−1. The interday coefficient of variation was between 8.75% and 12.85%. The intraday coefficient of variation was between 4.23% and 7.14%. Carbamazepine was used as an internal standard. PT-INR (prothrombin time-International Normalized Ratio) was determined using the Liquiplastin reagent obtained from Tulip Diagnostics (P) Ltd, Goa, India. Equations were derived with the weekly warfarin dose as the dependent variable and plasma total warfarin concentration : plasma 7-hydroxywarfarin concentration, INR : plasma total warfarin concentration and INR : plasma 7-hydroxywarfarin concentration as independent variables. The third INR value was used for deriving the equations.
Results
The mean age of the patients (18 males and seven females) was 37.28 ± 10.23 (SD) years (range 22–56 years). The indication for warfarin therapy was mitral valve replacement (n = 8), deep vein thrombosis (n = 6), aortic valve replacement (n = 3), aortic and mitral valve replacement (n = 3), atrial fibrillation (n = 2), venous sinus thrombosis (n = 2) and arterial embolism (n = 1). The mean weekly dose of warfarin was 34.58 ± 14.76 (SD) mg (range 7–70 mg week−1). The mean INR at recruitment was 2.20 ± 0.67 (SD) (range 1.3–3.7). The mean total warfarin concentration was 3.01 ± 2.48 (SD) μg ml−1. The mean 7-hydroxy warfarin concentration was 0.20 ± 0.13 (SD) μg ml−1.
There was an extremely poor correlation between the plasma total warfarin : plasma 7-hydroxywarfarin ratio and the weekly dose of warfarin (y = 26.67e0.01x, r2 = 0.02). There was a better correlation between INR : plasma total warfarin concentration and the weekly dose of warfarin (y = 46.73e−0.30x, r2 = 0.65) (Figure 1). There was a good correlation between INR : plasma 7-hydroxywarfarin concentration and the weekly dose of warfarin (y = 156.52x−0.63, r2 = 0.74) (Figure 2).
Figure 1.
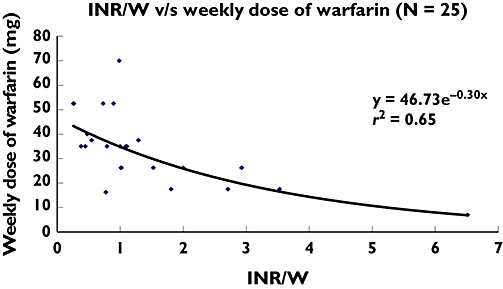
INR : plasma total warfarin concentration vs. weekly dose of warfarin (n = 25). INR = International Normalized Ratio; W = Plasma warfarin concentration (μg ml−1)
Figure 2.
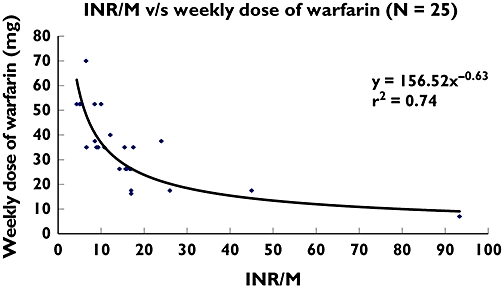
INR : plasma total 7-hydroxywarfarin concentration vs. weekly dose of warfarin (n = 25). INR = International Normalized Ratio; M = Plasma 7-hydroxywarfarin concentration (μg ml−1)
The concomitant drugs taken by patients during the study were furosemide (6), diltiazem (3), digoxin (3), KCl (3), aspirin (2), salbutamol (1), enalapril (1), pentoxyphylline (1), vitamin B complex (1), amlodipine (1), phenytoin (1), benzathine penicillin (1), folic acid (1), spironolactone (1) and chlorpromazine (1). In the patient receiving phenytoin, the 7-hydroxywarfarin concentration was 0.2 μg ml−1 (this was comparable with concentrations seen in other patients), the plasma total warfarin concentration was 6.4 μg ml−1 and the weekly warfarin dose was 52.5 mg.
Discussion
The ratio of the plasma concentration of a drug to that of its metabolite, also known as the metabolic ratio, has been used to quantify metabolism by the hepatic cytochrome enzyme system and thus delineate activity of various CYP isoforms. Several probe drugs, i.e. those that undergo metabolism predominantly by a single pathway have been used to determine the metabolic ratio and classify populations into poor and rapid metabolizers. These include omeprazole (CYP2C19), dextromethorphan (CYP2D6) and flurbiprofen (CYP2C9). Warfarin, too, is metabolized to its major metabolite 7-hydroxywarfarin by CYP2C9. Therefore the ratio of plasma warfarin and plasma 7-hydroxywarfarin concentration should provide an index of the rate of metabolism of warfarin. It would not only take into account polymorphism in the CYP2C9 genotype, but will also account for acquired factors affecting warfarin metabolism like liver function and concomitant use of drugs competing for the same metabolic pathway. However, we found an extremely poor correlation between the plasma total warfarin : 7-hydroxywarfarin concentration and the warfarin dose required to achieve adequate anticoagulation.
This is not surprising, because plasma total warfarin concentrations alone will not have a predictable anticoagulant effect in every individual. Large differences in its pharmacodynamic effect may occur due to variables like VKORC1 haplotype, concomitant drugs and the dietary content of vitamin K. We therefore postulated the ratio of INR : plasma total warfarin concentration as a pharmacodynamic index of warfarin and found that the warfarin dose correlated well with the INR : plasma total warfarin ratio (y = 46.73e−0.30x, r2 = 0.65).
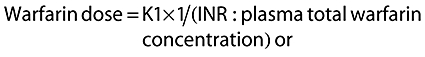
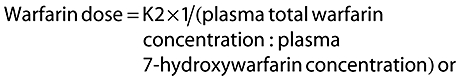
The dose of warfarin required to achieve adequate anticoagulation would be lower in patients with a higher metabolic ratio as well as those with a higher INR : plasma total warfarin concentration ratio. Thus both INR : plasma total warfarin concentration ratio and the metabolic ratio would have an inverse relationship with the dose. To simplify things, we combined the pharmacodynamic index and the metabolic ratio:
Equation 1
 |
 |
Equation 2
 |
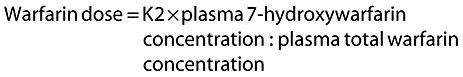 |
Combining the two equations,
 |
i.e.
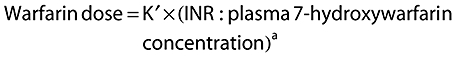 |
Our results revealed that the value of K′ was 156.52 and that of the constant ‘a’ was −0.63.
Numerous factors including CYP2C9 genotype, VKORC1 genotype, diet, age, liver function, BMI and interacting drugs influence the warfarin dose [3]. Some factors may affect the pharmacodynamic index, others may affect the metabolic ratio of warfarin; liver dysfunction can affect both. Previous studies have evaluated the usefulness of genotyping for CYP2C9 and VKORC1 in predicting warfarin doses in patients on long-term anticoagulation, but are not used in optimizing warfarin therapy since these genotypes account for only about 60% of variation in the anticoagulant effect of warfarin [1]. Since our index is a combination of warfarin sensitivity and metabolic ratio of warfarin, this index could possibly adjust for the effects of several other nongenetic factors that could affect warfarin dose. This would explain the high degree of correlation between INR : plasma 7-hydroxywarfarin and the warfarin dose obtained in our study.
One limitation of our study is the small sample size. Secondly, in the present study we only enrolled patients who were on maintenance therapy with warfarin. The real value of our findings would be to predict the therapeutic dose of warfarin in subjects in the initial dose titration phase of therapy based on 7-hydroxywarfarin and INR. A larger study with this objective is in progress.
In conclusion, the ratio of INR : 7-hydroxywarfarin correlates better with the weekly dose of warfarin in patients on long-term anticoagulation than the metabolic ratio (ratio of warfarin : 7-hydroxywarfarin) or the pharmacodynamic index (ratio of INR : warfarin). Phenotypic parameters may therefore be useful for predicting warfarin doses.
Acknowledgments
Competing interests: None declared.
The authors thank Dr Alan E. Rettie, Professor and Chair of Medicinal Chemistry, University of Washington, Seattle for his valuable comments. The larger study of which this paper is a part has received funding from the Department of Biotechnology, Government of India.
REFERENCES
- 1.Gage BF. Pharmacogenetics-based coumarin therapy. Hematology Am Soc Hematol Educ Program. 2006:467–73. doi: 10.1182/asheducation-2006.1.467. PMID: 17124101. [DOI] [PubMed] [Google Scholar]
- 2.Kamali F, Pirmohamed M. The future prospects of pharmacogenetics in oral anticoagulation therapy. Br J Clin Pharmacol. 2006;61:746–51. doi: 10.1111/j.1365-2125.2006.02679.x. [DOI] [PMC free article] [PubMed] [Google Scholar]
- 3.Wadelius M, Pirmohamed M. Pharmacogenetics of warfarin: current status and future challenges. Pharmacogenomics J. 2007;7:99–111. doi: 10.1038/sj.tpj.6500417. [DOI] [PubMed] [Google Scholar]