Abstract
We investigate structural transitions within a single stretched and supercoiled DNA molecule. With negative supercoiling, for a stretching force >0.3 pN, we observe the coexistence of B-DNA and denatured DNA from σ ≈ −0.015 down to σ = −1. Surprisingly, for positively supercoiled DNA (σ > +0.037) stretched by 3 pN, we observe a similar coexistence of B-DNA and a new, highly twisted structure. Experimental data and molecular modeling suggest that this structure has ≈2.62 bases per turn and an extension 75% larger than B-DNA. This structure has tightly interwound phosphate backbones and exposed bases in common with Pauling’s early DNA structure [Pauling, L. & Corey, R. B. (1953), Proc. Natl. Acad. Sci. USA 39, 84–97] and an unusual structure proposed for the Pf1 bacteriophage [Liu, D. J. & Day, L. A. (1994) Science 265, 671–674].
DNA supercoiling plays a fundamental role in the cell. In prokaryotes, plasmid and genomic DNA often is found to be slightly underwound, a property apparently required for proper initiation of replication in Escherichia coli. In the nuclei of eukaryotes, DNA is highly compacted by successive stages of coiling. First, it is organized in nucleosomes by winding twice around the histone core. This bead on a string structure of nucleosomes together with naked DNA segments forms chromatin, which is compacted further by winding into a solenoidal structure ≈34 nm in diameter. This thick chromatin fiber then may coil into plectonemes, condensing DNA even further. DNA supercoiling also is generated in processes such as transcription and replication, where it is relaxed by the specific action of a large class of enzymes: the topoisomerases. Finally, DNA supercoiling is involved in gene regulation because locally unwound DNA is necessary for transcriptional activation and recombinational repair.
For torsionally constrained molecules, such as closed plasmids, topological considerations provide the conceptual framework we shall use to analyze our data. The number of times the two strands of the DNA double-helix are intertwined—the linking number of the molecule (Lk)—is a topological constant, the sum of two geometrical characteristics of the double strand, its writhe (Wr) and its twist (Tw): Lk = Wr + Tw. Wr is a measure of the coiling of the axis of the DNA about itself, like a twisted cord forming interwound structures to relieve its torque. Tw reflects the helical winding of the two strands around each other. For unconstrained linear DNA molecules, assuming the absence of any spontaneous local curvature, Lk = Lk0 = Tw0 (equals the number of helical turns) (1). One defines the relative change in linking number, or the degree of supercoiling: σ = (Lk − Lk0)/Lk0 = ΔLk/Lk0. The value of σ for most circular molecules isolated from cells or virions is ≈−0.06. At constant Lk, the ratio Tw/Wr depends on the force pulling on the molecule, the writhe being suppressed by high forces. As a consequence, pulling on a molecule increases the effective torque applied.
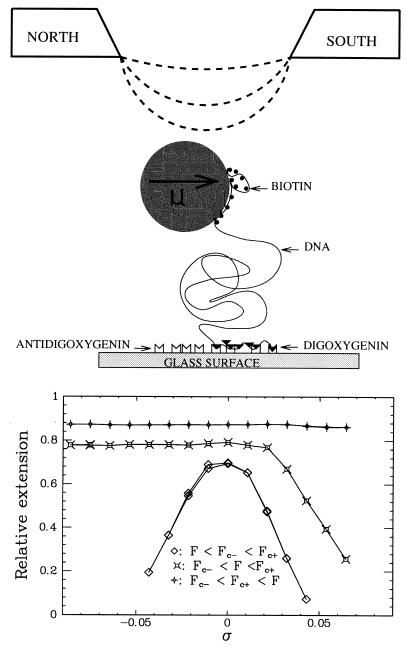
The typical energy scale for macromolecules is the thermal energy: kBT = 4.10−21 J (or RT = 0.6 kcal/mol). As the length scale of biomacromolecules is of the order of 1 nm, the force scale is on the order of the piconewton: 1 pN = 1.10−12 N. To produce and measure such forces on a DNA molecule, we use a single molecule manipulation technique. In brief (see Material and Methods for more details), it consists of stretching a single DNA molecule bound at one end to a surface and at the other to a magnetic bead (see Fig. 1). Small magnets, whose position and rotation can be controlled, are used to pull on and rotate the bead and thus stretch and twist the molecule. Because one turn of the magnets implies one added turn on the molecule, we have, simply, ΔLk = n, where n is the number of turns the magnet rotates. The tethered bead (≈4.5 μm in diameter) exhibits Brownian motion whose amplitude gives access to the force applied on the molecule: the stronger the force, the smaller the fluctuations. This system allowed us to apply and measure forces from a few femtonewtons to ≈100 pN (see ref. 2).
Figure 1.
(Upper) Schematic representation of the experiment. A DIG/biotine end-labeled DNA molecule (≈5 μm long) was attached at one end to a glass surface by DIG/anti-DIG bonds and at the other to a 4.5-μm magnetic bead via streptavidine/biotin links. By varying the distance between the sample and the permanent magnets, the stretching force was controlled whereas rotating the magnets induced DNA supercoiling. The sample was placed on an inverted microscope and was viewed with a ×63 objective. Real-time video analysis of the bead’s image provided a measure of the molecule’s extension and the force via its Brownian fluctuations. Greater forces led to more restricted fluctuations. (Lower) Extension l vs. σ for various forces. Below a critical force Fc− (=0.3 pN in 10 mM PB), the curve was symmetric: for both positive and negative σ, the molecule shortened as it writhed and formed supercoils (plectonemes). Pulling on the molecule increased the torque by reducing the writhe. For forces Fc− < F < Fc+ (=3 pN in 10 mM PB), the molecule shortened only for positive σ. For negative σ, the decrease in twist was adsorbed by the formation of dDNA appearing below σc− = −0.015. At forces F > Fc+, the molecule no longer shortened on winding. dDNA appeared for σ < −0.15 and P-DNA when σ > +0.037. These structural transitions allowed for a stabilization of the torque.
Our experiments were done in 10 mM phosphate buffer at pH = 8.0 (PB) with or without added salt (150 mM NaCl) on a torsionally constrained linear 17-kbp plasmid (or λ-DNA, 48.5 kbp) at values of −5 < σ < +3. Typically, they were of two kinds: we measured either the extension of the molecule (l) vs. the force (F) at constant σ or l vs. σ at constant F.
The behavior of a stretched and twisted DNA molecule at low forces (≲5 pN) is as follows. In this regime, a slightly twisted molecule (σ ≲ 0.06) can reduce its torque by writhing, forming supercoiled structures known as plectonemes. Pulling on the molecule removes the writhe and thus increases the torque and the twist. Above a certain critical force (≈0.3 pN for underwound molecules and ≈3 pN for overwound ones) and above associated critical torques (respectively, ≈8 pN⋅nm and ≈20 pN⋅nm) writhing becomes energetically unfavorable. The molecule elongates as plectonemes (which previously absorbed twist) are converted locally into different structures of DNA. This softening of a physical system (a small change in the force results in a large change in extension) is the hallmark of a phase transition. In the context of DNA, it recently was used to argue for the existence of a new DNA structure, called S-DNA, when the molecule was overstretched with a force ≳70 pN (3, 4).
We will focus in this article on highly twisted structures that occur when writhing of B-DNA is prevented and in which the torque exceeds its critical value. This corresponds to σ < ≳−0.015 and forces >0.3 pN or σ > +0.037 and forces ≳3 pN. Nevertheless, we will restrict ourselves to forces <70 pN, where S-DNA comes into play [the position of this plateau is not influenced by positive or negative torsion (data not shown)]. Our results indicate that twisting a DNA molecule, which is unable to writhe, can result in the reduction of torque via local structural transitions.
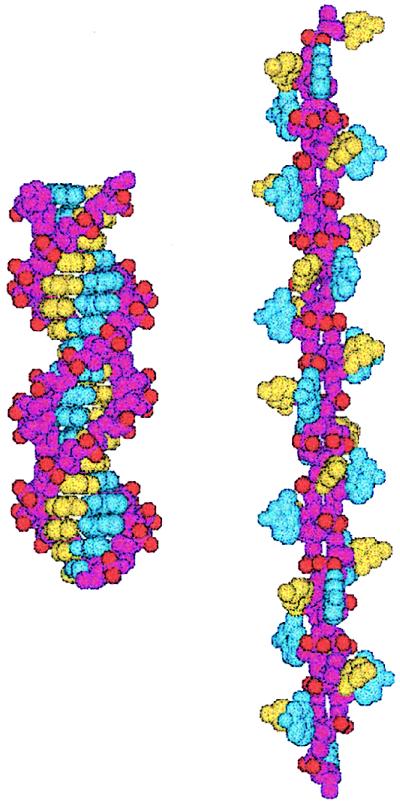
For unwound molecules, with −1 < σ < −0.015, as expected (5), the torque is relieved by a local denaturation of the DNA: for every 10.5 bp (one turn of B-DNA) denatured, one turn of unwinding (ΔLk = −1) is released. For overwound molecules, with +0.037 < σ < +3, the torque also is relieved by the local formation of a new DNA structure: for every 10.5 bp converted into this new structure, three turns of overwinding (ΔLk = 3) are released. This new structure has a helical periodicity of 2.6 bp/turn and an extension ≈75% longer than B-DNA. Molecular modeling indicates that the phosphate backbones lie inside this helical structure whereas the bases are exposed on the outside. This surprising structure, which we term P-DNA, thus shares features of the DNA structure proposed by Pauling in 1953 (6) and strikingly resembles a structure for interwound single-stranded DNA observed within the Pf1 bacteriophage (7, 8).
Note that, for both positive and negative supercoiling, the new local structures appear to have unpaired bases exposed to the solution. We have used glyoxal, a reagent that is known to react specifically with unpaired bases, to modify these structures selectively. The larger σ , the greater the proportion of the unpaired bases generated that can react with glyoxal. The resulting structural alterations are consequently easier to detect. The ability to explore a large range of σ values, therefore, allows a better characterization of the structures generated on twisting the molecule. However, it should be noted that they already appear at much lower σ than the extreme and very unphysiological values we have reached in our study.
It also should be recalled that the role of the force here is to prevent the relaxation of torsional stress by writhing, not to overstretch the molecule. This increases the torque on the molecule and drives phase transitions at lower values of σ than would be expected if writhing was allowed. As an example, local denaturation of DNA has been observed in plasmids underwound by σ ≈ −0.07. By stretching the molecule and preventing its writhing, we observe denaturation already at σ ≈ −0.015.
MATERIALS AND METHODS
DNA.
The DNA used in these experiments was prepared by F. Caron from PXΔ1 (9). It had ≈17,000 bp (Lk0 ≈ 1,500) and was functionalized at its extremities with several biotin and digoxigenin (DIG) groups. DNA molecules were bound at one end (see Fig. 1) to a glass surface coated with an anti-DIG antibody and at the other to a streptavidin-coated bead (Dynal, Great Neck, NY). Details of the protocol are described in ref. 4. Although PXΔ1 DNA is AT rich (>70% AT), similar results have been obtained (2, 10) with λ-DNA, which is GC rich.
Observation and Force Measurement.
The surface where the beads were attached was imaged on a charge-coupled device camera (Sony, Tokyo) coupled to an optical microscope (Leica, Deerfield, IL). The image acquisition and analysis was performed on a personal computer equipped with an image grabber (Imaging Technology, Bedford, MA). The intensity profiles across the bead allowed for a real time measurement of the amplitude of its Brownian fluctuations: 〈(δx)2〉. The tethered bead is in fact an overdamped pendulum with an effective spring constant (in the direction transverse to the force): keff = F/l. The equipartition theorem (keff〈(δx)2〉/2 = kBT/2) thus yielded a relation between the force and the amplitude of the fluctuations:
 |
Force measurements were reduced to length measurements, which were performed easily on the microscope.
Buffer.
The experimental buffer used in the present experiments was 10 mM phosphate buffer (PB) at pH = 8 with no added salt. Other experiments with 10 mM PB and 150 mM NaCl gave the same structural transitions but with higher thresholds. The force needed to observe the transition for positive supercoiling was increased from 3 to 6 pN whereas for negative supercoiling, it was increased from 0.3 to 1 pN. The corresponding data may be found in ref. 4.
Glyoxal Reaction.
Freshly prepared glyoxal (Sigma) (0.1 M in 10 mM PB) was added to the sample with the DNA in its torsionally relaxed state. Next, the molecule was twisted and incubated with glyoxal for 1 hour. It then was unwound back to its torsionally relaxed state, the glyoxal was washed with 10 mM PB, and extension l vs. σ data were taken. It should be noted that no reaction was detected between glyoxal and a torsionally relaxed DNA, even when using longer incubation times.
Molecular Modeling.
Modeling was carried out with the jumna program (11, 12), which represents DNA flexibility by using a combination of helicoidal and internal degrees of freedom (all dihedral angles and sugar ring/backbone valence angles are variable whereas the remaining valence angles and all bond lengths are fixed). This enables an important reduction in the number of degrees of freedom with respect to standard Cartesian coordinate techniques, facilitates the use of helicoidal symmetry, and allows more efficient energy minimization. Conformational energies were calculated with a specifically parameterized force field (12), which has been used successfully to model canonical DNA conformations and both local and global deformations (3, 11, 13). Solvent electrostatic damping was taken into account by using a sigmoidal distance-dependent dielectric function scaled to reproduce base pairing energies in aqueous solution (12, 14). The present calculations were performed on helically symmetric DNA by using base sequences having mononucleotide or dinucleotide repeats (poly(dG).poly(dC), poly(dAT).poly(dAT), … ). The use of helical symmetry constraints enabled a further reduction in the number of variables (to only 32 in the case of mononucleotide symmetry), allowed effectively infinite polymers to be modeled by optimizing the energy of a single repeating unit within its polymeric environment, and prevented writhing, which would violate the symmetry rules. Adiabatic mapping of the conformational energy hypersurface was performed as a function of both twist and rise by fixing the corresponding parameter at regular intervals and optimizing the conformational energy with respect to the remaining variables. Helical analysis was carried out by using curves (15). This program was, however, modified to use the phosphate groups as the reference subunits. This avoided undesirable effects caused by violent base reorientation in the overtwisted conformations.
RESULTS AND DISCUSSION
Untwisting DNA Leads to Denaturation.
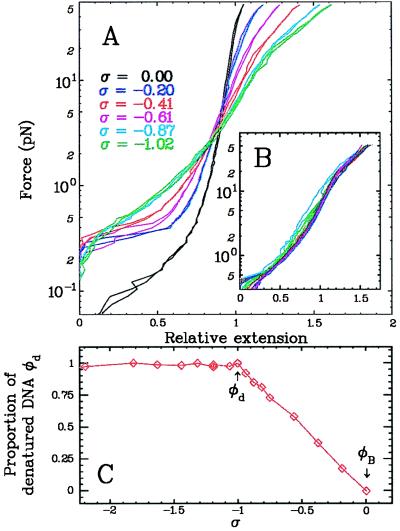
Let us first consider negative supercoiling (n < 0). It is known (16, 17) that for values of σ < −0.07, unstretched DNA undergoes localized denaturation. When stretched, similar local denaturation is observed at smaller values of σ because of the increased torsional stress resulting from the inhibition of writhe (see Fig. 2A and refs. 2 and 10). The denaturation was detected mechanically in the F vs. l curves by a sharp increase in the extension of the molecule (l) at a force Fc− ≈ 0.3 pN (see Fig. 2A) or by symmetry breaking (σ→−σ) in the l vs. σ curves (see Fig. 1 Lower). If, as suggested by these results, the twisted molecule separates into a pure B-DNA phase, with a critical degree of supercoiling, σc− = −0.015, and denatured regions, with σd ≈ −1, then every extra turn applied to the molecule should increase the fraction of denatured DNA (dDNA) by 10.5 bp.
Figure 2.
Experimental evidence for the coexistence in 10 mM PB of B-DNA and denatured DNA at negative supercoiling: −1 < σ < 0. (A) Force (F) vs. extension (l) curves of a single DNA molecule obtained at different degrees of supercoiling. At F = Fc− = 0.3 pN, the extension of the molecule changed dramatically pointing to the presence of a structural transition in DNA: denatured DNA appeared. (B) The data from A were rescaled such that ld(F) = (σd/σ)[l(F,σ) − l(F,0)] + l(F,0) (see Eq. 1). All data collapsed on a single curve, validating our hypothesis that stretched, unwound DNA separates into pure B-DNA and dDNA phases. ld(F) is the extension vs. force curve for denatured DNA. Notice that it is not the simple superposition of two parallel and noninteracting single-stranded DNAs (4). (C) The fraction φd of dDNA is plotted as a function of the number of turns. φd was obtained by a mean square fit of the force curve measured at a given σ and was expressed as a linear combination of the force curves obtained, respectively, at σ = 0 and σ = −1. As expected from Eq. 1, φd = −σ and goes from 0 to 1. Beyond this value, the points depart from linearity.
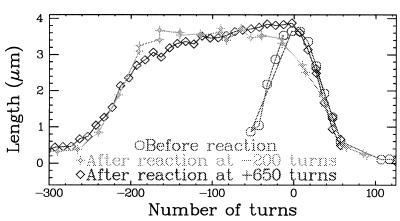
We have checked that this is indeed the case by incubating an undertwisted and stretched DNA molecule with glyoxal, a reagent specific for unpaired bases (17) (see Fig. 3). At low forces (F ≈ 0.3 pN), the l vs. σ curve for native (unreacted) DNA presented a pronounced maximum when no torsion was applied: on positive or negative twisting, the extension of the molecule rapidly decreased as plectonemes formed. To detect unpaired bases caused by the presence of a portion of dDNA, we incubated a molecule supercoiled to a value σinc < −0.015 and stretched with a force Finc > 0.3 pN in a glyoxal buffer. We then relaxed both σinc to 0 and Finc to 0.3 pN and washed out the glyoxal. The subsequent l vs. σ curve displayed a clear plateau extending to the σ < 0 side. This plateau was caused by the bases, which reacted with glyoxal and were unable to form Watson–Crick hydrogen bonds. They denatured in mild torsional conditions whereas they did not when unmodified. The plateau persisted as long as chemically altered bases could be converted to dDNA. Repeating this test for various degrees of supercoiling during incubation σinc, we found that the extension of the plateau was almost equal to σinc (as can be verified in Fig. 3).
Figure 3.
Detection of unpaired bases after incubation of a stretched and twisted DNA in glyoxal. Extension vs. torsion curves were obtained at a constant stretching force F between 0.2 and 0.3 pN. When no glyoxal was used (control experiment), the extension displayed a pronounced maximum at σ = 0. The formation of plectonemes on positive or negative twisting led to a rapid shortening of the molecule. When a stretched molecule unwound by ninc = 200 turns was incubated in glyoxal, the subsequent l vs. σ curve (obtained after washing out the glyoxal) displayed a clear plateau. Its width (≈180 turns) was roughly equal to ninc, which indicates that, beyond a threshold (≈20 turns, i.e., σ ≈ −0.015), every turn applied to a stretched and unwound molecule induced the melting of one turn of the double helix (10.5 base pairs). Molecular modeling suggests that the structure appearing in overwound DNA (P-DNA) also should have unpaired bases. Incubation in glyoxal of a different stretched and overwound molecule confirmed this prediction. After washing out the glyoxal, the l vs. σ curve displays the same plateau as for the underwound case. However, note that, to get the same plateau required three times more turns being applied to the molecule than in the former case. This is consistent with the measurements of σd = −1 and σp = +3.
Striking, though less obvious, evidence for this coexistence of the two phases of DNA also could be deduced from the force vs. extension curves. With the hypothesis of a separation between the two phases, one may write: (i) Free energy balance is E(F,l) = βEB +δEd, where β (or δ) is the proportion of B (or d) DNA. The mixing entropy is negligible if the interfacial energy between the two phases (which can be neglected in comparison to bulk energies) is greater than kBT. (ii) Conservation of the number of bases is β + δ = 1. (iii) Conservation of the linking number is βσB + δσd = σ.
Assuming that the portion of B-DNA is torsionally relaxed (we neglect its value: σB = σc− ≈ −0.015) and that dDNA is equivalent to two parallel strands (σd = −1), one has δσd ≈ σ. Using these relations and differentiating E(F,l) with respect to F leads to a linear relation between the extension of the molecule, l(F,σ) (=−∂E/∂F) and the degree of supercoiling σ:
 |
1 |
where lB(F) = l(F,0) and ld(F) are, respectively, the extension (at a given force F) of the pure B-DNA and dDNA structures. Plotting the extension vs. σ at constant force F, we indeed observed a linear relation as expected for −1 < σ < 0 (data not shown). Moreover, the measured force vs. extension curves at different values of −1 < σ < 0 all could be collapsed on the same ld(F) curve (independent of σ) in agreement with Eq. 1 (see Fig. 2B).
For a stretched molecule, the threshold for denaturation at σ = σc− ≈ −0.015 is a measure of the denaturation energy Edenat provided that the torsional stiffness C of DNA is known. For C = 75 nm, Edenat ≈ 1 kBT per bp in 10 mM PB (2).
Overtwisting DNA Leads to P-DNA.
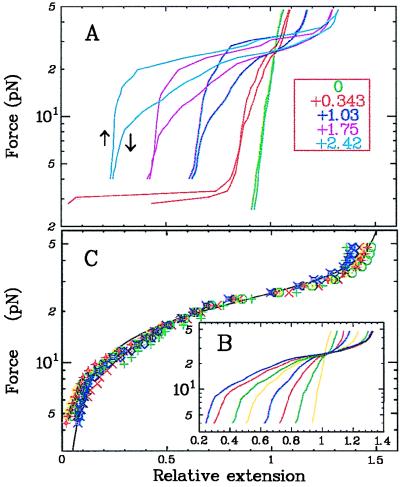
Let us now consider positive supercoiling (n > 0). The elastic behavior of a stretched, overwound DNA revealed the existence of a sharp transition at F ≈ 3 pN (see Fig. 4A). By analogy with negative supercoiling, we suggest that stretched, overwound DNA undergoes a phase separation between a fraction of pure B-DNA and a fraction with a new structure, which we term P-DNA. As shown (see Eq. 1), the coexistence of two phases implies a linear dependence between the extension of the molecule, l(F,σ), and σ (see Fig. 4 A and B). This linearity indeed was observed up to σ ≈ +3, where the extension goes to 0 for forces <25 pN. The natural twist of the new P-DNA phase, σp, (analogous to σd, but for P-DNA) was thus +3 (Lk = 4 Lk0), which corresponds to ≈2.6 bp per turn. Using this value of σp in Eq. 1 (σp replacing σd), we found that the measured extension vs. force curves for 0.037 < σ < 3 did indeed collapse on the same curve lp(F), the extension at given force, F, of the pure P-DNA phase (see Fig. 4C).
Figure 4.
Mechanical characterization of P-DNA. (A) Elasticity curves showing two sharp transitions at 3 and 25 pN. The first transition (not shown for all curves) is associated with the disappearance of plectonemes in B-DNA and the formation of P-DNA. The second transition, showing hysteresis, is attributed to the disappearance of plectonemes in the P-DNA sub-phase. Note that, because of the possibility of stabilizing interactions between exposed bases, these plectonemes should be more stable than with B-DNA. The existence of these plectonemic structures also might explain the shortening of the molecule at relatively low forces 3 pN < F < 10 pN. At high force, these curves show that P-DNA is actually longer than B-DNA. (B) A detailed view of the curves from A for decreasing forces (each curve corresponds to σi = i × 0.343). (C) Rescaling, following Eq. 1, enabled all of the curves shown in B to be collapsed to a single curve lp(F) that describes the extension vs. force behavior of a pure P-DNA. The full line is a fit to the model for P-DNA (Eq. 2) with lp,0 = 1.75, ξp = 19 nm, and ɛ = 0.12 kBT/nm (see text for details).
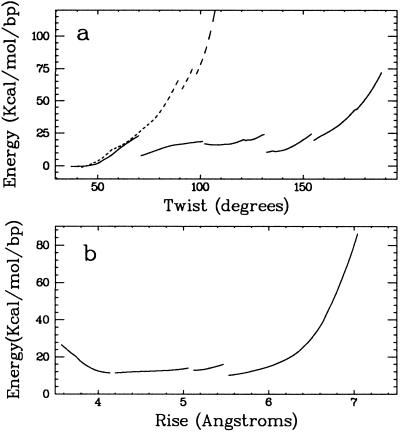
Molecular modeling has been used to investigate possible structures for these highly twisted DNAs. Twist constraints enabled structures to be generated in the range of −6 ≲ σ ≲ +4 before the geometrical limits of interstrand twisting were reached. As twisting increased, stretching of the phosphodiester linkages forced the stacked bp against one another. Beyond ≈70° (σ ≈ +1), the backbones resisted further extension, the Watson–Crick hydrogen bonds were broken, and the bases were expelled from the double helix. This allowed the backbones to move to the center of the molecule (see Fig. 5). Twisting then could be continued until ≈180° (σ = +4) for an energy cost of ≈10 kcal/mol/bp, although the conformational energy began to rise sharply beyond twists of ≈160° (Fig. 6A). Around σ = +3, the optimal structures are ≈60% longer than B-DNA, but this value could be modified easily between ≈25% and ≈80% (with some variation as a function of base sequence) (Fig. 6B). The resulting P-DNA conformation (see Fig. 5) could be built starting from either B-DNA or A-DNA and was compatible with both C2′-endo and C3′-endo sugar puckers, although C2′-endo sugars were in fact adopted in the A-DNA derived conformation for twists >140° because of their intrinsically longer intrastrand P-P distances. The major backbone conformational changes with respect to canonical DNA involved dihedral angle movements toward trans conformations (notably, for α, O3′-P-O5′-C5′ and for γ, O5′-C5′-C4′-C3′). Although the shortest interstrand distance between phosphate atoms in P-DNA was of the order of 5.5–6.0 Å, the intrastrand distance increased to 7.5 Å for the most stretched conformations. This distance is much larger than the intrastrand P-P distances in canonical A-DNA (5.8 Å) or B-DNA (6.6 Å). The phosphate groups are diametrically opposed around the helical axis, and their anionic oxygens point outwards and are fully accessible for stabilizing interactions with counterions. There are also important interstrand phosphate–sugar stabilizing interactions. It is remarked that both B and A starting conformations led to phosphates at roughly the same position along the helical axis for each base pair step. A staggered arrangement (cf. refs. 7 and 8) cannot be excluded but may be less compatible with adjacent canonical DNA fragments. The expelled bases are relatively free to rotate. Depending on the sequence modeled, both stacking and hydrogen bonding between adjacent bases can occur, and certain purines were seen to move to syn conformations to favor such interactions. It is remarked that very similar left-handed P-DNA could be created by strong negative twisting. These structures, which were reached after passing though a completely unwound state, strongly resembled their right-handed analogues.
Figure 5.
Structure of P-DNA deduced from molecular modeling. Space-filling models of a (dG)18⋅(dC)18 fragment in B-DNA (Left) and P-DNA (Right) conformations. The backbones are colored purple, and the bases are colored blue (guanine) and yellow (cytosine). The anionic oxygens of the phosphate groups are shown in red. These models were created with the jumna program (11, 12) by imposing twisting constraints on helically symmetric DNAs with regular repeating base sequences.
Figure 6.
Theoretical modeling of the conformational energy of (dG)18⋅(dC)18. (A) Energy as a function of the twist per base pair. Base pair breaking and expulsion occurred at ≈70° (solid line) coupled to a sudden relaxation of the strain energy built up in the backbones. The discontinuity at 130° corresponds to a rearrangement of the backbones so that the phosphate anionic oxygens point outwards. This introduced C3′-endo puckering in the cytidine strand. When Watson–Crick hydrogen bonding was maintained with distance constraints the energy rose rapidly beyond a twist of 70° (dotted line). (B) Energy as a function of the rise per bp for overtwisted DNA (twist constrained at 138°). The rise could be varied between ≈4 and 6 Å (80% of the maximum extension of a single strand of DNA) with little energy change. The discontinuity at 5.5 Å corresponds to the reintroduction of a C2′-endo sugar for the cytidines, allowing an increase in the intrastrand P-P distance.
The fact that extreme twisting leads to base pair disruption can be understood by noting that successive P-P distances within one strand cannot exceed ≈7.5 Å. For a rise of 3Å, the maximum length of the P-P vector projected into the plane perpendicular to the helical axis is, therefore, ≈6.9 Å. For a helix radius of ≈10 Å (as in B-DNA), simple geometry gives the angle subtended by the projected P-P vector (that is, the maximum twist) as ≈40°. To increase this angle, it is necessary to decrease the radius of the helix (50° at 8 Å, 70° at 6 Å, and, finally, 180° at 3.45 Å)—which implies bringing the backbones to the center of the helix and, consequently, pushing the bases out.
To show that the bases in the P-DNA really are exposed, we followed a protocol similar to the one described previously to demonstrate the existence of localized denatured regions in underwound DNA by reacting the exposed bases with glyoxal. We incubated a DNA molecule overwound by σinc > 0.037 and stretched by a force Finc > 3 pN in a glyoxal buffer for ≈1 hour. We then relaxed σinc to 0 and Finc to 0.3 pN and washed out the glyoxal. The subsequent l vs. σ curve (see Fig. 3) revealed the existence of a plateau similar to the one observed after incubating underwound DNA in glyoxal. Thus, in P-DNA, as in denatured DNA, the bases were exposed to the solution and reacted with glyoxal. However, the extension of the plateau was now ≈1/3 of σinc (minus a threshold of σc+ = 0.037). This further confirmed the value of σp = 3 for the P-DNA phase whose proportion in the molecule incubated in glyoxal was as expected, (σinc − σc+)/(σp − σc+) ≈ (σinc − σc+)/3. Note that an earlier chemical detection of structural alterations within positively supercoiled DNA is described in ref. 18.
At intermediate forces (3pN < F < 25 pN), the measured length of strongly overwound DNA (σ→σp = 3) decreased to 0 (Fig. 4A). We propose that this shortening is caused by the formation of plectonemic conformations of P-DNA stabilized by interactions between their exposed bases. When the stretching force, F, exceeds ≈25 pN, the molecule extends by destroying these plectonemes (as discussed in refs. 5 and 19). The hysteresis observed on increasing the force might be caused by sporadic and cooperative base unpairing in these plectonemic structures. A simple theoretical model incorporating this idea nicely fits our measurements. As a function of force, we expect the P-DNA phase to have a certain fraction q in plectonemic form stabilized by nonspecific interactions between the exposed bases with an average energy per unit length of −ɛ. The rest, i.e., a fraction 1−q, behaves as a worm-like chain (WLC) polymer (20, 21) of length lp,0, persistence length ξp, and an energy-per-unit length of gWLC(Fξp/kBT) (20, 21). The free energy per unit length F of the chain thus will be:
 |
2 |
 |
The last term in Eq. 2 is the mixing entropy. The elasticity curve, obtained by minimization of F with respect to q, is the continuous curve in Fig. 4C that fits the collapsed data over more than an order of magnitude in force. The parameters of the fit imply that P-DNA has a relaxed length lp,0 = 1.75 (i.e., 75% longer than B-DNA), which is consistent with the molecular modeling, and a persistence length ξp = 19 nm [ξB = 53 nm for B-DNA (20, 21)]. The average plectonemic energy per unit length is ɛ = 0.5 pN = 0.12 kBT/nm.
CONCLUSION
The present micromanipulation experiments show that both positive and negative supercoiling induce a phase separation in DNA. For negative supercoiling, the structure coexisting with B-DNA is, as expected, denatured DNA. For positive supercoiling, converging evidence from mechanical measurements, chemical reactivity, theoretical results, and numerical calculations point to the existence of a DNA structure, P-DNA, having its two phosphodiester strands at the center of the conformation and unpaired bases exposed on the outside, with twist and rise between successive bases ΦDNA = 137° and ZDNA = 5.85 Å. This structure can be produced with degrees of supercoiling starting from ≈0.037 and forces ≳3 pN (2, 10). These are not very stringent conditions. They most probably are encountered during replication and transcription, when positive supercoiling is produced downstream of the protein complex (22). Moreover, proteins such as RNA-polymerase are known to exert forces as large as 14 pN on DNA (23).
It is striking that a very similar structure with exposed bases has been reported (7, 8) for the DNA in the Pf1 bacteriophage (with ΦDNA = 132° and ZDNA = 6.1 Å), where it is stabilized by helical coat proteins. This structure, however, involves the interwinding of a single-stranded, circular DNA whose sequence is not adapted to forming a conventional, double-stranded DNA. We show here that a very similar structure apparently can be formed by a continuous conformational transition from a canonical Watson–Crick duplex DNA.
Acknowledgments
These results were obtained thanks to the high quality DNA molecules prepared by the late F. Caron. This work owes him much. We also thank C. Bouchiat, P. Cluzel, S. Komilikis, A. Lebrun, M. Mézard, X. Michalet, B. Nienhuis, J. Ninio, and T. R. Strick for help or discussions. This research was supported by the Centre National de la Recherche Scientifique, Université Pierre et Marie Curie, Université Denis Diderot, and the Ecole Normale Supérieure.
ABBREVIATIONS
- DIG
digoxigenin
- dDNA
denatured DNA
Footnotes
This paper was submitted directly (Track II) to the Proceedings Office.
A Commentary on this article begins on page 13999.
References
- 1.White J H. Am J Math. 1969;9:393–728. [Google Scholar]
- 2.Strick T R, Allemand J F, Bensimon D, Croquette V. Biophys J. 1998;74:2016–2028. doi: 10.1016/S0006-3495(98)77908-1. [DOI] [PMC free article] [PubMed] [Google Scholar]
- 3.Cluzel P, Lebrun A, Heller C, Lavery R, Viovy J-L, Chatenay D, Caron F. Science. 1996;271:792–794. doi: 10.1126/science.271.5250.792. [DOI] [PubMed] [Google Scholar]
- 4.Smith S, Cui Y, Bustamante C. Science. 1996;271:795–799. doi: 10.1126/science.271.5250.795. [DOI] [PubMed] [Google Scholar]
- 5.Marko J, Siggia E. Phys Rev E Stat Phys Plasmas Fluids Relat Interdiscip Top. 1995;52:2912–2938. doi: 10.1103/physreve.52.2912. [DOI] [PubMed] [Google Scholar]
- 6.Pauling L, Corey R B. Proc Natl Acad Sci USA. 1953;39:84–97. doi: 10.1073/pnas.39.2.84. [DOI] [PMC free article] [PubMed] [Google Scholar]
- 7.Liu D J, Day L A. Science. 1994;265:671–674. doi: 10.1126/science.8036516. [DOI] [PubMed] [Google Scholar]
- 8.Day L A, Wiseman R L, Marzec C J. Nucleic Acids Res. 1979;7:1393–1403. doi: 10.1093/nar/7.6.1393. [DOI] [PMC free article] [PubMed] [Google Scholar]
- 9.Cluzel P. Ph.D. thesis. Paris: Université Pierre et Marie Curie; 1996. [Google Scholar]
- 10.Strick T R, Allemand J F, Bensimon D, Bensimon A, Croquette V. Science. 1996;271:1835–1837. doi: 10.1126/science.271.5257.1835. [DOI] [PubMed] [Google Scholar]
- 11.Lavery R. Adv Comput Biol. 1994;1:69–145. [Google Scholar]
- 12.Lavery R, Zakrzewska K, Sklenar H. Comput Phys Commun. 1995;91:135–158. [Google Scholar]
- 13.Lebrun A, Lavery R. Nucleic Acids Res. 1996;24:2260–2267. doi: 10.1093/nar/24.12.2260. [DOI] [PMC free article] [PubMed] [Google Scholar]
- 14.Arora N, Jayaram B. J Comput Chem. 1997;18:1245–1252. [Google Scholar]
- 15.Lavery R, Sklenar H. J Biomol Struct Dyn. 1989;6:655–667. doi: 10.1080/07391102.1989.10507728. [DOI] [PubMed] [Google Scholar]
- 16.Kowalski D, Natale D A, Eddy M J. Proc Natl Acad Sci USA. 1988;85:9464–9468. doi: 10.1073/pnas.85.24.9464. [DOI] [PMC free article] [PubMed] [Google Scholar]
- 17.Palecek E. Crit Rev Biochem Mol Biol. 1991;26:151–226. doi: 10.3109/10409239109081126. [DOI] [PubMed] [Google Scholar]
- 18.McClellan J A, Lilley D. J Mol Biol. 1991;219:145–149. doi: 10.1016/0022-2836(91)90555-k. [DOI] [PubMed] [Google Scholar]
- 19.Marko J, Siggia E. Science. 1994;265:506–508. doi: 10.1126/science.8036491. [DOI] [PubMed] [Google Scholar]
- 20.Bustamante C, Marko J, Siggia E, Smith S. Science. 1994;265:1599–1600. doi: 10.1126/science.8079175. [DOI] [PubMed] [Google Scholar]
- 21.Marko J, Siggia E. Macromolecules. 1995;28:8759–8770. [Google Scholar]
- 22.Wang Z, Dröge P. EMBO J. 1996;15:581–589. [PMC free article] [PubMed] [Google Scholar]
- 23.Yin H, Wang M, Svoboda K, Landick R, Block S, Gelles J. Science. 1995;270:1653–1657. doi: 10.1126/science.270.5242.1653. [DOI] [PubMed] [Google Scholar]


