Abstract
We demonstrate, by using mathematical modeling of cell division cycle (CDC) dynamics, a potential mechanism for precisely controlling the frequency of cell division and regulating the size of a dividing cell. Control of the cell cycle is achieved by artificially expressing a protein that reversibly binds and inactivates any one of the CDC proteins. In the simplest case, such as the checkpoint-free situation encountered in early amphibian embryos, the frequency of CDC oscillations can be increased or decreased by regulating the rate of synthesis, the binding rate, or the equilibrium constant of the binding protein. In a more complex model of cell division, where size-control checkpoints are included, we show that the same reversible binding reaction can alter the mean cell mass in a continuously dividing cell. Because this control scheme is general and requires only the expression of a single protein, it provides a practical means for tuning the characteristics of the cell cycle in vivo.
In recent years, studies of the cell division cycle (CDC) have uncovered many of the genes and proteins that drive and regulate cell division (for reviews, see refs. 1–5). With this expanding knowledge, it is becoming increasingly apparent how the cell cycle can be artificially controlled. Typically, such manipulations are achieved by introducing mutations into the genes that regulate the cycle. However, these mutations usually result in uncontrolled cell division or complete suppression of cell division, or cause the cell to commit fatal errors during the cell cycle.
Here, we develop methods for gaining more precise control of the CDC by using our understanding of the dynamics of the CDC oscillator. Specifically, we describe a mechanism that can stop and restart cell division, modulate the frequency of cell division, and control the size of dividing cells. This control scheme requires only the expression of a protein that binds to and inhibits any one of the CDC proteins.
To explore the features of our control scheme, we apply it to two previously developed models of the CDC. The first model, developed by Goldbeter (6, 7), is based on the situation encountered in early amphibian embryos and presents the simplest and most intuitive description of the CDC. Though a significant abstraction of the real cell cycle, it captures the fundamental dynamics of the molecular interactions that drive CDC oscillations. The model, which characterizes the G2/M phase transition, reduces the CDC to three proteins: cyclin, Cdc2 kinase, and a cyclin protease. Cyclin, which is synthesized constitutively in the model, activates the Cdc2 kinase, which activates the cyclin protease, which, in turn, degrades cyclin. This model produces limit cycle oscillations under the conditions that (i) the activation of Cdc2 kinase and/or the activation of the cyclin protease is by means of threshold mechanisms, and (ii) time lags are associated with the threshold mechanisms.
The second model, developed by Novak and Tyson (8), describes cell division in Schizosaccharomyces pombe. This model is substantially more complex than the Goldbeter model, and it provides a more realistic description of the CDC oscillator. The Novak–Tyson model, at its core, contains threshold activation/degradation mechanisms similar to those in the Goldbeter model, but it also includes several additional features. The model describes both the G1/S and G2/M phase transitions, incorporates autocatalytic activation of the M-phase promoting factor, and includes size control checkpoints at both the start of DNA replication and the beginning of M-phase. In the Goldbeter and the Novak–Tyson models, we show that in the absence of checkpoints, the expression of a cyclin or cyclin-Cdc2 inhibitor modulates the frequency of the CDC oscillator. Moreover, we show that the qualitative features of this control scheme are nearly identical in both cases despite the substantial differences between the two models.
The effectiveness of this control scheme on two different models of the CDC emphasizes one of its critical features: model independence. Although the CDC is increasingly well understood, the exact details of the molecular interactions have not been fully elucidated. Our control scheme is based on the basic biochemical dynamics that form the core of the CDC oscillator, not on the precise details of the CDC. Thus, our control scheme is likely to be effective in the vastly more complicated CDC of the living cell.
Model for the Control of Cell Division
We achieve control of cell division by expressing an inhibitor of one of the CDC proteins. The general form of this control scheme is given by:
 |
 |
 |
 |
 |
 |
1 |
In the above equation, the model of the basic CDC oscillator is represented by U1, … , Un and functions f1, … , fn (in boldface), where U1 is the concentration of the target protein of the inhibitor and U2, … , Un are the concentrations of the other proteins in the CDC model. Y denotes the concentration of unbound inhibitor, and Z denotes the concentration of inhibitor-target complex. The rate constants a1 and a2 determine the rate of binding and release, and the dissociation constant Kd = a2/a1. The rate of inhibitor synthesis, given by vs, is balanced by d1, the basal rate of inhibitor degradation. Likewise, U1 is degraded at a basal rate given by kd (see Eq. 2). The inhibitor and target proteins, when bound in a complex, also are degraded by proteolytic pathways, but at a fraction, α < 1, of the rates of d1 and kd.
The Goldbeter model of cell division is given by:
 |
 |
 |
2 |
where
 |
where C denotes the cyclin concentration; M and X denote the fraction of active Cdc2 kinase and cyclin protease, respectively; vi is the rate of synthesis of cyclin; k1, kd, and K5 characterize the kinetics of cyclin degradation; the parameters Vi and Ki (i = 1−4) characterize the kinetics of the enzymes involved in posttranslational modification of M and X; and K6 characterizes the allosteric modulation of the enzyme corresponding to V1.
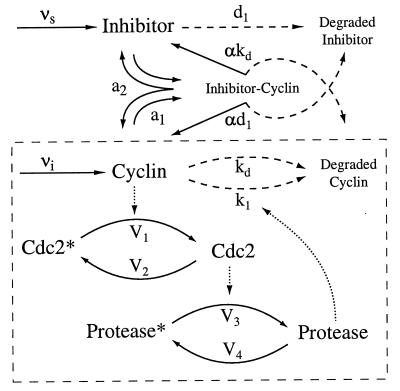
In the simulations and analysis presented here, we choose cyclin as the target of the inhibitor. In this case, Eq. 2 is substituted into Eq. 1, where U1 = C, U2 = M, and U3 = X. The scheme is represented schematically in Fig. 1. Although we choose cyclin here, modulation of the CDC frequency can be achieved by using an inhibitor of any of the CDC proteins. The choice of cyclin as the target protein is simply the most obvious one, because cyclin plays a prominent role in the CDC oscillator.
Figure 1.
Control of the Goldbeter model with a cyclin inhibitor. The Goldbeter model is outlined by the dashed box. Solid arrows indicate protein synthesis or enzymatic conversion. Dotted arrows denote modulation. Dashed arrows denote degradation.
Because of its large size and complexity, we do not show the Novak–Tyson model of cell division here. In our simulations, we use the model and parameter values as presented in ref. 8, and, as above, we substitute the model equations into Eq. 1. In this case, we choose the cyclin-Cdc2 complex (the M-phase and S-phase promoting factor) as the target of the inhibitor.
We simulate both the Goldbeter and Novak–Tyson models by using an adaptive time-step Runga-Kutta integration algoritm implemented in fortran 77 and a fixed time-step Runga-Kutta integrator implemented in xpp-aut (ftp://ftp.math.pitt.edu/pub/bardware/tut/start.html) numerical analysis software. Parameters in all simulations are normalized such that concentrations are dimensionless and rate constants have dimensions min−1. Below, we describe our results concerning (i) the reduction of CDC frequency, (ii) the effects of inhibitor strength, (iii) the increase of CDC frequency, and (iv) the effects of cell cycle checkpoints.
Reducing the Frequency of Oscillations
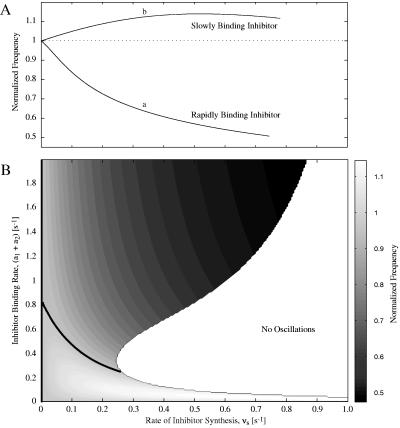
We find that when the binding of the cyclin inhibitor is rapid relative to the frequency of CDC oscillations, the frequency of oscillations is decreased (curve a, Fig. 2A). In this case, the inhibitor plays a role akin to a capacitor in an electric circuit. The inhibitor acts as a large reservoir for cyclin that is filled and emptied during the oscillations. The additional time needed to fill and empty the reservoir slows down the oscillations. As cyclin is constitutively synthesized and its concentration begins to rise, the inhibitor binds to it, and the rise in the concentration of free cyclin is slowed. Thus, cyclin is delayed in reaching the threshold for activating Cdc2 kinase. Conversely, when cyclin is degraded because of elevated levels of cyclin protease, the release of cyclin from the inhibitor-cyclin complex hinders the fall in cyclin concentration.
Figure 2.
Simulation results for frequency modulation of the Goldbeter CDC model. Frequencies are normalized to the natural frequency (fn) of the CDC oscillator, i.e., the frequency when no inhibitor is present (fn = 0.0518 min−1). The rate of inhibitor binding is quantified as the sum of the inhibitor rate constants, a1 and a2. The dissociation constant for the inhibitor is Kd = a2/a1 = 1.0. Parameter values for the Goldbeter model are: vi = 0.1 min−1, k1 = 0.5 min−1, kd = 0.02 min−1, K1 = K2 = 0.06, K3 = K4 = 0.1, K5 = 0.02, K6 = 0.3, V1′ = 0.75 min−1, V2 = 0.25 min−1, V3′ = 0.3 min−1, V4 = 0.1 min−1, d1 = 0.05 min−1, α = 0.1. (A) Effect of vs, the rate of inhibitor synthesis, on CDC frequency for two inhibitor binding rates: (a1 + a2) = 1.4 min−1 (curve a) and (a1 + a2) = 0.06 min−1 (curve b). (B) Contour plot showing the effects of vs and the inhibitor binding rate on the CDC frequency. Oscillations at the natural frequency (fn) are marked by the thick black contour line. Above the fn contour, the frequency of oscillations is reduced; below the contour, the frequency is increased.
A theory for a similar effect involving a rapidly binding inhibitor in a simplified model of the citric acid cycle has been described by Selkov (10, 11) and Zhabotinsky (12). The model consists of only two proteins with concentrations σ and ρ and is described by:
 |
 |
3 |
In the above equation, the only contributions of the inhibitor are the order epsilon terms and the scaling factor (1 + Ka), where Ka is the association constant of the inhibitor. Because the order epsilon terms can be neglected, one can see that for any value of Ka>0 the rate of change of σ is reduced without affecting the dynamics of ρ. Hence, the frequency of oscillations can be reduced simply by increasing the strength of inhibition.
From this analysis, it appears that the frequency of oscillations can be monotonically reduced to arbitrarily small values simply by increasing Ka. As discussed below, this effect does not occur. The inhibitor has a maximum effect on the frequency of oscillations at an intermediate value of Ka. At Ka = 0 and Ka = ∞, the reduction in frequency is minimized. This effect becomes apparent only when the finite concentration of the inhibitor is included in the model. Because, in the theory described by Selkov (10), the quantity of inhibitor is unconstrained, this effect does not arise.
Effect of Inhibitor Strength
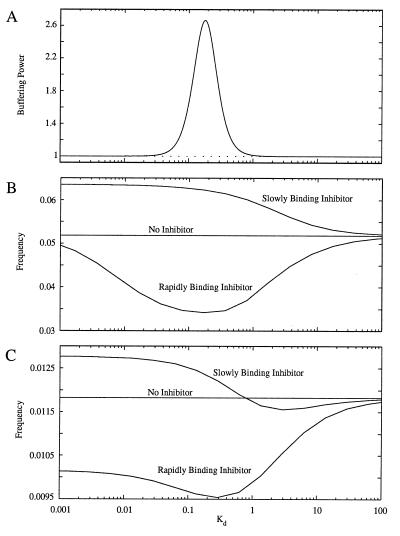
We find that the maximum reduction in frequency caused by cyclin inhibition occurs at an intermediate value of Kd (the dissociation constant of the inhibitor), as shown in Fig. 3 B and C. This effect is caused by the variation of inhibitor strength with Kd. Because the inhibitor binds cyclin rapidly, we can characterize its strength by using the equilibrium concept of buffering power (BP). BP quantifies the ability of the inhibitor to respond to changes in the concentration of free cyclin by binding or releasing it. We define BP as BP = dCtot/dC, where C is the concentration of free cyclin at equilibrium and Ctot is the total concentration of cyclin (Ctot = C + Z). Substituting Y = Ytot − Z into the equilibrium relation for inhibitor-cyclin binding, Kd = C Y/Z, we obtain:
 |
4 |
where Ytot is the total concentration of inhibitor. As shown in Fig. 3A, BP rises to a peak at intermediate values of Kd. Hence, the maximum reduction in the frequency of oscillations will occur at intermediate values of Kd (Fig. 3 B and C).
Figure 3.
Effects of the inhibitor dissociation constant, Kd = a2/a1, on frequency modulation of cell division. (A) BP (as defined by Eq. 4) vs. Kd showing that inhibitor strength is maximum at intermediate values of Kd and is almost completely ineffective at low and high Kd values. (B) Effect of Kd on the frequency of the Goldbeter oscillator for rapidly and slowly binding inhibitors. The inhibitor binding rates are (a1 + a2) = 3.0 min−1 (rapid binding) and (a1 + a2) = 0.2 min−1 (slow binding); and vs = 0.1 min−1 for both curves. Parameters for the Goldbeter model are the same as in Fig. 2 except for K1 = K2 = 0.02. (C) Effect of Kd on the frequency of the Novak–Tyson oscillator for rapidly and slowly binding inhibitors. The inhibitor parameters are: (a1 + a2) = 1.0−1 (rapid binding) and (a1 + a2) = 0.1 min−1 (slow binding); and Vs = 0.08 min−1 for both curves. Parameter values for the model are given in ref. 8.
One also can see from Eq. 4 that BP rises linearly with Ytot. In our control scheme, Ytot is not constant, but its mean value is governed by vs, the rate of synthesis of the cyclin inhibitor (Eq. 1). Hence the strength of the frequency modulation will increase as the rate of inhibitor synthesis is increased. Ultimately, the CDC is overwhelmed by the large concentration of inhibitor, oscillations are suppressed, and the system is forced into a stable equilibrium (Fig. 2B). Therefore, the magnitude of the frequency reduction can be altered by manipulating vs and Kd of the rapidly binding inhibitor, but the frequency cannot be reduced to arbitrarily small values.
In the case of a slowly binding inhibitor, BP, an equilibrium concept, cannot be used to explain the frequency versus Kd relationship. But it is clear from Fig. 3 B and C that for large Kd (very weak binding), the inhibitor becomes ineffective regardless of whether it binds cyclin slowly or rapidly.
Increasing the Frequency of Cell Division
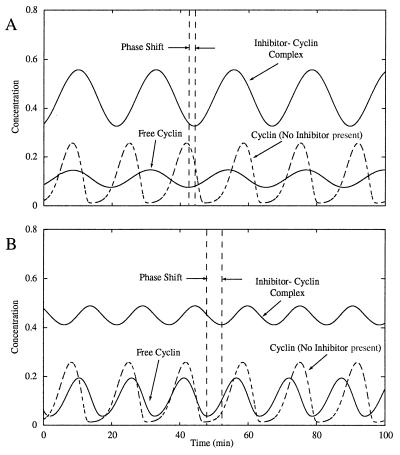
When the binding of the inhibitor to cyclin (or cyclin-Cdc2) is slow, we find that the frequency of oscillations is increased (curve b, Fig. 2A). Although the effect is not intuitive, the inhibitor increases the frequency by boosting the rise and fall of cyclin concentration at appropriate points in the cell cycle. The inhibitor again plays a role akin to a capacitor, storing cyclin as the concentration rises and releasing cyclin as the concentration falls. However, there is a delay in the binding and release of cyclin because the binding is slow. Consequently, the inhibitor continues to release cyclin after the free cyclin concentration begins to rise. Conversely, it continues to bind cyclin after the free cyclin concentration begins to fall. This delay is manifested in the cell cycle as an increased phase shift between the inhibitor-cyclin complex and the free cyclin concentrations. As shown in Fig. 4B, the concentration of the inhibitor-cyclin complex continues to fall—-and release cyclin—-after the free cyclin concentration has reached its minimum. The subsequent rise in free cyclin is accelerated for a length of time equal to the phase shift, i.e., until the inhibitor-cyclin complex reaches its minimum concentration. The free cyclin therefore rises more quickly to the threshold for activating the next phase of the cell cycle. On the other hand, when the free cyclin reaches its peak concentration, the inhibitor continues for a period of time to bind the free cyclin. The fall in free cyclin concentration is aided by the inhibitor and proceeds more rapidly toward the threshold for deactivating the next phase of the cycle. As a result, the frequency of oscillations is increased.
Figure 4.
Effect of inhibitor binding rate on the frequency of the Goldbeter oscillator and on the phase shift between the inhibitor-cyclin complex and free cyclin concentrations. Model parameters are the same as given in Fig. 2 except for K1 = K2 = 0.1. For the dashed curves, vs = 0. (A) The rate of inhibitor binding is rapid, the phase shift is nearly nonexistent, and the oscillations are slowed. Parameter values for the inhibitor are: vs = 0.2 min−1, Kd = 1.0, and (a1 + a2) = 1.0 min−1. (B) The rate of inhibitor binding is slow, the phase shift is large, and the frequency of oscillations is increased. Parameter values for the inhibitor are: vs = 0.2 min−1, Kd = 1.0, and (a1 + a2) = 0.1 min−1.
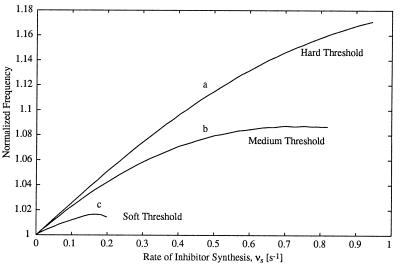
As shown by Goldbeter and Guilmot (13), the existence of at least one hard threshold is necessary to ensure robust oscillations of the CDC. Similarly, we find that frequency increases are more pronounced when hard thresholds exist in the activation of CDC proteins. The rise and fall of the free cyclin concentration is accelerated for a finite period of time after it achieves its minimum or maximum. After that period, the inhibitor tends to slow the rise or fall of cyclin. However, if cyclin activates the downstream CDC protein through a hard threshold, then that protein is fully activated while the inhibitor is still accelerating the cycle. Thus, the slowing effects of the inhibitor are avoided and the cycle frequency is increased substantially. Alternately, if the threshold is soft, the cyclin activates the downstream protein more gradually. The downstream protein is not fully activated until the inhibitor has begun to slow the system. Thus, the accelerating effects are diminished and the increases in frequency will be less dramatic than those for a hard threshold (Fig. 5).
Figure 5.
Effect of the Cdc2 activation threshold on the frequency increase in the Goldbeter model. Threshold strength is altered by varying the parameters K1 and K2. Parameter values are: K1 = K2 = 0.02 (curve a), K1 = K2 = 0.1 (curve b), and K1 = K2 = 0.5 (curve c). All other model parameters are the same as in Fig. 2.
Effect of Cell Cycle Checkpoints
Crucial to the viability of a dividing cell is the existence of cell cycle checkpoints that slow down or stop the CDC oscillator in response to internal and external factors, such as DNA replication, spindle formation, and cell mass. We find that these checkpoints can significantly alter the effects of our control scheme when they are active.
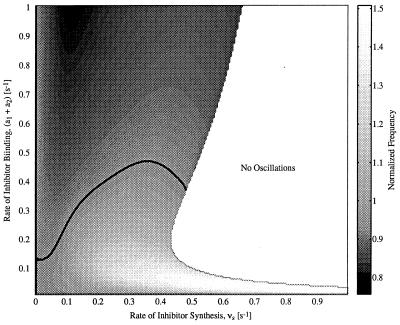
To explore the effects of checkpoints, we use the Novak–Tyson model because it includes a mass-control checkpoint on the G1/S and the G2/M phase transitions. These checkpoints can be switched on or off in the model. Fig. 6 shows the effects of the cyclin-Cdc2 inhibitor on the Novak–Tyson model when the checkpoints are inactive. Although this model is far more complex than the Goldbeter model, containing 13 equations (versus three for the Goldbeter model), the qualitative effects of the cyclin-Cdc2 inhibitor are similar to the effects of the cyclin inhibitor on the Goldbeter model (Fig. 2B). That is, the rate of inhibitor binding primarily determines whether the frequency of oscillations is increased or decreased, whereas the rate of synthesis of inhibitor primarily determines the magnitude of the effect up to the point where the oscillations are entirely suppressed.
Figure 6.
Simulation results for frequency modulation of the Novak–Tyson model with checkpoints inactive. Contour plot shows the effects of vs and the inhibitor binding rate on the CDC frequency. Parameter values for the model are given in ref. 8. The dissociation constant for the inhibitor is Kd = 0.1. Oscillations at the natural frequency (fn) are marked by the thick black contour line (fn = 0.0118 min−1). Above the fn contour, the frequency of oscillations is reduced; below the contour, the frequency is increased.
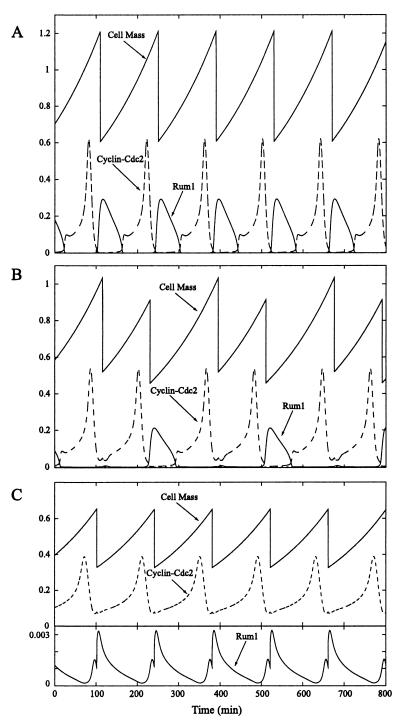
Although there are two mass-control checkpoints in the Novak–Tyson model, we examine only the effects of the G1/S checkpoint. When this checkpoint is active, the mass of the cell is regulated by the Rum1 protein that binds to and degrades cyclin-Cdc2. High concentrations of Rum1 prevent cell division because cyclin-Cdc2 is rapidly degraded. Cell division proceeds only when the concentration of Rum1 is lowered by increasing its rate of degradation. Rum1 degradation is elevated by two factors: (i) increases in cell mass and (ii) cyclin-Cdc2 through positive feedback. Thus, Rum1 and cyclin-Cdc2 act as antagonistic proteins, each enhancing the degradation of the other, whose interactions are modulated by cell mass. If the mean mass of the cell is too low, Rum1 overcomes cyclin-Cdc2, the period of oscillations is extended, and the mean cell mass increases until a stable period of oscillations is achieved. Under these conditions (Fig. 7A), the frequency of cell division is strictly controlled by the rate of cell growth (the period of cell division must equal the mass doubling time), and the mean cell mass is regulated by the level of expression of the Rum1 protein. A high level of Rum1 expression raises the mean cell mass, whereas a low level of expression reduces mean cell mass.
Figure 7.
Effect of inhibitor on Novak–Tyson model when G1/S mass control checkpoint is active. (A) Stable oscillations when inhibitor is not expressed. (B) Stable period-2 oscillations when a slowly binding inhibitor is expressed at a low level (vs = 0.055 min−1). (C) Stable oscillations when a slowly binding inhibitor is expressed at a high level (vs = 0.1 min−1). Mean cell mass is reduced.
When we introduce a reversible cyclin-Cdc2 inhibitor into the Novak–Tyson model with G1/S mass-control active, we observed two different effects: the cell cycle exhibits period doubling or the mean cell mass is reduced. The period doubling occurs for low levels of expression of a slowly binding cyclin-Cdc2 inhibitor (Fig. 7B). For higher levels of inhibitor expression, the mean mass of the cell is significantly reduced for both slowly (Fig. 7C) and rapidly (not shown) binding cyclin-Cdc2 inhibitors.
In the period-doubling case (Fig. 7B), the slowly binding cyclin-Cdc2 inhibitor has the effect of speeding up the cell cycle by boosting the rise and fall of cyclin-Cdc2 as explained above. However, the resulting decrease in cell division period causes the mean cell mass to fall and the Rum1 concentration to rise. Thus, oscillations are delayed until the cell mass increases sufficiently to reduce Rum1 concentration. Then the cyclin-Cdc2 inhibitor once again forces the cell to divide rapidly and the cell mass drops.
When we increase the level expression of the slowly binding cyclin-Cdc2 inhibitor, its concentration is boosted sufficiently to reduce the rise in Rum1 concentration that occurs at low cell mass. Thus, cell division proceeds at a lower cell mass (Fig. 7C). Yet the frequency of oscillations cannot be increased because the presence of Rum1 ensures that cell division is entrained to the mass doubling time. On the other hand, a rapidly binding cyclin-Cdc2 inhibitor also causes a reduction of the mean cell mass because it acts as a biochemical buffer of free cyclin-Cdc2. The inhibitor helps to maintain a higher level of free cyclin-Cdc2 by releasing it from the bound form. The rise in Rum1 concentration is counteracted by the increased cyclin-Cdc2 concentrations and cell division proceeds at a lower mean cell mass.
Discussion
In this study, we show that the expression of a single protein (an inhibitor of cyclin or a cyclin complex) is a possible mechanism for precisely controlling a variety of features of the CDC. The nature of the effect depends, in part, on the characteristics of the inhibitor (i.e., the level of expression, the binding constant, and the rate of binding) and, in part, on the dynamics of the CDC.
In the simplest case (the Goldbeter model), the effects of the inhibitor are the most straightforward. The inhibitor can increase or decrease the frequency of cell division or stop division completely. The nature of the effect is determined primarily by the rate of binding of the inhibitor, i.e., a rapidly binding inhibitor decreases the frequency of oscillations and a slowly binding inhibitor increases the frequency of oscillations. In the more complex system (the Novak–Tyson model), the effect of the inhibitor is similar to that in the Goldbeter model if no regulatory checkpoints are active. Alternatively, if a mass-control checkpoint is active, the inhibitor controls the mean cell mass, but it does not affect the frequency of cell division.
To clarify these results and to draw the most general conclusions, we distinguish between local and global effects of the inhibitor. Local effects are alterations to the dynamics of the protein that is directly inhibited, i.e., cyclin or cyclin-Cdc2. Global effects are alterations to the dynamics of the complete cycle. This distinction is somewhat artificial because the local and global dynamics are coupled. However, it is useful because the local effects are the most consistent in the two models and under various cell cycle conditions, whereas the global effects tend to be more variable.
The local effects can be summarized as follows. A rapidly binding inhibitor buffers a target protein, slowing down its rise and fall during the cycle. On the other hand, a slowly binding inhibitor will introduce a delay in the response of the binding reaction such that the initial part of the rising and falling phases of the inhibited protein are accelerated. The magnitude of either effect is determined by the level of expression of the inhibitor and the equilibrium constant.
The global response of the cell to local alterations in the dynamics depends on the specific dynamics of the cell cycle. In this study, we investigate two principal cell cycle configurations with different dynamics. In both configurations, cyclin or a cyclin-complex is the target of the inhibitor. In the first situation, cycle checkpoints are inactive and the cyclin activates the downstream CDC protein through a hard threshold. In this case, a slowly binding inhibitor increases the frequency of oscillations and a rapidly binding inhibitor decreases the frequency of oscillations. If the threshold is soft, the ability of the inhibitor to increase frequency is diminished.
In the second situation, the mass control checkpoint is active. In this case, a low level of expression of a slowly binding inhibitor produces period doubling. A high level of expression of the inhibitor, or alternatively, expression of a rapidly binding inhibitor, results in a decrease in the mean cell mass.
To achieve successful control of the cell cycle experimentally, it is necessary to tune the characteristics of the inhibitor to the specific dynamics of the cell. Because of the simplicity of the control scheme, dynamic control of the inhibitor characteristics is plausible. First, the level of expression of the inhibitor can be controlled dynamically with a suitably designed promoter. Second, the binding constant and binding rate can be controlled by expressing two or more mutant forms of the inhibitor with differing characteristics. Such mutants can be designed by using current genetic manipulation techniques. Then, by varying the relative level of expression of the various mutant forms, the effective binding constant and binding rate can be altered dynamically. Another approach is to use one or more chemical inhibitors of one of the cell cycle proteins to directly modulate the cell cycle. Recently, Gray et al. (14) have used combinatorial chemistry to design compounds that bind and inhibit cyclin-dependent kinases.
Although we describe the cyclin inhibitor as a mechanism for achieving artificial control of the cell cycle, there is recent evidence that such a mechanism exists naturally in the cell. It has been shown that proteins of the p16 and p21 families, when overexpressed, slow or arrest the CDC by binding to and inhibiting cyclins and cyclin-dependent kinases (9, 15–19). This evidence suggests that these cyclin/cdk inhibitors act as switches to start and stop cell division. They also may act to tune the cell cycle dynamics when expressed at low levels.
Acknowledgments
This work was supported by the National Science Foundation and the College of Engineering at Boston University.
ABBREVIATIONS
- CDC
cell division cycle
- BP
buffering power
References
- 1.Elledge S J. Science. 1996;274:1664–1672. doi: 10.1126/science.274.5293.1664. [DOI] [PubMed] [Google Scholar]
- 2.King R W, Deshaies R J, Peters J, Kirschner M. Science. 1996;274:1652–1658. doi: 10.1126/science.274.5293.1652. [DOI] [PubMed] [Google Scholar]
- 3.Murray A W, Kirschner M W. Science. 1989;246:614–621. doi: 10.1126/science.2683077. [DOI] [PubMed] [Google Scholar]
- 4.Sherr C J. Science. 1996;274:1672–1677. doi: 10.1126/science.274.5293.1672. [DOI] [PubMed] [Google Scholar]
- 5.Stillman B. Science. 1996;274:1659–1664. doi: 10.1126/science.274.5293.1659. [DOI] [PubMed] [Google Scholar]
- 6.Goldbeter A. Proc Natl Acad Sci USA. 1991;88:9107–9111. doi: 10.1073/pnas.88.20.9107. [DOI] [PMC free article] [PubMed] [Google Scholar]
- 7.Goldbeter A. Biochemical Oscillations and Cellular Rhythms: The Molecular Bases of Periodic and Chaotic Behavior. Cambridge, U.K.: Cambridge Univ. Press; 1996. [Google Scholar]
- 8.Novak B, Tyson J J. Proc Natl Acad Sci USA. 1997;94:9147–9152. doi: 10.1073/pnas.94.17.9147. [DOI] [PMC free article] [PubMed] [Google Scholar]
- 9.Sekiguchi T, Hunter T. Oncogene. 1998;16:369–380. doi: 10.1038/sj.onc.1201539. [DOI] [PubMed] [Google Scholar]
- 10.Sel’kov E E. Eur J Biochem. 1968;4:79–86. doi: 10.1111/j.1432-1033.1968.tb00175.x. [DOI] [PubMed] [Google Scholar]
- 11.Sel’kov E E. FEBS Proc Meet. 1972;25:145–161. [Google Scholar]
- 12.Zhabotinsky A M. Concentrational Self-Oscillations. Moscow: Nauka; 1974. , in Russian. [Google Scholar]
- 13.Goldbeter A, Guilmot J M. J Phys Chem. 1996;100:19174–19181. [Google Scholar]
- 14.Gray N S, Wodicka L, Thunnissen A M W H, Norman T C, Kwon S, Espinoza F H, Morgan D O, Barnes G, LeClerc S, Meijer L, et al. Science. 1998;281:533–538. doi: 10.1126/science.281.5376.533. [DOI] [PubMed] [Google Scholar]
- 15.El-Diery W S, Tokino T, Velculescu V E, Levy D B, Parsons R, Trent J M, Lin D, Mercer W E, Kinzler K W, Vogelstein B. Cell. 1993;75:817–825. doi: 10.1016/0092-8674(93)90500-p. [DOI] [PubMed] [Google Scholar]
- 16.Sherr C J, Roberts J M. Genes Dev. 1995;9:1149–1163. doi: 10.1101/gad.9.10.1149. [DOI] [PubMed] [Google Scholar]
- 17.Watanabe H, Pan Z, Schreiber-Agus N, DePinho R, Hurwitz J, Xiong Y. Proc Natl Acad Sci USA. 1998;95:1392–1397. doi: 10.1073/pnas.95.4.1392. [DOI] [PMC free article] [PubMed] [Google Scholar]
- 18.Kwon T K, Nordin A A. Oncogene. 1998;16:755–762. doi: 10.1038/sj.onc.1201586. [DOI] [PubMed] [Google Scholar]
- 19.Medema R H, Klompmaker R, Smits V A J, Rijksen G. Oncogene. 1998;16:431–441. doi: 10.1038/sj.onc.1201558. [DOI] [PubMed] [Google Scholar]


