

Abstract
The mature nephron forms from a simple epithelial vesicle into an elaborate structure with distinct regions of specialized physiological function. The molecular components driving the process of nephron development are not well understood. To identify genes that may be informative in this process we conducted a transcriptional profiling screen using Wnt4 mutant kidneys. In Wnt4 −/− homozygous mice, condensates and pretubular aggregates are induced, however, epithelial renal vesicles fail to form and subsequent tubulogenesis is blocked. A transcriptional profile comparison between wildtype and Wnt4−/− mutant kidneys at E14.5 was performed using Affymetrix oligonucleotide microarrays to identify nephron-expressed genes. This approach identified 236 genes with expression levels >1.8 fold higher in wildtype versus mutant kidneys, amongst these were a number of known nephron component markers confirming the validity of the screen. These results were further detailed by wholemount in situ hybridization (WISH) of E15.5 urogenital systems (UGS). We annotated the spatial expression pattern of these genes into eight categories of expression. Genes expressed in renal vesicle and their derivatives, structures absent in the mutant, accounted for the largest number of the observed expression patterns. A number of additional genes in areas not directly overlapping the Wnt4 expression domain were also identified including the cap mesenchyme, the collecting duct, and the cortical interstitium. This study provides a useful compendium of molecular markers for the study of nephrogenesis.
Keywords: nephrogenesis, mesenchymal to epithelial transition, tubulogenesis, kidney development
1. Results and Discussion
1.1 Screen for genes in nephron formation
The formation of nephrons in the mammalian kidney utilizes several key developmental mechanisms including reciprocal induction of target cells by secreted factors, mesenchymal-to-epithelial cell transitions, morphogenesis of epithelial tubules, and patterning of these tubules (Bates, 2007; Costantini, 2006; Dressler, 2006; Yu et al., 2004). The process of nephron formation begins with the outgrowth of the ureteric bud from the Wolffian duct. The ureteric bud invades the adjacent metanephric mesenchyme, initiating a reciprocal inductive interaction that causes the ureteric bud to branch and the responding mesenchyme to condense around the branch tips, forming the cap mesenchyme. The interaction of these two initial tissues begins a cascade of nephron development that repeats to form each nephron. The ureteric bud forms the collecting duct system of the kidney, while the epithelial nephron arises from progenitors within the cap mesenchyme. In this latter process, a subset of the cap mesenchyme coalesces to form the pretubular aggregate beneath the tips of the ureteric epithelium. The cells of the aggregate then undergo a mesenchymal-to-epithelial transition (MET) to form the renal vesicle (RV), the precursor of the nephron. From this point, the RV undergoes an extensive morphogenesis, elongating to form first the comma-body, then the S-shaped body (SB) before maturing into the complex nephron responsible for renal function. Patterning of these intermediate structures establishes the various physiological domains of the mature nephron critical for proper function.
Studies of several signaling pathways, as well as transcription factors, have revealed genes involved in the patterning the nephron including Fgf8 (Grieshammer et al., 2005), Pou3f3 (Nakai et al., 2003),Sprouty (Basson et al., 2005; Basson et al., 2006), Notch/presenillins (Cheng et al., 2007; Cheng et al., 2003; McCright et al., 2002), and Lhx1 (Kobayashi et al., 2005). In particular, genetic studies have shown several members of the Wnt family of lipid-modified secreted glycoproteins have important roles in the initiation and maintenance of nephron formation and branching morphogenesis (Carroll et al., 2005; Kispert et al., 1998; Majumdar et al., 2003; Stark et al., 1994). One of these, Wnt4, has an essential role in the transition of the pretubular aggregate to a renal vesicle through the canonical β-catenin dependant Wnt signaling pathway (Park et al., 2007; Stark et al., 1994). In Wnt4 null mutants, the mesenchyme undergoes an inductive interaction initiated by the ureteric bud; however, the inductive process is not maintained. Consequently, renal vesicles and their derivative nephrons are absent in Wnt4 mutants. The absence of renal vesicles and more mature nephron derivatives provides the basis for a broad screen for molecular components of nephron development.
We have used microarray profiling of Wnt4 mutant kidneys to identify genes expressed during nephron morphogenesis. Wholemount in situ hybridization (WISH) was performed to examine expression of differentially expressed genes, and their spatial expression patterns were annotated using an anatomical ontology (Little et al., 2007). This screen efficiently identified genes expressed in the developing nephron structures generating a large set of new markers for functional studies.
1.2 Transcriptional profiling of Wnt4 mutant kidneys
Wnt4 plays an essential role in the formation of epithelial renal vesicles from pretubular aggregates. Consequently, Wnt4 mutant kidneys lack nephrons while retaining mesenchymal and ureteric epithelial structures. To identify genes expressed in the developing nephron, we performed transcriptional profiling of E14.5 Wnt4 mutant kidneys. This time point was selected because most mature nephron components are present in the wildtype along with every developmental stage of nephron formation (e.g. renal vesicle, S-shaped body). An exception, the loop-of-Henle (LOH), does not progress beyond the anlage stage until after E16.5 (Cebrián et al., 2004; Kim et al., 2002). By comparing wildtype to Wnt4 mutant, we sought to identify genes expressed in the nephron structures that were present in the wildtype, but absent in Wnt4 mutant kidneys. This experimental design was used to identify a large number of genes with expression patterns limited to the developing nephron. While direct gene targets of the Wnt4 signaling pathway may be included in the results, an earlier time point for the comparison when the molecular phenotype first emerges (e.g. E12.5) would be better suited for such a goal. Here, we are focused on identifying a broad collection of nephron genes, including those from later nephron structures that would not be under direct control of Wnt4 signaling.
We also note that our design focuses on genes expressed at higher levels in the wildtype versus the Wnt4 null mutants (i.e. expressed in the structures missing in the mutants). A cursory examination of genes enriched in the Wnt4 mutant vs. the wildtype shows an abundant representation of genes expressed in the ureter. This is not surprising given the normal size of the ureter compared to the mutant mesenchymal tissue (FIG. 1b.). While the intention here is to present nephron enriched genes, the array data is available publicly available for other useful comparisons.
FIG. 1. Wnt4 null mutant kidneys fail to undergo tubulogenesis.

A) Schematic depicting the formation of nephrons from the precursor cap mesenchyme population. In Wnt4 mutant kidneys condensation and pretubular aggregate formation initiate normally, but the mesenchymal-to-epithelial transition (MET) fails to occur and tubule development is blocked. B) Isolated wildtype and mutant kidneys from E14.5. The Wnt4 phenotype, an absence of nephrons, is readily evident by this time.
Initially, we used Affymetrix MG-U74Av2 oligonucleotide arrays to profile expression from E14.5 wildtype and Wnt4 mutant whole kidneys (FIG. 1b). One pair of wildtype kidneys was sufficient to produce 5ug of total RNA, the amount needed to meet the requirements for a single round amplification. However due to the small size of the Wnt4 mutant kidneys, 8–10 Wnt4 mutant kidneys were pooled to isolate requisite RNA. As a result, each wildtype biological replicate represents two kidneys from a single E14.5 embryo, whereas each Wnt4 mutant replicate represents 8–10 pooled kidneys from 4–5 mutant embryos. We consider these “minimally pooled biological replicates”. Four wildtype biological replicates and three Wnt4 mutant biological replicate samples were amplified, labeled and hybridized to test arrays to assay target quality. One of the labeled mutant samples (i.e. labeled targets) that failed to meet minimal criteria was rejected. The remaining two labeled Wnt4 mutant samples and all four labeled wildtype samples were hybridized to MG-U74Av2 arrays. All raw data and scan reports were submitted and are available from the Gene Expression Omnibus (GEO) at the National Center for Biotechnology Information (NCBI) as GEO Series GSE6288.
The Affymetrix output from the six hybridizations was imported into the Rosetta Resolver Analysis software (Version 4) for analysis. We evaluated the quality of the profiles by first examining Absent/Present calls in the wildtype samples for a number of genes well studied in the kidney. Wnt4, Pax2, Pax8, Lhx1, Cadherins 1, 2, 6, 11, and GDNF all met the criteria for Present calls (p-value <0.01) as expected. Some genes failed to meet the statistical cutoff though they are expressed in E14.5 kidney. These included Fgf8 (Grieshammer et al., 2005), ret (Pachnis et al., 1993; Schuchardt et al., 1994), Pou3f3 (Nakai et al., 2003), Wnt7b (Kispert et al., 1996; Patterson et al., 2001), Ihh (Valentini et al., 1997), and Shh (Yu et al., 2002). Overall, the wildtype profiles had 6824 Present calls (54.9%) and the Wnt4 mutant profiles had 6628 Present calls (53.4%). These percentages are consistent with our experience, and that of others for baseline comparisons.
The Wnt4 mutant profile was compared to the wildtype control using Resolver with a p-value cutoff of <0.001 as a starting point. The MvA plot (i.e. ratio vs. mean) of this comparison is shown in FIG. 2. Labeled targets failing the p-value cutoff were considered “unchanged” and are shown in light grey. There were 11,049 targets unchanged in this comparison (88.9%). Those targets statistically lower, or down-regulated, in wildtype vs. Wnt4 mutant kidneys are below the centerline and colored green (597; 4.8%). This set of genes is not the focus of this particular study. Targets statistically higher, or upregulated, in the wildtype vs. Wnt4 mutant are shown in red and blue above the centerline (776; 6.2%). We ranked these statistical differences by fold change focusing solely on those genes expressed at higher levels in the wildtype (nephrons forming) than the Wnt4 mutant (nephrons absent). We selected a minimal fold change cutoff at 1.8 fold higher in wildtype than Wnt4 mutant identifying 268 of the 776 significantly up-regulated gene transcripts (colored blue in FIG. 2). This list resolved to 236 unique genes once duplicates were removed. A partial list of these differentially expressed genes is shown in Table 1 (full list in Supplemental data).
FIG. 2. Microarray analysis to identify genetic markers of the developing nephron.
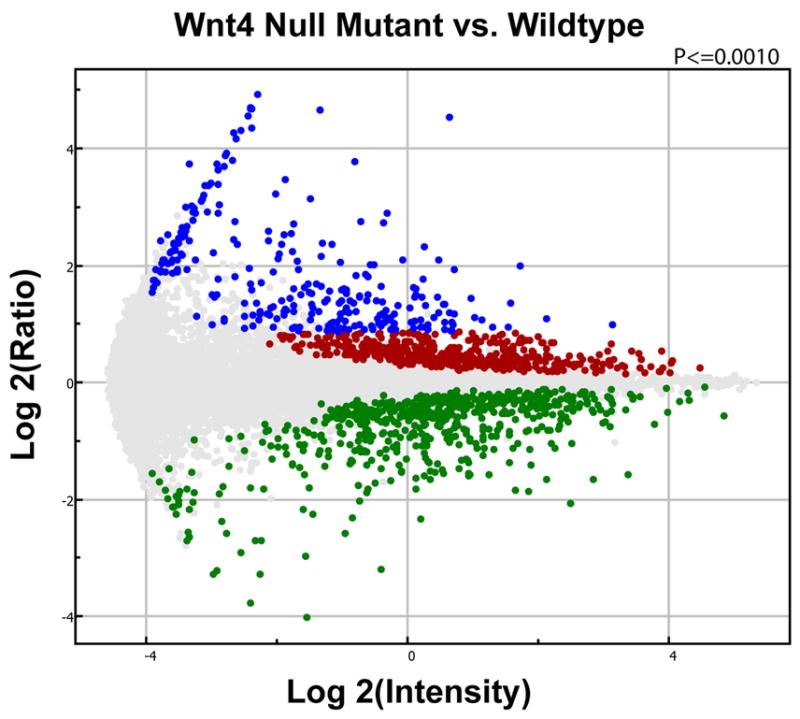
Replicate samples of E14.5 wt & Wnt4 mutant kidneys were profiled on Affymetrix MG-U74Av2 arrays. We focused on genes showing increased expression in the wildtype sample (nephron tubules forming) versus Wnt4 mutant (no nephron tubules). Resolver data analysis was performed using a p-value cutoff of <0.001 (both green and blue data points), and a minimal fold-change of >1.80 fold higher in wildtype kidneys vs. Wnt4 mutant kidneys identifying 236 genes (blue data points only).
Table 1.
Genes absent from or showing reduced expression in Wnt4 mutant kidneys.
| Gene Symbol | Sequence Description | GeneID | Mutant | Wildtype | Fold Change |
|---|---|---|---|---|---|
| Wnt4 | wingless-related MMTV Integration site 4 | 22417 | A | P | 29.80 |
| Slc12a1 | Solute & Carrier family 12, member 1 | 20495 | A | P | 25.55 |
| Dll1 | delta-like 1 homolog (Drosophila) | 13388 | A | P | 25.38 |
| Pdzk1 | PDZ domain containing 1 | 59020 | A | P | 25.30 |
| Fxyd2 | FXYD domain-containing ion transport regulator 2 | 11936 | A | P | 24.71 |
| Pcp4 | Purkinje cell protein 4 | 18546 | A | P | 23.04 |
| Hdc | histidine decarboxylase cluster | 15186 | A | P | 19.96 |
| Keg1 | kidney expressed gene 1 | 64697 | A | P | 19.67 |
| Kdap | kidney derived aspartic protease-like protein | 16541 | A | A | 14.48 |
| Dkk1 | dickkopf homolog 1 (Xenopus laevis) | 13380 | A | P | 12.83 |
| Ptpro | protein tyrosine phosphatase, receptor type, O | 19277 | A | P | 12.18 |
| Slc34a1 | solute carrier family 34 (sodium phosphate), member 1 | 20505 | A | P | 10.83 |
| Mafb | v-maf musculoaponneurotic fibrosarcoma oncogene fam | 16658 | A | P | 10.42 |
| Lrp6 | low density lipoprotein-related protein 6 | 16974 | A | P | 10.32 |
| Slc1a7 | solute carrier family 1, member 7 | 20514 | A | P | 10.19 |
| Hsd3b4 | hydroxysteroid dehydrogenase-4, delta<5>-3-beta | 15495 | A | P | 9.23 |
| Ug12b5 | UDP-glucuronosyltransferase 2 family, member 5 | 22238 | A | P | 8.69 |
| Pax8 | paired box gene 8 | 18510 | P | P | 8.67 |
| Fn1 | fibronectin 1 | 13629 | A | P | 8.03 |
| Vil | Villn | 22349 | A | P | 7.96 |
| Cldn2 | claudin 2 | 12738 | A | A | 7.83 |
| Sprr1a | small proline-rich protein 1A | 20753 | A | P | 7.80 |
| Hao3 | Hydroxyacid oxidase (glycolate oxidase) 3 | 56185 | A | P | 7.41 |
| Ren1 | rennin 1 structural | 19701 | P | P | 7.37 |
| Cideb | cell death-including DNA fragmentation factor, alpha B | 12684 | A | P | 6.75 |
| Avdf | androgen regulated vas deferens protein | 11997 | P | P | 6.65 |
| Fgf8 | fibroblast growth factor 8 | 14179 | A | A | 5.92 |
| Ace | angiotensin converting enzyme | 11421 | A | P | 5.80 |
| Lrp2 | Lrp2 (Lrp2) mRNA, partial cds | 14725 | A | P | 5.74 |
| Orct1 | organic cationic transporter-like 1 | 18399 | A | A | 5.62 |
| Afp | alpha fetoprotein | 11576 | A | P | 5.49 |
| Sim2 | single-minded 2 | 20465 | A | A | 5.45 |
| Tcf2 | transcription factor 2 | 21410 | P | P | 5.15 |
| Ret | ret proto-oncogene | 19713 | A | A | 5.11 |
| Lhx1 | LIM homeobox protein 1 | 16869 | A | P | 5.05 |
| Lrp4 | low density lipoprotein-related protein 4 | 53419 | A | P | 4.78 |
| Sprr2f | small protein-rich protein 2F | 20760 | P | P | 4.67 |
| Hes5 | hairy and enhancer of split 5, (Drosophila) | 15208 | A | A | 4.58 |
| Aldh1a4 | aldehyde dehydrogenase family 1, subfamily A4 | 26358 | A | P | 4.18 |
| Cdh6 | cadherin 6 | 12563 | P | P | 4.15 |
| Calb3 | calbindin-D9K | 12309 | A | P | 4.06 |
| Kl | Klotho | 16591 | A | A | 4.03 |
| Lama1 | laminin, alpha 1 | 16772 | A | P | 3.99 |
| Fabp3 | fatty acid binding protein 3, muscle and heart | 14077 | A | P | 3.74 |
| Sim1 | Mus musculus single-minded protein 1 (Sim1) gene | AF038857 | A | P | 3.22 |
| Tsg118 | Mus musculus TSG118 (Tsg118) mRNA | 66356 | P | P | 2.98 |
| Uncx4.1 | Unc4.1 homeobox (C.elegans) | 22255 | P | P | 2.69 |
| Hey1 | hairy/enhancer-of-split related with YRPW motif 1 | 15213 | P | P | 2.58 |
| Tcn2 | transcobalamin 2 | 21452 | P | P | 2.57 |
| Sdc4 | syndecan 4 | 20971 | A | A | 2.55 |
| Cldn5 | claudin 5 | 12741 | P | P | 2.45 |
| Cited1 | Cbp/p300-interacting transact w/Glu/Asp-rich domain 1 | 12705 | P | P | 2.26 |
| Notch1 | Notch gene homolog 1, (Drosophila) | 18128 | P | P | 2.16 |
| Acadm | acetyl-Coenzyme A dehydrogenase, medium chain | 11364 | P | P | 2.13 |
| Hoxa10 | homeo box A10 | 15395 | P | P | 2.06 |
| ItgA6a | M.musculus mRNA for integrin alpha6 subunit. | 16403 | P | P | 2.06 |
Table 1 shows the calculated fold change between the samples and the respective Absent/Present (A/P) calls for each sample. Note here that A/P calls are calculated independent of a statistical comparison between mutant and wildtype. Instead, these calls are calculated against an empirically determined standard (Affymetrix). Therefore, it is possible to have an “Absent” call in both samples (each sample compared to the empirical Absent) while still showing a significant difference between mutant and wildtype (e.g. Fgf8, Table 1) if the variance of each is small enough to compare the samples to each other. Even with a low variance, low abundance genes may suffer a higher rate of false positives (i.e. false difference calls) when comparing profiles. One approach would be to filter out low abundance genes before validating by in situ hybridization. In our study, we chose to do the entire set by in situ hybridization, and therefore identifying false positives in the validation experiments. Other important general caveats of microarray profiling experiments that may affect detection sensitivity include probe performance, 3′ bias in labeled samples, and highly restricted expression. A good example of the latter in this study is Ret. Ret is expressed at high levels, but only in the ureteric tips. Therefore, in the context of the whole kidney sample the Ret transcript appears to be of low abundance in our assay.
Genes known from prior work in the field to be expressed in structures absent in Wnt4 mutants are noted in bold print. Noticeably, Wnt4 shows the highest fold change in comparing these samples. Fgf8 is reduced in Wnt4 mutants and Lhx1 requires Wnt4 for normal expression (Kobayashi et al., 2005). Both of these markers are significantly higher in the wildtype versus the Wnt4 mutant as expected. The number of expected differences appearing in the list strengthened our view that this screen effectively identified genes expressed in renal structures missing from Wnt4 mutants.
1.3 In situ hybridization of embryonic urogenital systems
We next sought to examine the spatial expression and validate the profiling result of each of these genes using WISH analysis. Of the 236 genes from the profiling analysis, we were able to generate riboprobes for 217 using the various clone sources available to us including a BMAP-UG library, RIKEN DNAbook (Kawai and Hayashizaki, 2003), and RT-PCR from kidney cDNA. All in situ data generated as well as details on each probe was submitted to the GUDMAP database (www.gudmap.org).
We performed WISH on E15.5 whole urogenital systems (UGS) to assess the spatial distribution of the genes identified by the profiling comparison. The E15.5 time point was used after a pilot study comparing the WISH data from 70 probes done on both E14.5 and E15.5 UGS samples. We found the increased number of developing nephron structures in the E15.5 samples aided our ability to annotate the expression and the photography. In this comparison set, we did not find any differences in the expression patterns other than the number of structures labeled. Therefore, the E15.5 time point is appropriate for this type of screen, i.e. to identify a collection of genes in the nephron. Using the annotation guidelines and the anatomical ontology established by GUDMAP, we annotated the expression of all 217 genes by in situ hybridization using nine expression categories summarized in Table 2 (Little et al., 2007).
Table 2.
Summary of Whole-mount in situ hybridization annotation data.
| Ureteric Tip | Ureteric Trunk | Renal Interstitiym | Cap Mesench. | Early Tubule | Late Tubule | Ureter | Renal Vasculature | Not Detect/Ubiquitous |
|---|---|---|---|---|---|---|---|---|
| 5% | 19% | 8% | 9% | 23% | 26% | 3% | 13% | 33% |
We found the largest class of expression to be localized to epithelial nephron tubules, covered by two categories. The early tubule refers to the developmental nephron encompassing the renal vesicle and S-shaped body. The “Late Tubule” class refers to maturing nephron structures such as the proximal and distal convoluted tubules, the LOH, and the glomerulus. The developing nephrons are located in the cortex and have distinct patterns of expression – e.g. Wnt4, Pax8, Lhx1 are developmental markers (Kobayashi et al., 2005; Little et al., 2007; Stark et al., 1994). The maturing nephron structures are deeper within the kidney and markers here include the proximal tubule specific gene (Slc34a1)(Madjdpour et al., 2004). This organization permits us to annotate expression patterns using WISH accurately. Viewing with a stereoscope aids this process. A reference set of WISH markers that were helpful in annotating samples can be viewed at gudmap.org (Little et al., 2007).
FIG. 3 shows some examples from the “early” and “late” tubules classes. FIG. 3A shows early tubule expressed genes. Notable are the well documented Wnt4, Pax8, and Lhx1 expression. Dkk1 is of interest in the Wnt signaling pathway and shows two types of expression patterns. The sharp spheres have spacing and depth suggesting expression restricted to a region of the S-shaped body. This was confirmed on follow-up section in situ hybridization (SISH) analysis (data not shown). In addition to the epithelial expression, Dkk1 is expressed in mesenchymal cells in the interstitium. This presents in the wholemounts as a diffuse pattern intercalated between the expressing SBs. In comparison, Dll1 is expressed in a near exact overlapping domain in the SB but not in the interstitium. Note the similar spacing of the Dll1 expression to the epithelial Dkk1 expression. This illustrates the level of detail WISH can provide for cortical patterns that are often difficult to discern by SISH.
FIG. 3. Genes expressed in E15.5 renal vesicle and its derivatives.

A) Genes expressed in early-formed structures including the renal vesicle and S-shaped body. Dkk1 and Dll1 have similar expression domains in the S-shaped body, but Dkk1 has an additional interstitial domain of expression. B) Genes expressed in more mature nephron structures, frequently the proximal convoluted tubules.
FIG. 3b. shows several genes expressed in the PCT. At E15.5, the glomerulus and PCT are the most extensively developed component of the mature nephron tubule. Extensive, deeper, epithelial expression is seen with these probes. Pdzk1 (Gisler et al., 2003), Slc34a1 (Madjdpour et al., 2004), and Tcn2 are known to be expressed in the proximal convoluted tubule (studies have shown Pdzk1 & Slc34a1 interact in yeast 2-hybrid screens) (Capuano et al., 2005) confirming the spatial identification of this class of genes. Villin is also present in the brush border of cells that make up the PCT. At this stage of kidney development, the proximal tubule is expanding more extensively than the distal tubule. For genes expressed throughout a given tubule segment, this difference can aid in the identification of proximal vs. distal tubules. Kdap is expressed in the PST and has a sharp boundary with the LOH (Mori et al., 2003).
Another category of genes mapped to cell populations that were present in Wnt4 mutants (Fig. 4). These include know markers of cap mesenchyme such as Cited1 (Boyle et al., 2007), but also FXYD6, a member of the FXYD-domain family of ion transport regulator genes that regulate Na, K-ATPase activity. FXDY6 has been shown to play a role in this process in the cochlea (Delprat et al., 2007). Its expression outside of later epithelial structures in the cap mesenchyme is unexpected (Burrow et al., 1999).
FIG. 4. Examples of genes expressed in the cortical kidney mesenchyme.
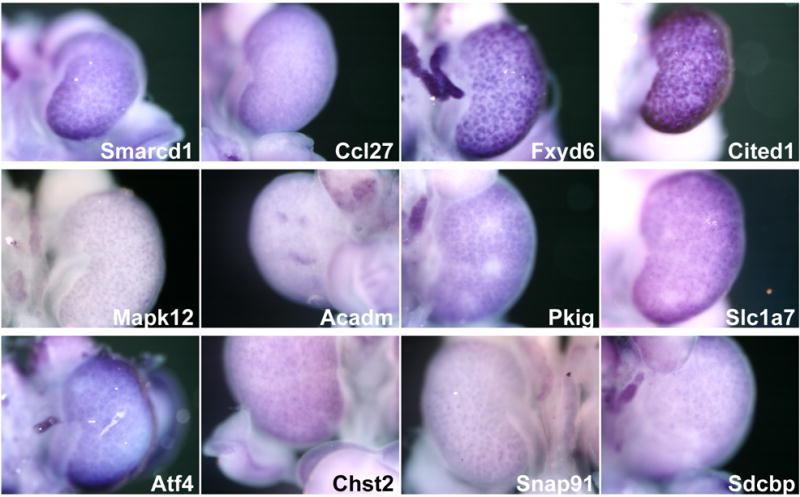
Several genes exhibited expression in the cap condensate, that include precursors to the epithelial nephron (e.g. Fxyd6, Cited1, Mapk12. Pkig). Others showed punctate patterns of expression in this domain (e.g. Slx1a7, Chst2, and Sdcbp).
We also identified several genes that are normally expressed in the epithelial collecting duct (FIG 5a). These include the transmembrane heparan sulfate proteoglycan Sdc4. Interestingly sulfated proteoglycans modulate epithelial branching morphogenesis in organ culture (Steer et al., 2004). Also Tcf2, which has been previously associated with kidney disease (Coffinier et al., 1999; Edghill et al., 2006). Of particular interest in this collection is Fhl1. Fhl1 is expressed in regions of the CD and spans the connecting tubule and portions of the distal tubule segment. Fig 5b also shows two examples of genes expressed in forming vasculature and possibly neural derivatives (Schip1) (Goutebroze et al., 2000). Claudin5 has been reported in renal vasculature (Reyes et al., 2002), whereas Schip1 has only been associated with neural structures (Neurofibromatosis type 2 (NF2) protein). To date, the development of neural cell populations is poorly understood in the developing kidney.
FIG. 5. Genes expressed in the collecting duct and other structures at E15.5.

A) Though the collecting duct is present in the Wnt4 mutant, a group of genes expressed in the duct was detected in the profile comparison. Pcbd and Tcf2 are typical of this class of genes with expression limited to the collecting duct. Fhl1 is expressed in the collecting duct tip but also continues through the connecting tubule into part of the distal convoluted tubule. B) Some patterns of expression where unique, such as Cldn5, suggesting expression was limited to subdomains of better understood patterns. Schip1 exhibits a somewhat unusual interstitial pattern.
1.4 Annotation of expression patterns
We annotated the pattern of gene expression we observed using the anatomical ontology recently published by the GUDMAP consortium (Little et al., 2007) at the level of detail permitted by WISH (Table 2). This summarizes the percentage of all genes examined that were scored as expressed in that structure. These data are not exclusive as many genes are expressed in more than one cell population. Further, only positive expression patterns may be scored with confidence, as false negatives due to probe problems are difficult to identify. Note that 19% of the probes tested gave no signal. To gain confidence in our annotation approach, we performed section in situ hybridization (SISH) on a set of representative genes to confirm details of our observations of the WISH samples. FIG. 6 shows representatives from four of the annotated classes; cap mesenchyme, early and late tubule, and collecting duct. It is important to note the depth of the observed patterns in the WISH samples aids in determining early and late tubules expression differences (e.g. compare Pax8 and Slc34a1 in the upper panels of FIG. 6.).
FIG. 6. High-resolution analysis of representatives from four expression classes.
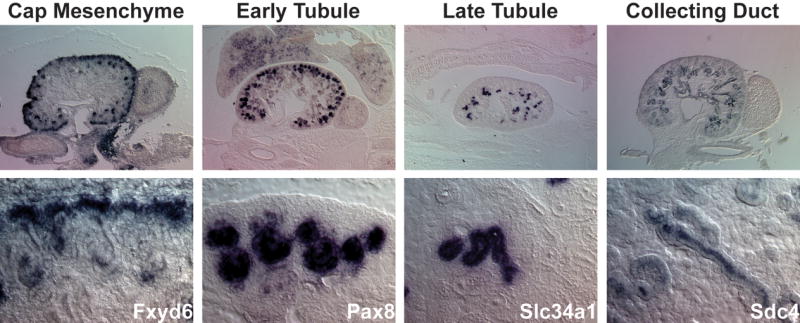
Section in situ hybridization (SISH) was done on E15.5 kidneys with representatives from each of the classes annotated in the wholemounts. Note that the “collecting duct” label includes ureteric trunk and tip. The bottom panels are higher magnifications to illustrate detail. These categories are not mutually exclusive as Fxyd6 and Sdc4 both have expression in additional sub-domains.
1.5 Profiling cell state
Our effort here was to expand the know repertoire of spatially significant genes within the context of mammalian nephrogenesis through the use of microarray screens. Recently, there have been genome-wide efforts to catalogue all genes in an organ to provide a framework for understanding development and disease by in situ expression analysis (Gray et al., 2004; Lein et al., 2007; McKee et al., 2005). The ultimate aim is to describe the spatial and temporal expression pattern of all genes in an organ or tissue with ever increasing resolution. With the introduction of microarray technologies, there have been several efforts to focus expression studies on specific structures by creating expression profiles of those structures, then secondarily generating spatial information by in situ approaches utilizing these. This strategy can significantly increase the resolution of the screen. One approach has profiled small subsets of cells generated through dissection (Mitchell et al., 2006), cell sorting (Takemoto et al., 2006), or laser-capture microdissection (Potter et al., 2007). The resulting profile provides more specific information about the cell “state” of the profiled population. As we demonstrate here, a second approach that uses genetic mutants that have a very specific phenotype, allows broad information to be collected on cell populations (Chen et al., 2006).
Together, the data from these types of studies provides both useful markers to improve our molecular understanding of emerging cell types as well as more specific information on individual genes whose function may be more critically linked to the developmental mechanisms at play.
Our profiling screen effectively identified genes expressed during tubulogenesis with over 50% of those assayed expressed in renal vesicles and/or later derivatives. In addition, all major expression domains are represented suggesting many genes can be found in multiple domains. Given the success of this initial screen, we performed a second more comprehensive screen using Affymetrix MOE430v2 microarrays using the labeled target used in the initial experiment. This identified 983 non-redundant genes with a greater than 1.8 fold expression elevation in wildtype versus Wnt4 mutants (Supplementary Table 2). The molecular markers in these screens will aid our dissection and understanding of mammalian nephrogenesis.
2. Experimental Procedures
Mouse strains
The Wnt4+/n mouse line has been described previously (Stark et al., 1994). Wildtype Swiss Webster mice were obtained from Jackson Lab.
Gene Expression Profiling
E14.5 wildtype and Wnt4 n/+ whole kidneys were dissected and total RNA isolated with RNAzol (Tel-Test, Friendswood, TX). Labeled aRNA was made using a single round of amplification according to the manufacturers instructions (Affymetrix, Santa Clara, CA). Four wildtype and three Wnt4 mutant samples were used. One mutant sample showed poor 5′ to 3″ ratios indicating degradation, and was therefore discarded. The remaining four wildtype and two mutant samples were profiled on Affymetrix GeneChip® MG-U74Av2 arrays. The data was analyzed using Rosetta Resolver software (Rosetta Biosoftware, Seattle, WA). A p-value cutoff of 0.001 was used to identify significantly changed genes. This list was ranked by fold change differences and a secondary cutoff of <1.8 fold difference was applied. Duplicate genes were then removed leaving 236 unique genes meeting the two filtering criteria.
In situ hybridization
E14.5 and E15.5 kidneys were fixed in 4% paraformaldehyde at 4°C overnight and dehydrated in methanol. Following WISH, hybridized samples were developed in BM purple (Roche, Indianapolis, IN), stored in 80% glycerol and photographed using a Nikon DXM1200 digital camera. A full protocol from our laboratory is available on the GUDMAP website under Protocols (http://www.gudmap.org/Research/Protocols/McMahon.html). Annotation of the observed expression patterns was done in accordance with the anatomical ontology published by the GUDMAP Consortium (www.gudmap.org). Validation and annotation results are based on in situ data from E15.5 UGS samples. Note there is a normal variation of +/− 0.5 days in the collection of these samples.
Supplementary Material
Acknowledgments
Work in APM’s laboratory was funded by grants from NIH (DK054364 and DK070181). MTV was supported by an NRSA award (NIH-NIDDK F32DK060319). We thank Jing Yu and our colleagues within the GUDMAP consortium for valuable discussions.
Footnotes
Publisher's Disclaimer: This is a PDF file of an unedited manuscript that has been accepted for publication. As a service to our customers we are providing this early version of the manuscript. The manuscript will undergo copyediting, typesetting, and review of the resulting proof before it is published in its final citable form. Please note that during the production process errors may be discovered which could affect the content, and all legal disclaimers that apply to the journal pertain.
References
- Basson MA, Akbulut S, Watson-Johnson J, Simon R, Carroll TJ, Shakya R, Gross I, Martin GR, Lufkin T, McMahon AP, Wilson PD, Costantini FD, Mason IJ, Licht JD. Sprouty1 is a critical regulator of GDNF/RET-mediated kidney induction. Dev Cell. 2005;8:229–39. doi: 10.1016/j.devcel.2004.12.004. [DOI] [PubMed] [Google Scholar]
- Basson MA, Watson-Johnson J, Shakya R, Akbulut S, Hyink D, Costantini FD, Wilson PD, Mason IJ, Licht JD. Branching morphogenesis of the ureteric epithelium during kidney development is coordinated by the opposing functions of GDNF and Sprouty1. Dev Biol. 2006;299:466–77. doi: 10.1016/j.ydbio.2006.08.051. [DOI] [PubMed] [Google Scholar]
- Bates CM. Role of fibroblast growth factor receptor signaling in kidney development. Pediatr Nephrol. 2007;22:343–9. doi: 10.1007/s00467-006-0239-7. [DOI] [PubMed] [Google Scholar]
- Boyle S, Shioda T, Perantoni AO, de Caestecker M. Cited1 and Cited2 are differentially expressed in the developing kidney but are not required for nephrogenesis. Dev Dyn. 2007;236:2321–30. doi: 10.1002/dvdy.21242. [DOI] [PubMed] [Google Scholar]
- Burrow C, Devuyst O, Li X, Gatti L, Wilson P. Expression of the beta2-subunit and apical localization of Na+-K+-ATPase in metanephric kidney. Am J Physiol. 1999;277:F391–403. doi: 10.1152/ajprenal.1999.277.3.F391. [DOI] [PubMed] [Google Scholar]
- Capuano P, Bacic D, Stange G, Hernando N, Kaissling B, Pal R, Kocher O, Biber J, Wagner C, Murer H. Expression and regulation of the renal Na/phosphate cotransporter NaPi-IIa in a mouse model deficient for the PDZ protein PDZK1. Pflugers Arch. 2005;449:392–402. doi: 10.1007/s00424-004-1351-9. [DOI] [PubMed] [Google Scholar]
- Carroll TJ, Park JS, Hayashi S, Majumdar A, McMahon AP. Wnt9b plays a central role in the regulation of mesenchymal to epithelial transitions underlying organogenesis of the mammalian urogenital system. Dev Cell. 2005;9:283–92. doi: 10.1016/j.devcel.2005.05.016. [DOI] [PubMed] [Google Scholar]
- Cebrián C, Borodo K, Charles N, Herzlinger D. Morphometric index of the developing murine kidney. Dev Dyn. 2004;231:601–8. doi: 10.1002/dvdy.20143. [DOI] [PubMed] [Google Scholar]
- Chen YT, Kobayashi A, Kwan KM, Johnson RL, Behringer RR. Gene expression profiles in developing nephrons using Lim1 metanephric mesenchyme-specific conditional mutant mice. BMC Nephrol. 2006;7:1. doi: 10.1186/1471-2369-7-1. [DOI] [PMC free article] [PubMed] [Google Scholar]
- Cheng HT, Kim M, Valerius MT, Surendran K, Schuster-Gossler K, Gossler A, McMahon AP, Kopan R. Notch2, but not Notch1, is required for proximal fate acquisition in the mammalian nephron. Development. 2007 doi: 10.1242/dev.02773. [DOI] [PMC free article] [PubMed] [Google Scholar]
- Cheng HT, Miner JH, Lin M, Tansey MG, Roth K, Kopan R. Gamma-secretase activity is dispensable for mesenchyme-to-epithelium transition but required for podocyte and proximal tubule formation in developing mouse kidney. Development. 2003;130:5031–42. doi: 10.1242/dev.00697. [DOI] [PubMed] [Google Scholar]
- Coffinier C, Barra J, Babinet C, Yaniv M. Expression of the vHNF1/HNF1beta homeoprotein gene during mouse organogenesis. Mech Dev. 1999;89:211–3. doi: 10.1016/s0925-4773(99)00221-x. [DOI] [PubMed] [Google Scholar]
- Costantini F. Renal branching morphogenesis: concepts, questions, and recent advances. Differentiation. 2006;74:402–21. doi: 10.1111/j.1432-0436.2006.00106.x. [DOI] [PubMed] [Google Scholar]
- Delprat B, Schaer D, Roy S, Wang J, Puel J, Geering K. FXYD6 is a novel regulator of Na, K-ATPase expressed in the inner ear. J Biol Chem. 2007;282:7450–6. doi: 10.1074/jbc.M609872200. [DOI] [PubMed] [Google Scholar]
- Dressler GR. The cellular basis of kidney development. Annu Rev Cell Dev Biol. 2006;22:509–29. doi: 10.1146/annurev.cellbio.22.010305.104340. [DOI] [PubMed] [Google Scholar]
- Edghill E, Bingham C, Ellard S, Hattersley A. Mutations in hepatocyte nuclear factor-1beta and their related phenotypes. J Med Genet. 2006;43:84–90. doi: 10.1136/jmg.2005.032854. [DOI] [PMC free article] [PubMed] [Google Scholar]
- Gisler S, Pribanic S, Bacic D, Forrer P, Gantenbein A, Sabourin L, Tsuji A, Zhao Z, Manser E, Biber J, Murer H. PDZK1: I. a major scaffolder in brush borders of proximal tubular cells. Kidney Int. 2003;64:1733–45. doi: 10.1046/j.1523-1755.2003.00266.x. [DOI] [PubMed] [Google Scholar]
- Goutebroze L, Brault E, Muchardt C, Camonis J, Thomas G. Cloning and characterization of SCHIP-1, a novel protein interacting specifically with spliced isoforms and naturally occurring mutant NF2 proteins. Mol Cell Biol. 2000;20:1699–712. doi: 10.1128/mcb.20.5.1699-1712.2000. [DOI] [PMC free article] [PubMed] [Google Scholar]
- Gray P, Fu H, Luo P, Zhao Q, Yu J, Ferrari A, Tenzen T, Yuk D, Tsung E, Cai Z, Alberta J, Cheng L, Liu Y, Stenman J, Valerius M, Billings N, Kim H, Greenberg M, McMahon A, Rowitch D, Stiles C, Ma Q. Mouse brain organization revealed through direct genome-scale TF expression analysis. Science. 2004;306:2255–7. doi: 10.1126/science.1104935. [DOI] [PubMed] [Google Scholar]
- Grieshammer U, Cebrian C, Ilagan R, Meyers E, Herzlinger D, Martin GR. FGF8 is required for cell survival at distinct stages of nephrogenesis and for regulation of gene expression in nascent nephrons. Development. 2005;132:3847–57. doi: 10.1242/dev.01944. [DOI] [PubMed] [Google Scholar]
- Kawai J, Hayashizaki Y. DNA book. Genome Res. 2003;13:1488–95. doi: 10.1101/gr.914203. [DOI] [PMC free article] [PubMed] [Google Scholar]
- Kim Y, Kim D, Han K, Jung J, Sands J, Knepper M, Madsen K, Kim J. Expression of urea transporters in the developing rat kidney. Am J Physiol Renal Physiol. 2002;282:F530–40. doi: 10.1152/ajprenal.00246.2001. [DOI] [PubMed] [Google Scholar]
- Kispert A, Vainio S, McMahon AP. Wnt-4 is a mesenchymal signal for epithelial transformation of metanephric mesenchyme in the developing kidney. Development. 1998;125:4225–34. doi: 10.1242/dev.125.21.4225. [DOI] [PubMed] [Google Scholar]
- Kispert A, Vainio S, Shen L, Rowitch DH, McMahon AP. Proteoglycans are required for maintenance of Wnt-11 expression in the ureter tips. Development. 1996;122:3627–37. doi: 10.1242/dev.122.11.3627. [DOI] [PubMed] [Google Scholar]
- Kobayashi A, Kwan KM, Carroll TJ, McMahon AP, Mendelsohn CL, Behringer RR. Distinct and sequential tissue-specific activities of the LIM-class homeobox gene Lim1 for tubular morphogenesis during kidney development. Development. 2005;132:2809–23. doi: 10.1242/dev.01858. [DOI] [PubMed] [Google Scholar]
- Lein E, Hawrylycz M, Ao N, Ayres M, Bensinger A, Bernard A, Boe A, Boguski M, Brockway K, Byrnes E, Chen L, Chen L, Chen T, Chin M, Chong J, Crook B, Czaplinska A, Dang C, Datta S, Dee N, Desaki A, Desta T, Diep E, Dolbeare T, Donelan M, Dong H, Dougherty J, Duncan B, Ebbert A, Eichele G, Estin L, Faber C, Facer B, Fields R, Fischer S, Fliss T, Frensley C, Gates S, Glattfelder K, Halverson K, Hart M, Hohmann J, Howell M, Jeung D, Johnson R, Karr P, Kawal R, Kidney J, Knapik R, Kuan C, Lake J, Laramee A, Larsen K, Lau C, Lemon T, Liang A, Liu Y, Luong L, Michaels J, Morgan J, Morgan R, Mortrud M, Mosqueda N, Ng L, Ng R, Orta G, Overly C, Pak T, Parry S, Pathak S, Pearson O, Puchalski R, Riley Z, Rockett H, Rowland S, Royall J, Ruiz M, Sarno N, Schaffnit K, Shapovalova N, Sivisay T, Slaughterbeck C, Smith S, Smith K, Smith B, Sodt A, Stewart N, Stumpf K, Sunkin S, Sutram M, Tam A, Teemer C, Thaller C, Thompson C, Varnam L, Visel A, Whitlock R, Wohnoutka P, Wolkey C, Wong V, et al. Genome-wide atlas of gene expression in the adult mouse brain. Nature. 2007;445:168–76. doi: 10.1038/nature05453. [DOI] [PubMed] [Google Scholar]
- Little MH, Brennan J, Georgas K, Davies JA, Davidson DR, Baldock RA, Beverdam A, Bertram JF, Capel B, Chiu HS, Clements D, Cullen-McEwen L, Fleming J, Gilbert T, Herzlinger D, Houghton D, Kaufman MH, Kleymenova E, Koopman PA, Lewis AG, McMahon AP, Mendelsohn CL, Mitchell EK, Rumballe BA, Sweeney DE, Valerius MT, Yamada G, Yang Y, Yu J. A high-resolution anatomical ontology of the developing murine genitourinary tract. Gene Expr Patterns. 2007;7:680–99. doi: 10.1016/j.modgep.2007.03.002. [DOI] [PMC free article] [PubMed] [Google Scholar]
- Madjdpour C, Bacic D, Kaissling B, Murer H, Biber J. Segment-specific expression of sodium-phosphate cotransporters NaPi-IIa and -IIc and interacting proteins in mouse renal proximal tubules. Pflugers Arch. 2004;448:402–10. doi: 10.1007/s00424-004-1253-x. [DOI] [PubMed] [Google Scholar]
- Majumdar A, Vainio S, Kispert A, McMahon J, McMahon AP. Wnt11 and Ret/Gdnf pathways cooperate in regulating ureteric branching during metanephric kidney development. Development. 2003;130:3175–85. doi: 10.1242/dev.00520. [DOI] [PubMed] [Google Scholar]
- McCright B, Lozier J, Gridley T. A mouse model of Alagille syndrome: Notch2 as a genetic modifier of Jag1 haploinsufficiency. Development. 2002;129:1075–82. doi: 10.1242/dev.129.4.1075. [DOI] [PubMed] [Google Scholar]
- McKee A, Minet E, Stern C, Riahi S, Stiles C, Silver P. A genome-wide in situ hybridization map of RNA-binding proteins reveals anatomically restricted expression in the developing mouse brain. BMC Dev Biol. 2005;5:14. doi: 10.1186/1471-213X-5-14. [DOI] [PMC free article] [PubMed] [Google Scholar]
- Mitchell E, Taylor D, Woods K, Davis M, Nelson A, Teasdale R, Grimmond S, Little M, Bertram J, Caruana G. Differential gene expression in the developing mouse ureter. Gene Expr Patterns. 2006;6:519–38. doi: 10.1016/j.modgep.2005.10.008. [DOI] [PubMed] [Google Scholar]
- Mori K, Yang J, Barasch J. Ureteric bud controls multiple steps in the conversion of mesenchyme to epithelia. Semin Cell Dev Biol. 2003;14:209–16. doi: 10.1016/s1084-9521(03)00023-5. [DOI] [PubMed] [Google Scholar]
- Nakai S, Sugitani Y, Sato H, Ito S, Miura Y, Ogawa M, Nishi M, Jishage K, Minowa O, Noda T. Crucial roles of Brn1 in distal tubule formation and function in mouse kidney. Development. 2003;130:4751–9. doi: 10.1242/dev.00666. [DOI] [PubMed] [Google Scholar]
- Pachnis V, Mankoo B, Costantini F. Expression of the c-ret proto-oncogene during mouse embryogenesis. Development. 1993;119:1005–17. doi: 10.1242/dev.119.4.1005. [DOI] [PubMed] [Google Scholar]
- Park JS, Valerius MT, McMahon AP. Wnt/beta-catenin signaling regulates nephron induction during mouse kidney development. Development. 2007;134:2533–9. doi: 10.1242/dev.006155. [DOI] [PubMed] [Google Scholar]
- Patterson LT, Pembaur M, Potter SS. Hoxa11 and Hoxd11 regulate branching morphogenesis of the ureteric bud in the developing kidney. Development. 2001;128:2153–61. doi: 10.1242/dev.128.11.2153. [DOI] [PubMed] [Google Scholar]
- Potter S, Hartman H, Kwan K, Behringer R, Patterson L. Laser capture-microarray analysis of Lim1 mutant kidney development. Genesis. 2007;45:432–9. doi: 10.1002/dvg.20309. [DOI] [PubMed] [Google Scholar]
- Reyes J, Lamas M, Martin D, del Carmen Namorado M, Islas S, Luna J, Tauc M, González-Mariscal L. The renal segmental distribution of claudins changes with development. Kidney Int. 2002;62:476–87. doi: 10.1046/j.1523-1755.2002.00479.x. [DOI] [PubMed] [Google Scholar]
- Schuchardt A, D’Agati V, Larsson-Blomberg L, Costantini F, Pachnis V. Defects in the kidney and enteric nervous system of mice lacking the tyrosine kinase receptor Ret. Nature. 1994;367:380–3. doi: 10.1038/367380a0. [DOI] [PubMed] [Google Scholar]
- Stark K, Vainio S, Vassileva G, McMahon AP. Epithelial transformation of metanephric mesenchyme in the developing kidney regulated by Wnt-4. Nature. 1994;372:679–83. doi: 10.1038/372679a0. [DOI] [PubMed] [Google Scholar]
- Steer D, Shah M, Bush K, Stuart R, Sampogna R, Meyer T, Schwesinger C, Bai X, Esko J, Nigam S. Regulation of ureteric bud branching morphogenesis by sulfated proteoglycans in the developing kidney. Dev Biol. 2004;272:310–27. doi: 10.1016/j.ydbio.2004.04.029. [DOI] [PubMed] [Google Scholar]
- Takemoto M, He L, Norlin J, Patrakka J, Xiao Z, Petrova T, Bondjers C, Asp J, Wallgard E, Sun Y, Samuelsson T, Mostad P, Lundin S, Miura N, Sado Y, Alitalo K, Quaggin S, Tryggvason K, Betsholtz C. Large-scale identification of genes implicated in kidney glomerulus development and function. EMBO J. 2006;25:1160–74. doi: 10.1038/sj.emboj.7601014. [DOI] [PMC free article] [PubMed] [Google Scholar]
- Valentini RP, Brookhiser WT, Park J, Yang T, Briggs J, Dressler G, Holzman LB. Post-translational processing and renal expression of mouse Indian hedgehog. J Biol Chem. 1997;272:8466–73. doi: 10.1074/jbc.272.13.8466. [DOI] [PubMed] [Google Scholar]
- Yu J, Carroll TJ, McMahon AP. Sonic hedgehog regulates proliferation and differentiation of mesenchymal cells in the mouse metanephric kidney. Development. 2002;129:5301–12. doi: 10.1242/dev.129.22.5301. [DOI] [PubMed] [Google Scholar]
- Yu J, McMahon AP, Valerius MT. Recent genetic studies of mouse kidney development. Curr Opin Genet Dev. 2004;14:550–7. doi: 10.1016/j.gde.2004.07.009. [DOI] [PubMed] [Google Scholar]
Associated Data
This section collects any data citations, data availability statements, or supplementary materials included in this article.