

Abstract
Purpose
Here we describe observation of significant instability in the output of an electromagnetic lithotripter, instability of a form that was not detected by routine methods of assessment, but was observed only by collecting many consecutive shock waves in non-stop regime.
Materials and Methods
A Dornier DoLi-50 lithotripter used exclusively for basic research was tested and approved by the regional technician. This assessment included hydrophone measures at selected power levels, with collection of about 25 shock waves per setting. Subsequent laboratory characterization employed a fiber optic hydrophone (FOPH-500) and a storage oscilloscope for data acquisition. Waveforms were collected non-stop for hundreds of pulses.
Results
Output was typically stable for >1000 shock waves, but substantial fluctuations in acoustic pressures were also observed. For example, output at power level 3 (P+ normally 44 ±2 MPa) increased dramatically (P+ >50 MPa) or dropped significantly (P+ ~30 MPa) for hundreds of shock waves. The cause of the instability was eventually traced to a faulty power supply of the lithotripter.
Conclusions
Instability in acoustic output of a lithotripter can occur and not be detected by routine methods of assessment. Collection of waveforms in non-stop regime dramatically increases the sampling size, improving the detection of instability. Had the instability we observed occurred during patient treatment, the energy delivered may well have exceeded the planned dose. Since the potential for adverse effects in lithotripsy increases as dose is increased, it would be valuable to develop ways to better monitor the acoustic output of lithotripters.
Keywords: lithotripter, shock wave, hydrophone, acoustic pressure
INTRODUCTION
Concern about adverse effects in shock wave lithotripsy has increased awareness of limiting patient exposure to shock waves, especially at high energy levels.1–3 Lithotripter shock waves can cause renal trauma, and the injury can be significant, particularly for at-risk patient groups such as children,4–5 the elderly,6 and patients with preexisting hypertension6. The long-term effects of shock wave trauma have yet to be thoroughly characterized, but recent evidence showing persistent scarring with loss of functional renal mass,7 an apparent increase in the development of diabetes mellitus among patients who have undergone lithotripsy,8 and a linkage between multiple lithotripsies and the onset of brushite stone disease,9 gives good reason to limit the shock wave dose that patients receive.
Many physicians pay very close attention to the dose of shock waves they deliver, and some lithotripters even come equipped with data acquisition programs to document shock wave number and energy levels during treatment. Such attention to shock wave dose is commendable, and seems most valuable when the acoustic output of the lithotripter has been well characterized—that is, so that the physician has confidence in knowing how much energy is being delivered at a given power setting. But, what if the lithotripter malfunctions in such a way that its acoustic output is unpredictable, delivering high energy pulses at low powers settings, or vice versa? We report such a case here.
The malfunction we describe was detected in an electromagnetic lithotripter that had been tested and approved by the manufacturer’s technician. However, the nature of the malfunction—intermittent periods of unregulated output—was not likely to have been detected by conventional methods of assessment. Once the malfunction was characterized and the data presented to the technician, the defect was identified and repaired. This report describes the method that was used to detect and characterize this acoustic variability, using a fiber optic probe hydrophone and waveform collection in non-stop regime.
MATERIALS AND METHODS
Studies were performed with a Dornier U/15/50 electromagnetic lithotripter (DoLi-50, serial # 049, Dornier Medizintechnic GmbH). The DoLi-50 has 6 power levels (PL 1–6) and can generate shock waves (SW’s) at a rate of 70–120 SW’s per minute. External triggering via ECG-simulator can be used to achieve a slower pulse repetition rate of the lithotripter as needed. In the present work all measurements were conducted at 70 SW's/minute, that is, at about 0.86 s time interval between shock waves.
The lithotripter had been maintained on a quarterly service schedule, and two months prior to these studies was tested and approved by the regional Dornier technician. For this assessment a quartz hydrophone (119M31B, Piezotronics, Depew, NY) was positioned in the test chamber that comes with the DoLi-50 maintenance kit, so that the sensitive plane surface of the hydrophone was at the focal plane of the lithotripter. Measured amplitudes of shock waves at all power levels were consistent with predicted values.
For laboratory characterization of the lithotripter we used a fiber optic hydrophone (FOPH-500, Univ. of Stuttgart).10 One advantage of this hydrophone is that it can be used for repetitive measurements in strong acoustic fields. When the glass fiber tip is broken by cavitation, a new tip can be prepared in a matter of minutes. The FOPH is regarded as state-of-the-art for measuring lithotripter shock waves, and is the hydrophone recommended in the international measurement standard.11
The fiber-optic hydrophone was calibrated before use and each time after a new tip was prepared. The sensitivity of the hydrophone is determined by the amount of laser light reflected at the glass/water interface in the absence of an acoustical signal. Fluctuation in hydrophone sensitivity accounted for variations in peak positive pressure of less than 3%. In addition to this relatively low fluctuation in sensitivity, the noise of the hydrophone signal contained spikes as large as 4 MPa (Fig. 1a), which had the potential to contribute to pulse-to-pulse variability in apparent peak positive pressure. However, the standard deviation for measured peak positive pressure (Fig. 2) was found to be only about 2–4%, which was similar to the standard deviation of measures collected previously from an electromagnetic lithotripter, using a PVDF membrane hydrophone.12 To reduce the noise of the FOPH-500 signal, the bandwidth of the oscilloscope was limited to 20 MHz.
Fig. 1.

Temporal profiles of lithotripter pulses recorded during a 400 shock wave series in non-stop regime. The first two consecutive lithotripter pulses of this series look very similar (Fig. 1a). Peak positive pressure during first 20 shock waves varied only 4% (Fig. 1b). However, during 400 shock wave series (Fig. 1c) acoustic output of the lithotripter showed significant instability: Peak positive pressure grew from 40 to 50 MPa during the first 100 SW’s, stayed at ~50 MPa for about 200 SW’s, and then fell to ~30 MPa during the last 100 SW’s. Detection of such a drift in lithotripter output can only be accomplished by recording in non-stop regime. Shock waves were recorded at 70 shots/min at power level 3. The recorded time window for each individual shock wave was 40 μs. Inter-SW interval (~0.86 s) was not recorded.
Fig. 2.

Peak positive pressure for 1000 shock waves recorded at power level 3 and 70 SW’s/min. This is an example of consistent output of the lithotripter.
Measurements were conducted in an optically transparent acrylic tank that was filled with tap water. The water was degassed overnight with a pinhole degasser.13 After several hours of degassing, gas content of the water reached its dynamic equilibrium and remained virtually unchanged. Since the gas content of water in the tank can influence waveform parameters,14 the degasser was run continuously during all measurements. The oxygen content was measured using a WTW Oxi 330i oxygen meter (Weilheim, Germany) and stabilized at about 2.7 mg/l, or 30% of saturation.
The water tank had a latex membrane, which was coupled to the water cushion of the therapy head using LithoClear gel (Sonotech Inc., Bellingham, WA).
All measurements were conducted at the geometric focus of the lithotripter. First a stylus was positioned at the focal point using X-ray alignment of the lithotripter, and the focus was marked with crossed diode laser beams. Position of the hydrophone was readjusted to the point of maximum amplitude of the acoustic field, found by scanning in two directions perpendicular to the acoustic axis of the lithotripter using a mechanical XYZ micropositioning system (Newport Corp., Irvine, CA). This refined position was marked by the lasers and was used for measurements. If the hydrophone tip was broken during measurements, a newly prepared tip could be easily positioned at the same place marked in the water by the crossed lasers. This enabled reliable repositioning of the fiber tip to 1 mm accuracy. The measured spatial distribution of peak positive pressure had a width of about 8 mm (pressure half maximum or 6 dB zone 11) with a flattened plateau (~ 5% variation) about 2 mm in diameter, such that the positioning accuracy of the hydrophone ensured placement of the tip within the maximum of the acoustic field.
The small diameter (100 μm) of the glass fiber makes this hydrophone virtually omnidirectional for most applications, particularly for detection of acoustic waves with frequencies less than 1 MHz. That is, different orientations of the fiber tip do not influence measurements of the smooth part of the lithotripter pulse and at worst would increase the apparent duration of the shock front. However, using a 20 MHz bandwidth for the oscilloscope already limited the time resolution of the shock front to ~ 40 ns rise time11. Orienting the fiber perpendicular to the axis of shock wave propagation spreads this further to ~ 65 ns, corresponding to the travel time of sound along the surface of the fiber tip. This artificial smoothing of the shock front leads to slightly decreased values of peak positive pressure. Comparison of signals measured with the fiber positioned along, and perpendicular to the acoustic axis, showed that broadening of the shock front could decrease the measurements of peak pressure by 7%. However, an error related to the different orientation of the fiber did not affect the present study since the variation of fiber orientation was within 10°–20°, that is, much better than 90°. With this accuracy, the glass fiber was positioned roughly perpendicular to the axis of shock wave propagation. This orientation slightly reduced the absolute value of peak pressure, but provided two advantages – the tip was less likely to break, and formation of bubbles along the glass fiber that can influence the signal was diminished.14
Waveforms were collected non-stop for hundreds of pulses using the Fast-Frame setup of a Tektronix (TDS 5034) oscilloscope. This acquisition mode allows one to capture consecutively many individually triggered time frames and store them as an uninterrupted series in the memory of a single channel. Depending on the memory capability of the oscilloscope, one can record non-stop more than 4000 lithotripter pulses with 500 samples per each individual shock wave. Data presented in this report were collected in sets of 100 or 300 non-stop lithotripter pulses, with 1–2 minutes between series to record the data on the internal hard drive of the oscilloscope and to check the sensitivity of the hydrophone. Each individual frame in 100 or 300 pulse series had 5000 samples with an 8 ns time step between sampling points. Thus, each lithotripter pulse was recorded in a 40 μs time frame. Post-processing of recorded waveforms was performed by programs written in LabVIEW (National Instruments, Austin, TX). Variability in peak positive pressure was expressed as the standard deviation divided by the mean value.
RESULTS
Output of the lithotripter was characterized at power levels PL-1, PL-3, and PL-6 by recording multiple sets of 200–400 shock waves (SW’s) delivered at a rate of 70SW’s/min. Mean values for peak positive pressure were 35±2 MPa, 44±2 MPa, and 51±2 MPa, respectively. Each pulse produced a signature waveform (Fig. 1a), having a near instantaneous jump to peak positive pressure, pulse width of ~2 μs, and negative pressure trough of ~4 μs followed by weak oscillations.12 Output typically appeared stable when 1–20 or so shock waves were collected, as displayed in Figure 1(a) and (b).
Instability in output occurred only occasionally, and was most evident when hundreds of shock waves were recorded in non-stop regime. Figure 1(c) shows instability over a series of 400 shock waves at PL-3. The first few pulses achieved just under 40 MPa. Pulse amplitude increased to ~50 MPa by about shot 100, stayed at this level for about another 200 shock waves, and then fell gradually to ~27 MPa at shot 400. Thus, in this series, amplitude ranged from 27 to 54 MPa, a very large variation. Within this 400 shock wave series 65% of the pulses were greater than the 44 ±2 MPa range found when the lithotripter was functioning normally, while 23% were below normal operating values. This compares to the typical case where output was very stable, as seen in figure 2, where in a series of 1000 shots at PL-3, 99% of shock waves had amplitude within the 44 ±2 MPa range.
The intermittent instability, when observed, was dramatic. Figure 3 shows values of peak positive pressure for 2000 pulses collected in one session, with the first 1000 pulses at PL-6 and the second 1000 shots at PL-3. In this session there are numerous jumps or swings in output, some gradual and some abrupt. Amplitude at PL-6, normally 51±2 MPa, dropped to around 35 MPa at shot 790. At PL-3, the amplitude, normally 44±2 MPa, jumped near shot 1200 to exceed the output at PL-6, and then fell to below 30 MPa. These changes in pulse amplitude did not correspond to the breaks in collection of waveforms. Data were collected in 300 shock wave sets over the first 900 pulses at each power level. Thus, only one fluctuation in this 2000 shock wave series, at shot 1600, appeared to correlate with a resumption in collection of waveforms.
Fig. 3.
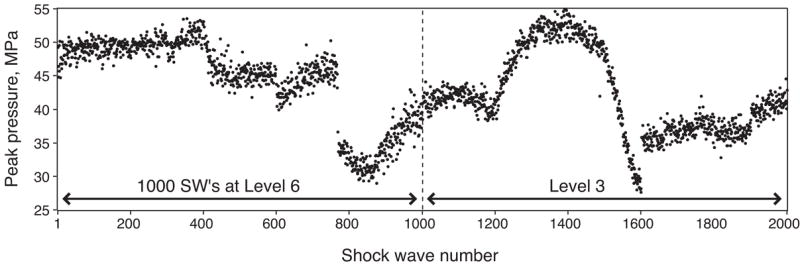
Inconsistency in acoustic output at two power levels in the same session. Vertical scale is peak positive pressure in MPa, horizontal scale is shock wave number. First 1000 SW’s were recorded at power level 6, and the next 1000 SW’s were at power level 3. At each power level, the data were collected in three sets of 300 shots, and one set of 100 non-stop pulses, with a 1-2 minutes interval between each series.
DISCUSSION
Electromagnetic lithotripters tend to have remarkably stable acoustic output, with a pulse-to-pulse variability of only about 2% (Fig. 2).12 It has been reported, however, that acoustic pressures can fall to as low as 50% of the original output over the lifetime of the shock generator—resulting in a significant increase in the number of shock waves delivered per treatment.15 Such a fall in output with extended use seems understandable, and is a change that is readily detectable.
In contrast, our observations show that instability in acoustic output of a lithotripter can occur and not be detected by routine methods of assessment. Moreover, the range of variation in output during this malfunction was quite large, such that a patient could receive significantly greater shock wave exposure than a physician would intend. The extent to which such variability might be present in this or other lithotripters is unknown, as the method by which this variability was detected—measurement of waveforms using a fiber optic probe hydrophone operated in non-stop regime—is new. However, the existence of such a possible defect, in which a lithotripter could operate in a way that would expose patients to unnecessary shock wave power, is a potentially significant safety issue that needs to be addressed. The first step should be testing to see how widespread sporadic malfunctions are in the machines presently in use. In the long run, sporadic malfunction of the type reported here should be detectable by monitoring the actual current drawn by the shock head on each pulse, and such monitoring could be built into newer lithotripters.
The sort of assessment we conducted to detect this malfunction requires a high quality storage oscilloscope, which are common and affordable, and an exceptionally durable hydrophone. All hydrophones, even the fiber optic probe hydrophone, are susceptible to cavitation damage. The advantage of the fiber optic probe hydrophone is that the fiber optic tip is renewable. When it breaks, one strips off a length of cladding from the cable to give a fresh tip. The lifetime of the fiber tip is dependent on cavitation, which in turn is dependent on the amplitude of the pulses, and the quality of the water in the test tank. Under ideal conditions the fiber tip can last for thousands of shock waves. For example, the measurements shown in figure 3 representing 1000 shock waves at PL-6 and 1000 shock waves at PL-3 were collected with the same fiber tip. We have also collected as many as 9,000 pulses without a break, where the pulses were lower amplitude (P+ ~30 MPa) in very well degassed water (~18% of gas saturation). One drawback of the fiber-optic hydrophone is its relatively small signal-to-noise ratio, caused mainly by jittering in the intensity of the laser. In addition, random movement of minute particles in the surrounding water can reflect light near the fiber tip. Such sources of interference prove to be negligible, however, as the pressure amplitude of lithotripter pulses is much greater than the noise in the hydrophone signal. Other hydrophones, such as PVDF membrane hydrophones, can show excellent sensitivity, but are much more easily damaged than the FOPH. Indeed, we chose the FOPH for these studies because of its exceptional durability. Thus, with the FOPH and the data acquisition system for collection of shock waves in non-stop regime, it is quite feasible to perform routine testing of lithotripter output, should this be found to be appropriate for patient safety.
In summary, we describe the occurrence of significant instability in the acoustic output of an electromagnetic lithotripter. The detection of fluxes in pulse amplitude was made possible by use of a data acquisition system in which hundreds of shock waves could be collected in non-stop regime. This occurrence of unpredictable energy output by an electromagnetic shock generator, a technology widely appreciated for its consistency and stability, suggests that the routine testing protocols for lithotripters may be inadequate, and that there may be a need for greater attention to monitoring the performance of lithotripters.
Acknowledgments
This research was supported by a grant from the National Institutes of Health, DK43881. The DoLi-50 lithotripter was donated by American Kidney Stone Management (Columbus, OH).
References
- 1.Lingeman J, Delius M, Evan A, Gupta M, Sarica K, Strohmaier W, et al. Bioeffects and physical mechanisms of SW effects in SWL. In: Segura J, Conort P, Khoury S, Pak C, Preminger GM, Tolley D, editors. Stone Disease: First International Consultation on Stone Disease. Heath Publications; Paris: 2003. pp. 251–286. [Google Scholar]
- 2.Evan AP, McAteer JA. Q-Effects of shock wave lithotripsy. In: Coe FL, Favus MJ, Pak CYC, Parks JH, Preminger GM, editors. Kidney Stones: Medical and Surgical Management. Lippincott-Raven; Philadelphia: 1996. pp. 549–570. [Google Scholar]
- 3.Connors BA, Evan AP, Willis LR, Blomgren PM, Lingeman JE, Fineberg NS. The effect of discharge voltage on renal injury and impairment caused by lithotripsy in the pig. J Am Soc Nephrol. 2000;11:310. doi: 10.1681/ASN.V112310. [DOI] [PubMed] [Google Scholar]
- 4.Lifshitz DA, Lingeman JE, Zafar FS, Hollensbe DW, Nyhuis AW, Evan AP. Alterations in predicted growth rates of pediatric kidneys treated with extracorporeal shockwave lithotripsy. Jour Endourol. 1998;12:469. doi: 10.1089/end.1998.12.469. [DOI] [PubMed] [Google Scholar]
- 5.Willis LR, Evan AP, Connors BA, Blomgren P, Fineberg NS, Lingeman JE. Relationship between kidney size, renal injury, and renal impairment induced by shock wave lithotripsy. J Am Soc Nephrol. 1999;10:1753. doi: 10.1681/ASN.V1081753. [DOI] [PubMed] [Google Scholar]
- 6.Janetschek G, Frauscher F, Knapp R, Höfle G, Peschel R, Bartsch G. New onset hypertension after extracorporeal shock wave lithotripsy: age related incidence and prediction by intrarenal resistive index. J Urol. 1997;58:346. doi: 10.1016/s0022-5347(01)64475-6. [DOI] [PubMed] [Google Scholar]
- 7.Evan AP, Willis LR, Lingeman JE, McAteer JA. Renal trauma and the risk of long-term complications in shock wave lithotripsy. Nephron. 1998;78:1. doi: 10.1159/000044874. [DOI] [PubMed] [Google Scholar]
- 8.Krambeck AE, Rohlinger AL, Lohse CM, Gettman MT, Segura JW. Long-term effects of shock wave lithotripsy for nephrolithiasis: a nineteen year study. J Endourol. 2005;19(Suppl 1):A33. [Google Scholar]
- 9.Parks JH, Worcester EM, Coe FL, Evan AP, Lingeman JE. Clinical implications of abundant calcium phosphate in routinely analyzed kidney stones. Kidney Int. 2004;66:777. doi: 10.1111/j.1523-1755.2004.00803.x. [DOI] [PubMed] [Google Scholar]
- 10.Stardenraus J, Eisenmenger W. Fiber-optic probe hydrophone for ultrasonic and shock-wave measurements in water. Ultrasonics. 1993;31:267. [Google Scholar]
- 11.IEC-Technical Committee-87. IEC Standard 61846 Ultrasonics - Pressure pulse lithotripters -Characteristics of fields. International Electrotechnical Commission; Geneva, Switzerland: 1998. [Google Scholar]
- 12.Coleman AJ, Saunders JE. A survey of the acoustic output of commercial extracorporeal shock wave lithotripters. Ultrasound Med Biol. 1989;15:213. doi: 10.1016/0301-5629(89)90066-5. [DOI] [PubMed] [Google Scholar]
- 13.Kaiser AR, Cain CA, Hwang EY, Fowlkes JB, Jeffers RJ. A cost effective degassing system for use in ultrasonic measurements: The multiple pinhole degassing (mpd) system. J Acoust Soc Am. 1996;99:3857. [Google Scholar]
- 14.Pishchalnikov YA, Sapozhnikov OA, Bailey MR, Pishchalnikova IV, Williams JC, Jr, McAteer JA. Cavitation selectively reduces the negative-pressure phase of lithotripter shock waves. Acoust Res Lett On-line. 2005;6:280. doi: 10.1121/1.2127115. [DOI] [PMC free article] [PubMed] [Google Scholar]
- 15.Mishriki SF. Quality assurance: monitoring lithotriptor output and its clinical implications. J Urol. 1994;152:57. doi: 10.1016/s0022-5347(17)32815-x. [DOI] [PubMed] [Google Scholar]