

Abstract
Escherichia coli RcnR and Mycobacterium tuberculosis CsoR are the founding members of a recently identified, large family of bacterial metal-responsive DNA-binding proteins. RcnR controls the expression of the metal efflux protein RcnA only in response to Ni(II) and Co(II) ions. Here, the interaction of Ni(II) and Co(II) with wild-type and mutant RcnR proteins is examined to understand how these metals function as allsoteric effectors. Both metals bind to RcnR with nanomolar affinity and stabilize the protein to denaturation. X-ray absorption and electron paramagnetic resonance spectroscopies reveal six-coordinate high-spin sites for each metal that contains a thiolate ligand. Experimental data support a tripartite N-terminal coordination motif (NH2-Xaa-NH-His) that is common for both metals. However, the Ni(II)- and Co(II)-RcnR complexes are shown to differ in the remaining coordination environment. Each metal coordinates a conserved Cys ligand but with distinct M-S distances. Co(II)-thiolate coordination has not been previously observed in Ni(II)/Co(II) responsive metalloregulators. The ability of RcnR to recruit ligands from the N-terminal region of the protein distinguishes it from CsoR, which uses a lower coordination geometry to bind Cu(I). These studies facilitate comparisons between Ni(II)-RcnR and NikR, the other Ni(II)-responsive transcriptional regulator in E. coli, to provide a better understanding of how different nickel levels are sensed in E. coli. The identification of the Ni(II) and Co(II) binding sites in RcnR, in combination with bioinformatics analysis of all RcnR/CsoR family members, identify a four amino acid fingerprint that likely defines ligand-binding specificity, leading to an emerging picture of the similarities and differences between different classes of RcnR/CsoR proteins.
Keywords: XAS, XANES, metalloregulation, NmtR, KmtR, ATCUN motif
Introduction
Metal-responsive DNA-binding proteins that control transporter and enzyme gene expression in bacteria are well known.1 These metalloregulators have been divided into several structural families, named after their founding members: MerR, ArsR/SmtB, DtxR, Fur, NikR, and CopY.1 Each family, with the exception of NikR, contains sub-families that respond to distinct metals, or other small molecules. For example, the MerR family includes the Cu–responsive CueR,2 the Zn–responsive ZntR3, and the Pb-responsive PbrR.4 Less well understood are the structural bases for metal-sensing and metal-specific function by these proteins in the context of the complex intracellular milieu. Specificity is important to avoid promiscuous activation by non-cognate metals. An additional structural challenge is present when two regulatory proteins that control opposing functional pathways must respond to the same metal ion, but at different concentrations, such as the zinc-responsive regulatory proteins Zur and ZntR5 that control influx and efflux pathways, respectively. Structural characterization of the metal-binding sites provides insights into their thermodynamic and kinetic properties, which provide a basis for understanding their function in the cell.
The present understanding of metalloregulator structure-function relationships indicates that regulation of DNA-binding activity by the cognate metal is generally allosteric, so that the proper conformational change required for function is linked to metal-binding specificity. The metal ion selectivity is at least partly achieved by the coordination number/geometry of the metal-protein complex,6 and by ligand selection, as not all metals that bind in vitro elicit a biological response. These features have been demonstrated for the Ni(II)-responsive transcriptional repressor, NikR, from E. coli, which has been shown to bind to a number of metals with high affinity7 but responds in vivo only to the presence of Ni(II) ions.8
Recently, we identified a nickel- and cobalt-responsive metalloregulator, E. coli RcnR,9 that represses transcription of rcnA, which encodes a nickel and cobalt efflux protein.10 RcnR exhibits only minimal sequence identity with the previously described families of transcriptional regulators leading to the proposal of a new metalloregulator family.9 RcnR homologs are found throughout the eubacterial kingdom, emphasizing their widespread role in regulating the cell physiology of microbes from diverse growth niches. Despite the lack of a known DNA binding motif, RcnR represses transcription by directly binding to the rcnA promoter. This interaction is negatively affected by Ni(II) or Co(II) binding, a pattern functionally similar to that of the structurally distinct SmtB/ArsR family of transcription factors (reviewed in 11). The subsequent functional and structural characterization of M. tuberculosis CsoR, a Cu(I)-responsive homolog of RcnR, confirmed the discovery of a new structural class of metalloregulators (RcnR/CsoR family) characterized by an all α-helical structure anchored by a four-helix bundle.12 The discovery of this new family has been recently reviewed.1
The nickel and cobalt requirements of E. coli are distinct. The nickel physiology of E. coli is dominated by the anaerobic expression of Ni-Fe hydrogenases,13, 14 which obtain their nickel via the NikABCDE nickel permease.15, 16 The cobalt physiology of this organism is less well understood. E. coli cannot synthesize adenosylcobalamin (vitamin B12) de novo but has a specific transport pathway for this essential cofactor.17–20 Cobalt ions are thought to enter the cell only through transporters with low specificity such as the magnesium transporter, CorA.20–22 These observations suggest that Co(II) ions are regarded by the cell as toxic, one manifestation of which is its adverse effects on Fe–S clusters in enzymes such as aconitase and ferrichrome reductase.23
Physiologically, the rcnR-rcnA module is functionally linked to the other nickel-dependent activities of the cell.9 At low extracellular nickel levels, low or transient expression of RcnA is required to prevent premature nikABCDE repression by NikR.9 This effect likely results from a competition between nickel efflux by RcnA and nickel-binding and transcriptional repression by NikR. Under steady state growth conditions, the NikR repressor responds to lower ambient Ni(II) concentrations than RcnR, as nikABCDE expression is completely repressed at nickel levels that exhibit minimal rcnA expression.9 As Ni(II) levels increase, RcnR-repression of rcnA transcription is diminished allowing full induction of RcnA expression to prevent excess metal accumulation in the cell. The complementary responses for the nickel-dependent regulators in E. coli raise the question of how these two proteins are structurally tuned to respond to different nickel levels in the cell.
To better understand ligand recognition and allosteric regulation in this new family of metalloregulators, we have investigated binding of the cognate metals, Ni(II) and Co(II), to the RcnR protein. Ni(II) and Co(II) are similar in size and ligand preference, but whether they bind to RcnR at the same site and with the same coordination environment is unknown. Ni(II) and Co(II) do not commonly adopt the trigonal planar geometry (two cysteines and one histidine) observed in the Cu(I)-CsoR structure,12 suggesting that the RcnR protein must supply additional metal-binding ligands. X-ray absorption (XAS) and UV-visible spectroscopies reveal a six-coordinate metal binding site for Ni(II) or Co(II) containing 1 S- and 5 N/O-donor atoms. Studies of RcnR mutants show that Ni(II) and Co(II) use overlapping but distinct binding sites to inhibit RcnR DNA-binding.
Experimental Methods
Molecular Biology
All chemicals were purchased from Fisher Scientific (Pittsburgh, PA) except where indicated. Oligonucleotides (Operon Biotechnologies; Huntsville, AL), plasmids and bacterial strains used in this study are listed in Supporting Information (Table S8). Several rcnR-PrcnA-lacZ mutations and pRcnR mutations were constructed using either of two methods. 1) The QuikChange® protocol (Stratagene, La Jolla, CA) was used with slight modification. For each 50 μL reaction, 200 ng of plasmid DNA and 150 ng of each primer were used, with 2.5 units Pfu Turbo DNA polymerase (Stratagene, La Jolla, CA). DNA was then subjected to digestion with 20 units Dpn I (New England Biolabs, Beverly, MA) for 1.5 h at 37 °C. After heat inactivation for 10 min, 5 μL of the reaction was transformed into E. coli JM109 cells following the TSS protocol.24 2) Additional rcnR-PrcnA-lacZ mutations and pRcnR mutations were constructed by overlap extension PCR25 and ligation into pPC163 or pET-22b as described previously.9 3) Mutations near the 5′ and 3′ regions of rcnR were constructed by simple PCR amplification of the rcnR gene using a mutant primer (Supporting Information Table S7), followed by subcloning into the appropriate plasmid. All mutant constructs were sequenced (Seqwright; Houston, TX) to verify that only the desired mutation was present.
RcnR Overexpression and Purification
E. coli DL41 (DE3)26 cells harboring plasmid encoding wild-type or mutant RcnR proteins were grown in LB media containing ampicillin (200 μg/mL; 538 μM) at 37 °C to OD600 ~1.0, prior to the addition of IPTG (120 mg/L; 0.5 mM) to induce RcnR expression. The cells were harvested after 3 h by centrifugation (4600 × g, 25 min), resuspended in residual media (~ 5 mL/L of culture) and frozen at −80 °C. Thawed cell pellets were lysed by sonication, at 4°C in the presence of 5 mM Tris(2-carboxyethyl)-phosphine hydrochloride (TCEP) (Pierce) and 1.5 mM phenylmethylsulfonylfluoride (Sigma), a serine protease inhibitor. Subsequent steps were all performed at 20°C. After centrifugation, the lysate supernatant was applied to an SP Sepharose column (18 mL) equilibrated with 20 mM Hepes (pH 7.0), 1.0 mM TCEP, 5.0 mM EDTA, 10% glycerol (Buffer A) with 50 mM NaCl. The column was then washed with 40 mL Buffer A with 50 mM NaCl followed by a linear gradient of 0.05 – 1 M NaCl in Buffer A (110 mL total volume; flow rate 2 mL/min; collected in 2 mL fractions). RcnR eluted at ~400 mM NaCl, and these fractions were pooled and concentrated at ~4000 × g to 1 mL using 2 mL, 5KDa MW cutoff Vivaspin concentrators (Vivascience, Hannover, Germany) and applied to a HiLoad 26/60 Superdex 200 column equilibrated with Buffer A containing 300 mM NaCl. RcnR eluted as a single peak, at a volume most consistent with a tetramer. Fractions containing RcnR were pooled and diluted to 25 mL, and applied to an S6 ion exchange column (2 cm × 6 cm) (Biorad, Hercules, CA) running on a Biorad Biologic FPLC. The column was then washed with 20 mL Buffer A with 50mM NaCl, and the protein was eluted using a linear gradient of 0.05 – 1M NaCl (48 mL total volume; 4 mL/min flow rate). RcnR eluted between 490 mM and 620 mM NaCl. Purified RcnR was stored at 4 °C in 20 mM Hepes (pH 7.0), 500 mM, NaCl, 1 mM TCEP, 1 mM EDTA, 5% glycerol for up to 4 weeks, thereafter DNA-binding specificity and affinity began to decrease. The identity of the purified protein was confirmed by N-terminal sequencing using Edman degradation (Midwest Analytical, St. Louis, MO). Prior to use in different experiments, RcnR samples were desalted two times into Buffer M [10 mM Hepes (pH 7.0), 150 mM NaCl, 5% glycerol] using Microbiospin 6 columns (Biorad) to remove EDTA and TCEP present in the storage buffer. Modifications to this approach are noted where relevant.
RcnR Characterization
An experimentally determined extinction coefficient of ε276 = 2530 M−1cm−1 was determined by measuring the absorbance of an aliquot of purified denatured RcnR and determining its concentration by amino acid analysis (Texas A&M Protein Chemistry Laboratory, College Station, TX).
The free sulfhydryl content of native RcnR was quantified by a standard thiol titration method27 using 5, 5′-dithio-bis(2-nitrobenzoic acid) (DTNB). Samples contained RcnR (5 –10 μM) in 100 mM sodium phosphate (pH 7.3). Quantification of the sulfhydryl concentration was obtained using a TNB extinction coefficient of 14150 M−1cm−1 at 412 nm using a Shimadzu UV-2401PC spectrophotometer.28
Metal Content Assays
For PAR assays, 3–4 monomer equivalents of NiCl2 or CoCl2 were added to RcnR protein previously desalted into Buffer M, and the samples were incubated at 20°C for 2 hours. Weakly bound and excess free metal ions were removed by a second passage over a Microbiospin 6 column equilibrated with Buffer M. PAR assay. 4-(2-pyridylazo) resorcinol (PAR) experiments followed an established protocol29, 30 with minor modifications. Standard curves for Ni(II) and Co(II) in complex with PAR were generated from samples containing 1–9 μM metal, 20 μl of 1 mg/mL PAR in 120 μl total volume [50 mM Hepes (pH 7.3), 6 M guanidine hydrochloride]. The absorbance was measured for each sample (Ni, 505 nm; Co, 540 nm) after equilibration for 1 h at 20 °C. RcnR samples were prepared similarly, using two samples at two different protein concentrations between 1 and 9 μM. The metal content reported was the average of all four samples. Atomic absorption spectroscopy (AAS) Samples for AAS were prepared in a similar manner to those above except protein was desalted into Buffer M lacking glycerol to remove excess metal ions. Aliquots (100 μL) were then incubated overnight (20 °C) in 2% nitric acid, then diluted 10-fold with H2O to a final volume of 1 mL. Samples were analyzed on a Perkin Elmer AAnalyst 600 graphite furnace atomic absorption spectrophotometer equipped with a nickel hollow cathode lamp (Department of Biology, Washington University). Nickel content was quantified by comparison to a standard curve of 2–100 μg/L nickel. Each sample was quantified three times and averaged.
UV-visible spectroscopy
Metal-bound RcnR UV-visible spectra were measured on a Shimadzu UV-2401PC spectrophotometer. Metals were added from a stock solution to individual protein samples (previously desalted) for each nickel or cobalt concentration. Samples (100 μL volume) were allowed to equilibrate for 15 h at 20 °C under aerobic conditions after metal addition before spectral collection (1 cm pathlength; 0.2 nm stepsize).
For iodoacetamide (IAM) (Sigma, St. Louis, MO) treated samples, 5 mM IAM was added to RcnR in storage buffer (2 h at 20 °C). Control samples with water added instead of IAM were prepared in parallel. The samples were then desalted twice into Buffer M before metal addition.
Mag-Fura 2, Fura 2 metal Titrations
Fluorescence measurements were all taken on a Cary Eclipse Fluorescence Spectrophotometer in a 150 μL, 1 cm pathlength Hellma quartz cuvette. A range of concentrations of NiCl2 or CoCl2, were incubated with 0.5 μM mag-fura 2 (Molecular Probes; Carlsbad, CA) or 0.3 μM fura-2, respectively, for 3 h in the presence or absence of the indicated concentrations of RcnR. Fluorescence measurements were made using λex = 380 nm, λem = 505 nm for mag-fura 2 and λex = 360 nm, λem = 500 nm for fura 2, with both excitation and emission slit widths set to 10 nm. Each reported value was the average of three readings. Data were fit to a four independent binding sites model using SCIENTIST version 2.01 (Micromath; St. Louis, MO).
Analytical Ultracentrifugation
Sedimentation equilibrium data were obtained on a Beckman XL-A Ultracentrifuge using six-cell sample holders (1.2 cm pathlength). Samples of 110 μL RcnR (5 and 25 μM in Buffer M + 200 μM EDTA) were centrifuged at 25000 and 35000 rpm (20 °C) with a 120 μL buffer blank. A230 or A276 measurements were obtained after 10 h and every 2 h thereafter until three consecutive scans overlapped (20 h total) to ensure equilibrium had been achieved. The partial specific volume for RcnR (0.7504 mL/g at 20°C) was determined from the amino acid content using SEDNTERP.31 A buffer density of 1.019 g/mL was also calculated from SEDNTERP. The SEDPHAT software package was used to globally analyze data obtained at multiple rotor speeds and protein concentrations.32
Circular Dichroism (CD)
CD experiments were carried out on a JASCO 710 spectropolarimeter using 1 cm (urea melts) or 1 mm (wavelength scans) pathlength cylindrical quartz cuvettes. Wavelength scans (20 °C; speed 20 nm/min; 1 nm step) were performed on a samples containing 15 μM RcnR in 10 mM Hepes (pH 7.0), 100 mM NaCl, 5% glycerol. 30 μM Ni(II) or Co(II) was added where indicated. Samples were equilibrated for 3 h (20 °C) before scans. Each spectrum was the average of three accumulations. The raw, blank subtracted signal (millidegrees) was converted to mean residue ellipticity (MRE) and fraction helix, as previously described.33, 34
Urea denaturation samples were performed as described previously.35 A freshly prepared stock of 10 M urea in Buffer M was used to make individual samples (900 μL) containing different urea concentrations, which were allowed to equilibrate for 12–15 h at 20 °C. Ellipticity data for each urea concentration was collected for 60 s at 230 nm in 1 s intervals, and averaged. Because the pathway for unfolding could not be unambiguously determined with respect to oligomeric state, urea concentrations that cause half maximal unfolding are reported based on fits to a model of folded monomer to unfolded monomer.36
X-ray Absorption Spectroscopy
Samples of RcnR were desalted and metallated as described above. The samples were then concentrated to 1.5 – 3.2 mM in 20mM Hepes (pH = 7.0), containing either 300 mM NaCl or NaBr, prior to data collection. X-ray absorption spectroscopy (XAS) data for all RcnR samples were collected at beamline 9-3 at the Stanford Synchrotron Radiation Laboratory (SSRL) under dedicated ring conditions. Each sample was syringed into a polycarbonate cuvette that was wrapped in kapton tape and frozen in liquid nitrogen. Data was collected at 10 K using a liquid helium cryostat (Oxford Instruments). The ring conditions were 3 GeV and the current was 80–100 mA for each sample. The beamline optics consist of a Si(220) double crystal monochromator (φ = 90°), a flat rhodium coated mirror upstream of the monochromator for harmonic rejection and vertical columniation, and a toroidal focusing mirror after the monochromator. X-ray fluorescence was detected with a 30 element Ge detector (Canberra). The energy of each Kα- edge was calibrated to the first inflection point of the corresponding foil: Co, 7709.5 and Ni, 8331.6 eV. X-ray absorption near edge spectroscopy (XANES) was collected from ± 200 eV relative to the edge. Analysis of the XANES region was carried out by fitting a cubic function to the baseline in the pre-edge region of the spectrum and using a 75% Gaussian and 25% Lorenzian function to fit the rise in fluorescence occurring at the edge. Gaussian functions were added to fit each pre-edge transition, and the areas of the inserted Gaussians were taken to be the peak area.8 Extended x-ray absorption fine structure (EXAFS) was collected to 13.5 k above the absorption edge (E0) for WT Co-RcnR and 16.3 k above the absorption edge energy (E0) for both C35A RcnR complexes and WT each Ni-RcnR. XAS data reduction was carried out using EXAFS123 with graphics produced in Igor Pro (WaveMetrics ver. 5.0) as previously described.8 For EXAFS analysis, four to seven scans were averaged to generate the summed EXAFS spectrum. Each summed spectrum was normalized and background corrected using a three-section cubic spline for the pre-edge and post-edge regions. The data were converted to k-space using the relationship [2me (E − E0)/h2 ]1/2 (where me is the mass of the electron and Eo is the threshold energy above the absorption edge; 7723 eV for Co and 8340 eV for Ni). Least squares fitting of EXAFS arising from the first coordination sphere was performed using Fourier-filtered spectra with transform limits of 2.0 – 12.5 Å−1 for WT RcnR samples and 2.0 – 14.0 Å−1 for C35A RcnR samples, as determined by the signal-to-noise in the data and to allow appropriate comparisons. A back-transform window of 1.0 – 2.3 Å (uncorrected for phase shifts) was used to model scattering atoms in the first coordination sphere. Fits were calculated for coordination numbers four, five and six holding the number of scattering atoms in a shell to integer values, and using all combinations of S- and N- donors (see supporting information). Best fits were judged by minimizing the goodness of fit parameter (GOF) and deviation of σ2 values from typical values. The back-transform window was expanded to 1.0 –4.0 Å (uncorrected for phase shifts) to accommodate scattering from imidazole rings, which were fit using multiple-scattering parameters as previously described.8 Histidine ligand “counting” was achieved by adding integer numbers of imidazole rings to the fit and observing the effect on GOF and σ2, and provides an estimate of the number of imidazole ligands in model compounds with an error of ± 25% (about the same as the error in N, the number of first shell atoms). The final fits included in the text were selected from the best fits of Fourier-filtered data and were further refined using unfiltered data. For all fits, r (M-scatterer distance), σ2 (disorder parameter) and E0 (phase shift) were allowed to refine, however they were constrained so that only one value E0 was used and only one value of σ2 per type of scattering atom was employed.
EPR Spectroscopy
EPR spectra were obtained with a Bruker Elexsys 500 spectrometer equipped with an ER 4102 single cavity operating at X-band (9.46 Ghz). Measurements were performed at 12 K using an Oxford Instruments EPR-9000 liquid helium continuous flow cryostat. EPR spectra were simulated using the matrix diagonalization program Xsophe (Bruker Biospin). The spin Hamiltonian employed was: H = βg•H•S + S•D•S.
β-galactosidase Reporter Experiments
β-galactosidase reporter experiments were set up as described previously with the following modification.9 Starter cultures of E. coli strain PC563 (ΔrcnR) cells containing wild-type or mutant rcnR genes on the rcnR-PrcnA-lacZ plasmid (pJI114) were grown aerobically in Luria-Bertani broth (LB) with chloramphenicol (34 mg/L; 0.1 mM). These cultures were used to inoculate triplicate cultures of 1.87 mL LB with chloramphenicol (34 mg/L; 0.1 mM) in capped microfuge tubes (starting OD600 = 0.000001). Cultures were then grown for 12–15 hours at 37 °C, and assayed as previously described.9
For metal induction experiments cells were treated in a similar manner except pJI114 was in the ΔlacZ E. coli strain RZ4500.37 Cells were grown anaerobically as above at the maximal concentration for each individual divalent metal that resulted in <10% inhibition of growth (measured by final OD600), which were as follows: 30 μM MnCl2, 1.5 mM FeSO4, 150 μM CoCl2, 500 μM NiCl2, 100 μM CuCl2, 300 μM ZnCl2 and 10 μM CdSO4.
Results
RcnR Metal Specificity in vivo
Previous studies demonstrated that Ni(II) and Co(II) induced transcription from a PrcnA-lacZ fusion construct.9 To test the effect of other divalent transition metal ions on PrcnA-lacZ expression, cells were grown anaerobically in LB media containing the maximal metal ion concentrations that inhibited growth by <10%. As shown in Figure 1, Mn(II), Fe(II), Cd(II), Cu(II) and Zn(II) all had no detectable effect on lacZ expression. Divalent metal concentrations that caused up to 50% growth inhibition failed to activate expression from PrcnA more than two-fold (data not shown). These results establish Ni(II) and Co(II) as the only two physiologically relevant metal ions for rcnA induction under these growth conditions, and led us to study their interactions with the RcnR protein in more detail.
Figure 1.
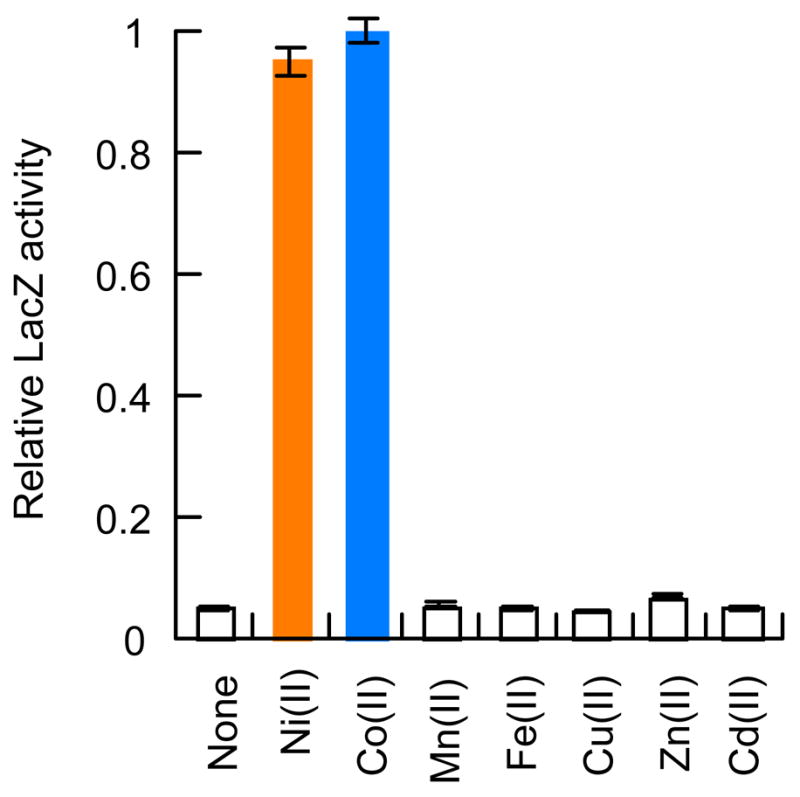
Divalent metal induction of PrcnA expression. RZ4500 cells were grown with pJI114 in the presence of the indicated divalent metal ions as described in the Experimental Methods. LacZ activity was assayed as previously described.9 Induction from PrcnA only occurs in the presence of Ni or Co. Relative LacZ activity of 1 corresponds to 136 Miller Units. Error bars show the standard deviation of the LacZ activity of 3 separate samples.
RcnR Purification and Characterization
Native E. coli RcnR was purified to homogeneity (~5 mg/L of culture) by a combination of anion exchange and gel filtration chromatographies (see Experimental Methods). The N-terminal amino acid sequence of the protein (SHTIR; see also Supplementary Information Figure S10) revealed the expected cleavage of the N-terminal methionine38 resulting in an 89-residue native protein (the numbering used here is based on the rcnR gene sequence). Using the PAR assay for transition metal ion detection,30 purified RcnR contained <0.04 metal equivalents per monomer. A thiol titration with DTNB indicated the free sulfhydryl content of natively folded RcnR was 0.9 ± 0.1 (expect 1.0).
The CD spectrum of purified RcnR (Figure 2A) showed minima at 222 nm and 208 nm consistent with a folded, α-helical protein. Conversion of the mean residue ellipticity to fraction helix gives 61% helix, in reasonable agreement with calculations of 68%–78% helix from secondary structure prediction algorithms.33 The protein secondary structure showed little perturbation in the presence of NiCl2 or CoCl2 (Figure 2A), indicating minimal net change in secondary structure due to metal binding.
Figure 2.
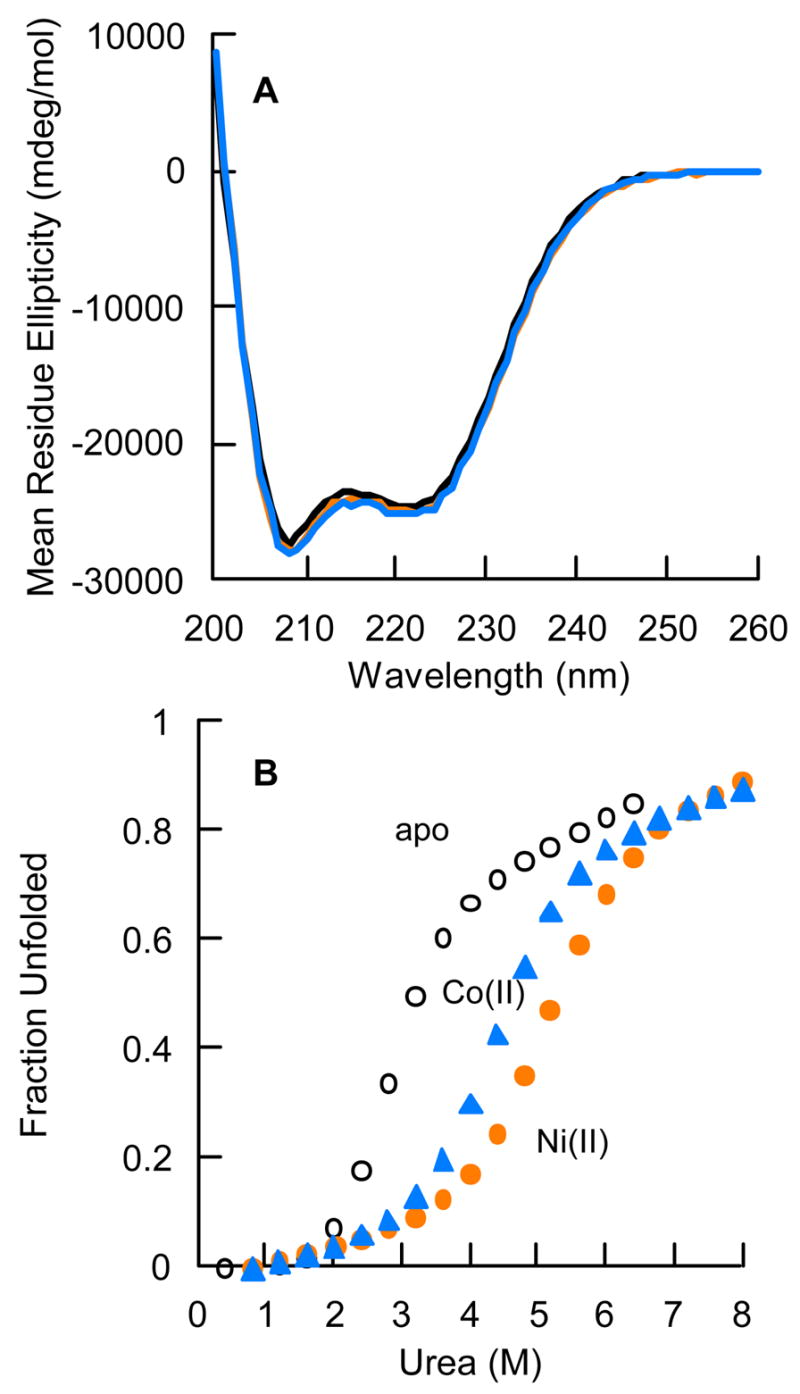
Secondary structure and stability of E. coli RcnR measured by CD spectroscopy. (A) Far UV CD spectra of 15 μM RcnR without metal (black line) or with 30 μM NiCl2 (orange line) or CoCl2 (blue line). Protein samples were in 10 mM Hepes (pH 7.0), 100 mM NaCl, 5% glycerol. Data were converted to mean residue ellipticity as described.33, 34 (B) Urea denaturation (monitored at 230 nm) of apo-, Ni(II)-, or Co(II)-substituted RcnR (2.5 μM). NiCl2 or CoCl2 were added to 5 μM final concentration. Protein samples were in Buffer M.
The RcnR protein unfolded cooperatively as a function of increasing urea concentration (Figure 2B). RcnR showed concentration dependent stability, with transition midpoints of 2.7 M urea and 3.2 M urea for 2μM and 12 μM protein, respectively, indicating that oligomer dissociation and RcnR unfolding are coupled (Supporting Information Figure S1). Metal addition increased RcnR stability, shifting the midpoint of the denaturation curve from 2.7 M urea to 5.0 M urea for Ni, and 4.4 M urea for Co (Figure 2B).
Assembly State of RcnR
Sedimentation equilibrium experiments were performed to rigorously characterize the oligomeric state of the protein and determine whether metal binding caused any changes in RcnR assembly state. For the apo-protein, data sets were fit globally to a single species model, yielding a molecular mass of 39399 Da (Supporting Information Figure S2), consistent with an RcnR tetramer (expected mass 40010 Da). Residuals for this fit did not show systematic deviations and inclusion of a dimeric species in the model did not improve the quality of the fit because the best fit for the tetramer-dimer dissociation constant was > 2 orders of magnitude less than the protein concentrations used. Thus, negligible amounts of dimer (<10%) were present under these solution conditions. Likewise, addition of an octameric species did not improve data fitting. Experiments were also carried out in the presence of 200 μM NiCl2 or 200 μM CoCl2 instead of EDTA and under these conditions RcnR remained tetrameric (see Supporting Information Figure S2). Similarly, the addition of 1 mM DTT (see Supporting Information Figure S2), higher pH (7.5), or increased salt (300 mM NaCl) did not affect the species distribution.
Thus, under these experimental conditions RcnR forms a stable tetramer and this tetrameric state is not perturbed by Ni(II) or Co(II) binding, suggesting that the tetrameric form is the active biological species. However, dimer or monomer species may occur under solution conditions different than those tested here.
Electronic Absorption Spectroscopy
The Ni(II)- and Co(II)-RcnR complexes were analyzed by UV-visible spectroscopy (Figure 3A) and exhibited features consistent with six-coordinate metal centers featuring thiolate ligation. The difference spectra (holo-apo) for 1:1 M(II)-RcnR (monomer equivalents) complexes exhibit intense absorptions for each metal [M = Co(II), ε314 = 2664 M−1cm−1 and ε238 = 4675 M−1cm−1; M = Ni(II), ε280 = 1778 M−1cm−1) and ε235 = 3937 M−1cm−1]. The feature at 310 nm in the Co(II)-RcnR spectrum is not present if RcnR is preincubated with the thiol modifying agent iodoacetamide (5 mM), while the peak at 235 nm is unchanged, indicating that the longer wavelength feature is due to thiolate to Co(II) ligand-to-metal charge-transfer (LMCT) (Supporting Information Figure S3). Similarly, for Ni(II)-RcnR the 280 nm feature is nearly absent when RcnR is preincubated with iodoacetamide, while the 231 nm peak maintains a constant intensity, indicating that the peak at 280 nm is due to CysS → Ni(II) LMCT (Supporting Information Figure S3). These assignments are also supported by EXAFS analyses of Co(II)-RcnR and Ni(II)-RcnR and mutagenesis data that confirm S-coordination (vide infra), as well as the high molar extinction coefficients observed for the UV-vis absorptions, and by similar absorptions in Co-substituted proteins39, 40 and the few examples of six-coordinate Ni(II) thiolate complexes that are known.41, 42
Figure 3.
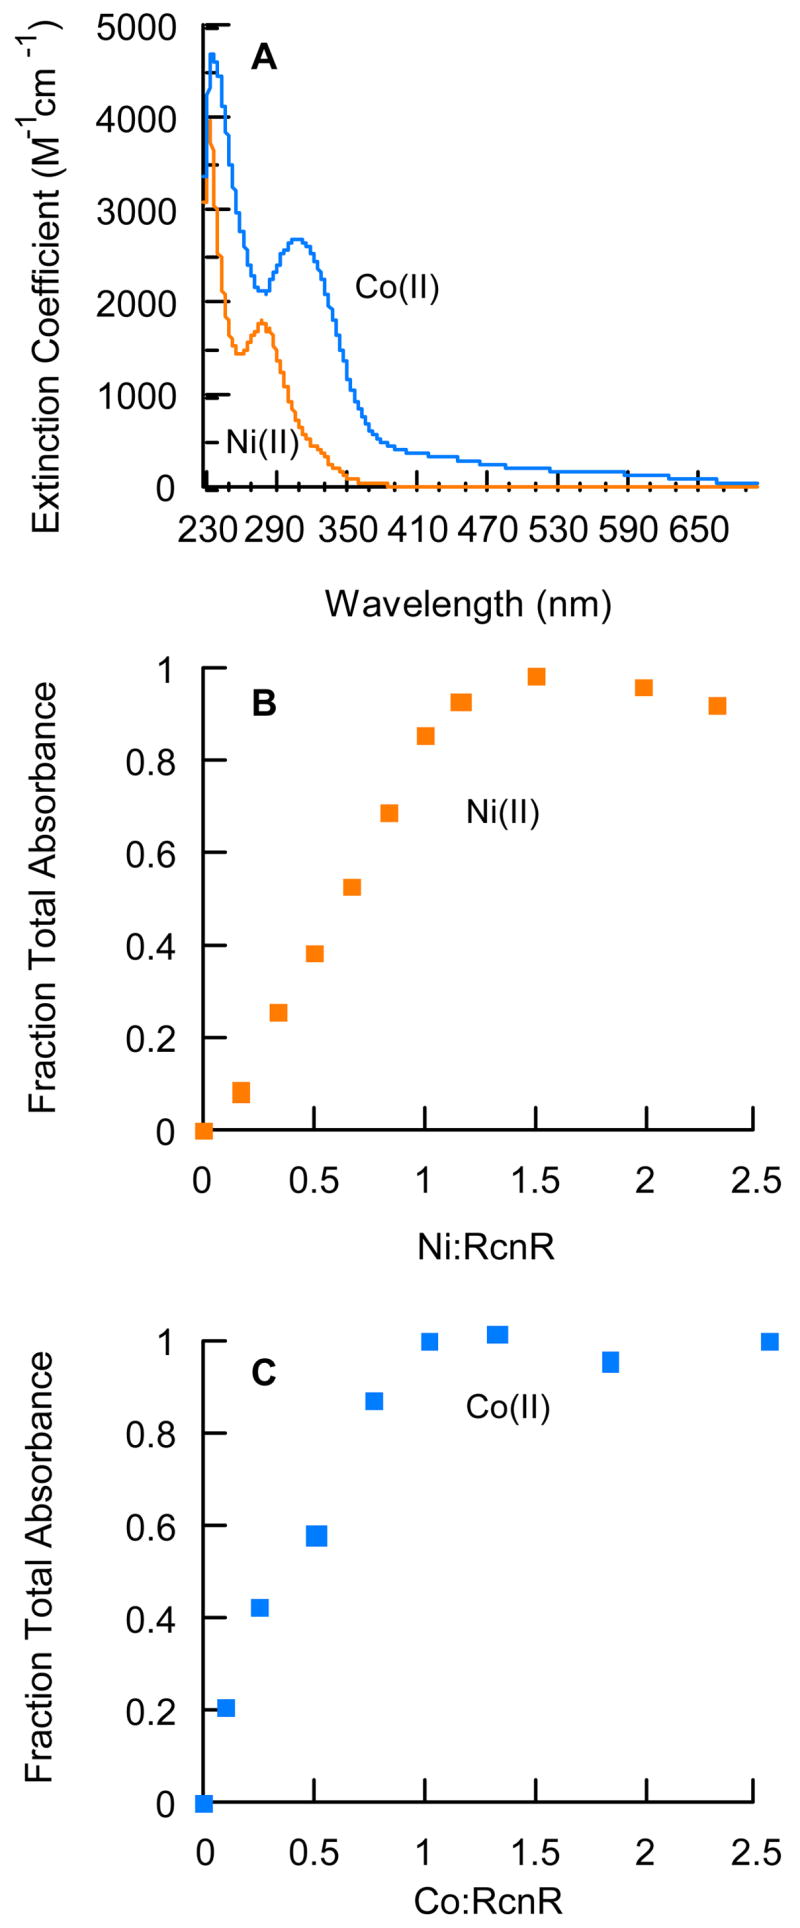
Electronic Spectroscopy of Ni or Co-substituted RcnR. (A) UV-visible difference spectra of 1:1 Ni(II)-RcnR (60 μM) (orange line) and 1:1 Co(II)-RcnR (85 μM) (blue line) were obtained in Buffer M. A metal-free sample was subtracted to obtain the difference spectrum. Data were collected every 0.5 nm. (B) Stoichiometric addition of NiCl2 to RcnR (60 μM). (C) Stoichiometric addition of CoCl2 to RcnR (88 μM). The absorbance signal saturated at 1.0 Co/monomer and 1.2 Ni/monomer under the same solution conditions as in (A).
Thus, a preliminary interpretation of the observed LMCT spectra is that the Co(II)-RcnR complex exhibits a S → M(II)π LMCT at 310 nm, while the S → M(II)σ transition at higher energy is not observed. For Ni(II), the observed transition at 280 nm must be due to S → M(II)σ*, since no other transition is possible, and the energy relative to the Co(II) case reflects the higher energy of the transition moderated by the stabilization of the metal 3d-orbitals with respect to the sulfur 2p orbitals that occurs with increasing effective nuclear charge on the metal.
Metal Binding Stoichiometry of RcnR
Independent experimental methods were used to determine metal binding stoichiometry. Titration of 60 μM RcnR with NiCl2 and 88 μM with CoCl2 revealed a saturation of the absorbance signals that corresponded to M(II)-RcnR complexes with stoichiometries of 1.2 Ni(II)/monomer (Figure 3B) and 1.0 Co/monomer (Figure 3C), or about four metals per tetramer. Because the absorbance change upon metal binding was linear at these concentrations, no accurate determination of binding affinities could be made. The number of metal binding sites per RcnR monomer was also determined using the colorimetric divalent metal indicator, PAR (described in the Experimental Section). The stoichiometries were found to be 0.7 ± 0.1 Co(II)/RcnR monomer and 1.2 ± 0.1 Ni(II)/RcnR monomer. The nickel content was also confirmed using atomic absorption spectroscopy (AAS), which yielded 1.03 ± .01 Ni(II)/RcnR monomer. These data are all consistent with one metal binding site per RcnR monomer, or four binding sites per tetramer.
Metal Affinities
To more accurately define metal-binding affinities, chelator competition assays were performed. It has been previously determined that mag-fura 2 fluorescence is quenched upon 1:1 complex formation with Ni(II).43, 44 To apply this approach to RcnR, the affinities for the dye itself were first determined by direct titration of 0.5 μM mag-fura 2 with NiCl2 in Buffer M. Data were fit to a single site model, giving an affinity of 330 nM for Ni(II), which is slightly higher than the published value of 130 nM, which were carried out under different solution conditions.43
Titrations were then performed with 0.5 μM mag-fura 2 with 1.2 μM RcnR monomer. The presence of RcnR resulted in a shift in the Ni-dependent fluorescence quenching curve (Figure 4A), indicating competition for Ni-binding. However, the shape of the nickel-binding curve indicated that the protein was nearly fully saturated before quenching of mag-fura 2 began. Therefore, only a lower limit of the affinity could be determined from this experiment (Kd < 25 nM ± 4 nM; four non-interacting sites model).
Figure 4.

Ni(II)- and Co(II)-binding affinities determined by competition assay. (A). Mag-fura 2 (0.5 μM) fluorescence (λex=380 nm, λem=505 nm) in the absence or presence of RcnR monomer (1.2 μM) and the indicated concentrations of NiCl2. The solid line represents the fit to a model of four independent binding sites per RcnR tetramer (Kd < 25 ± 4 nM). (B). Fura 2 (0.3 μM) fluorescence (λex=360 nm, λem=500 nm) in the absence or presence of RcnR monomer (360 nM) and the indicated concentrations of CoCl2. The solid line is a fit to a four independent binding site model (Kd < 5 ±2 nM).
Similarly, to examine Co(II) interactions, CoCl2 titrations were performed with 600 nM RcnR and 300 nM fura-2. Titration with fura-2 alone resulted in an affinity of 201 nM for the Co-fura-2 complex (1:1 complex expected).45 When RcnR was added, a noticeable shift in the cobalt titration curve was observed (Figure 4B), but again, only a lower limit of the affinity of RcnR for Co(II) (5 ± 2 nM) could be determined from by this method.
Metal Site Structure
XANES
XAS spectroscopy of Ni(II)- and Co(II)-RcnR was used to obtain structural information about the metal coordination environment. Ni(II)- and Co(II)-substituted samples of a Cys35Ala RcnR mutant were also studied to explore S-coordination at the metal site. Nickel and cobalt K-edge XANES analysis provides information about the coordination number and geometry at each site.46 In the WT Ni(II)-RcnR complex, the pre-edge XANES exhibits only one small pre-edge transition at ~8330 eV (peak area = 0.036(7) eV), associated with a 1s → 3d electronic transition (Figure 5). In the absence of any other pre-edge features, this spectrum is diagnostic for a six-coordinate, pseudo-octahedral Ni(II) center.47 The spectrum of Cys35Ala Ni(II)-RcnR shows a clear change in the intensity of the 1s → 3d transition (peak area = 0.070(16) eV) and a new feature, a shoulder at ~8338 eV, associated with a 1s → 4pz transition (Figure 5). The increased intensity of the 1s → 3d transition and the observation of a second pre-edge feature are both consistent with a five-coordinate, square pyramidal nickel center.47
Figure 5.

K-edge XAS spectra of Ni(II)-RcnR (left), WT (orange) and Cys35Ala (brown) and Co(II)-RcnR (right), WT (lt. blue), and Cys35Ala (dk. blue) in 300 mM NaBr buffer. Top: XANES spectra: insets are enlargements of the peaks associated with the 1s → 3d and 1s → 4pz transitions. Bottom: Unfiltered EXAFS data and fits (black). The fits shown are from Table 1 and correspond to fits 5 and 10 for WT and Cys35Ala Ni(II)-RcnR, and fits 15 and 20 for WT and Cys35Ala Co(II)-RcnR, respectively.
The XAS spectrum of Cys35Ala Ni(II)-RcnR (and no other sample) exhibits a slight change with each sequential scan, indicating some exposure time-dependent radiation damage. The shift in the Ni K-edge energy and changes in the XANES and EXAFS spectra during scans 1–5 (used for the summed file) are too slight to interpret as a specific change in oxidation state or ligand environment (Supporting Information Figure S4. The peak area of the 1s → 3d transition increases from 0.056(25) eV for scan 1 to 0.067(21) eV for scan 5, which are indistinguishable and lie well within the range observed for 5-coordinate Ni(II)-centers.47
In the WT Co(II)-RcnR complex, the pre-edge XANES spectrum features a single small pre-edge transition at ~7710 eV (peak area = 0.097(4) eV) that is associated with a 1s → 3d electronic transition (Figure 5). The small peak area and the absence of any other pre-edge feature are consistent with a six-coordinate, distorted octahedral geometry. While the peak area is slightly larger than usual for octahedral Co(II) complexes, it is significantly smaller than the peaks observed for five-coordinate or tetrahedral Co(II) complexes.48 A slight increase in the 1s → 3d peak area has also been observed in other mixed-ligand, distorted octahedral Co(II) centers.8 The XANES spectrum obtained for Cys35Ala Co(II)-RcnR is very similar that obtained for the WT complex, with only one notable pre-edge feature at ~ 7710 eV (Figure 5). The peak area (0.075(6) eV) is slightly smaller than the corresponding feature in the spectrum of the WT cobalt center, and is also consistent with a six-coordinate site.
EXAFS
EXAFS analysis provides information about the types of scattering atoms and metric details about the complex.46 The results of EXAFS analyses on the RcnR samples are summarized in Figure 5 and Table 1, which contains five example fits for the EXAFS spectrum of each sample. Three of these fits represent the best fits of scattering arising from the first coordination sphere atoms (Fourier-filtered data with a back-transform window of 1.0 – 2.3 Å, not corrected for phase shifts), and include the best single shell fit and the best two shell fits with and without an S-donor ligand. In the fourth fit, data is included to allow the determination of the presence of histidine ligands and an estimate of the number of histidine imidazoles bound to be made (Fourier-filtered data with a back-transform window of 1.0 – 4.0 Å, not corrected for phase shifts). The fifth fit is a refinement against unfiltered EXAFS data. This data and the best fits to unfiltered data are shown in Figure 5. Additional fits of Fourier-filtered data are included in the Supporting Information (Figure S5).
Table 1.
EXAFS Fits for RcnR Complexes
| Sample/Fit # | Na | r (Å)b | σ2 (×103Å−2)c | ΔE0 (eV) | GOFd |
|---|---|---|---|---|---|
| Ni(II)-RcnR | Fourier-Filtered fits with a Backtransform Window = 1–2.3 Å | ||||
| 1 | 6 Ni-N/O | 2.05(2) | 10.4(17) | 7.6(21) | 0.66 |
| 2 | 5 Ni-N/O | 2.07(12) | 7.7(12) | 10.4(15) | 0.48 |
| 1 Ni-N/O | 2.34(350) | [7.7]e | [10.4] | ||
| 3 | 5 Ni-N/O | 2.06(1) | 8.1(7) | 9.5(9) | 0.31 |
| 1 Ni-S | 2.57(2) | 8.2(27) | [9.5] | ||
| 4 | Fourier-Filtered fits with a Backtransform Window = 1–4 Å | ||||
| 2 Ni-Nimd | 1.99(2) | 3.4(19) | 10.6(9) | 0.55 | |
| 3 Ni-N/O | 2.12(1) | [3.4] | [10.6] | ||
| 1 Ni-S | 2.55(2) | 7.5(22) | [10.6] | ||
| Unfiltered EXAFS fit from 2–12.5 Å−1 | |||||
| 5 | 2 Ni-Nimd | 1.986(5) | 3.3(6) | 9.8(3) | 0.70 |
| 3 Ni-N/O | 2.112(3) | [3.3] | [9.8] | ||
| 1 Ni-S | 2.543(7) | 7.4(8) | [9.8] | ||
|
| |||||
| C35A Ni-RcnR fit | Fourier-Filtered fits with a Backtransform Window = 1–2.3 Å | ||||
| 6 | 5 Ni-N | 1.87(1) | 5.7(10) | 2.5(27) | 0.76 |
| 7 | 4 Ni-N/O | 1.88(1) | 4.1(5) | 6.6(17) | 0.43 |
| 1 Ni-N/O | 2.15(2) | [4.1] | [6.6] | ||
| 8 | 4 Ni/N/O | No fit | |||
| 1 Ni-S | |||||
| Fourier-Filtered fits with a Backtransform Window = 1–4 Å | |||||
| 9 | 1 Ni-Nimd | 2.31(3) | 4.1(5) | 3.0(17) | 0.65 |
| 4 Ni-N/O | 1.87(1) | [4.1] | [3.0] | ||
| Unfiltered EXAFS fit from 2–14.0 Å−1 | |||||
| 10 | 1 Ni-Nimd | 2.316(8) | 4.1(2) | 4.4(4) | 0.72 |
| 4 Ni-N/O | 1.876(2) | [4.1] | [4.4] | ||
|
| |||||
| Co(II)-RcnR fit | Fourier-Filtered fits with a Backtransform Window = 1–2.3 Å | ||||
| 11 | 6 Co-N/O | 2.05(3) | 14.8(19) | −0.9(21) | 0.44 |
| 12 | 5 Co-N/O | 2.05(200) | 14.8(32) | −0.9(27) | 0.48 |
| 1 Co-N/O | 2.06(1000) | [14.8] | [−0.9] | ||
| 13 | 5 Co-N/O | 1.97(2) | 16.4(15) | −8.0(13) | 0.16 |
| 1 Co-S | 2.25(1) | 6.6(10) | [8.0] | ||
| Fourier-Filtered fits with a Backtransform Window = 1–4 Å | |||||
| 14 | 2 Co-Nimd | 1.94(3) | 6.6(27) | −2.8(16) | 0.51 |
| 3 Co-N/O | 2.11(3) | [6.6] | [−2.8] | ||
| 1 Co-S | 2.24(4) | 13.1(60) | [−2.8] | ||
| 4 Co-Cimd | 3.01(4) | 13.4(60) | [−2.8] | ||
| Unfiltered EXAFS fit from 2–12.5 Å−1 | |||||
| 15 | 2 Co-Nimd | 1.945(12) | 6.9(13) | −3.0(7) | 0.76 |
| 3 Co-N/O | 2.113(14) | [6.9] | [−3.0] | ||
| 1 Co-S | 2.238(18) | 12.6(28) | [−3.0] | ||
| 4 Co-Cimd | 3.009(19) | 13.5(28) | [−3.0] | ||
|
| |||||
| C35A Co-RcnR fit | Fourier-Filtered fits with a Backtransform Window = 1–2.3 Å | ||||
| 16 | 6 Co-N/O | 1.92(3) | 15.6(29) | −5.2(48) | 0.62 |
| 17 | 4 Co-N/O | 1.92(2) | 6.7(11) | −2.8(23) | 0.43 |
| 2 Co-N/O | 2.12(3) | [6.7] | |||
| 18 | 5 Co-N/O | No fit | |||
| 1 Co-S | |||||
| Fourier-Filtered fits with a Backtransform Window = 1–4.0 Å | |||||
| 19 | 2 Co-Nimd | 1.87(7) | 14.6(66) | −1.6(21) | 0.66 |
| 4 Co-N/O | 1.97(4) | [14.6] | [−1.6] | ||
| 4 Co-Cimd | 2.89(5) | 12.6(66) | [−1.6] | ||
| Unfiltered EXAFS fit from 2–14.0 Å−1 | |||||
| 20 | 2 Co-Nimd | 1.867(23) | 14.3(22) | −1.6(6) | 0.74 |
| 4 Co-N/O | 1.975(11) | [14.3] | [−1.6] | ||
| 4 Co-Cimd | 2.886(18) | 13.2(24) | [−1.6] | ||
N is the number of scattering atoms at a specific distance.
r (Å) is the radial distance.
σ2 is the root mean square disorder in the Ni-X distance, where X is the scattering atom.
GOF (goodness of fit) was calculated as described previously.48 The accuracy of distance determined by EXAFS for atoms in the first coordination sphere of the metal are limited to ± 0.02 Å by the theoretical phase parameters; numbers in parentheses represent standard deviations from the least-squares fits.
Values of parameters in [] were constrained to be equal to those of other scattering atoms in the same shell.
The EXAFS spectrum arising from the first coordination sphere of the metal in WT Ni(II)-RcnR is best modeled as a six-coordinate site composed of two shells of ligands, including one S-scattering atom (Figure 5; Table 1). The number of scattering atoms in the first coordination sphere is in agreement with the XANES analysis of the Ni(II) site (vide supra). Addition of a S-donor at a long distance (2.57(2) Å) improves the goodness of fit by 35% over the best fit composed of two shells of N/O scattering atoms. Data obtained from samples prepared in buffers containing 300 mM NaBr or 300 mM NaCl were essentially identical (Supporting Information Figure S6), confirming the assignment of a S-scattering atom and not a Cl−ion from the buffer. Analysis of the EXAFS data including scattering atoms in the second and third coordination sphere confirms the presence of histidine ligation (the best fit with histidine ligands has a GOF that is 15% better than the best fit obtained without imidazole parameters using the same back-transform limits), and an estimate of 2–3 histidine ligands. Refinement of the models against unfiltered data led to similar conclusions, with the fit obtained for two histidine ligands having the lowest GOF value (Supporting Information Tables S1 and S3). Fits obtained using either Fourier-filtered or unfiltered data clearly show a substantial improvement upon inclusion of a long Ni-S vector (Table 1 and Supporting Information Tables S1 and S3). The EXAFS analysis is therefore consistent with a Ni(His)2(Cys)(N/O)3 site in WT Ni(II)-RcnR.
The EXAFS spectrum obtained for the Cys35Ala Ni(II)-RcnR further supports the inclusion of an S-donor in the coordination sphere of WT Ni(II)-RcnR, and identifies the ligand involved as Cys35. The first coordination sphere EXAFS data is best modeled by a single type of scatterer, N/O-donors (Table 1). Splitting the coordination sphere into two shells improves the GOF by 43%. The number of N/O ligands determined for the first coordination sphere is five, which is also in agreement with the XANES analysis. Multiple-scattering analysis of data including second and third coordination sphere atoms is consistent with one histidine ligand, although the improvement over the fit obtained without imidazole parameters is modest (7%). There is no evidence in the data for a Br− ion from the buffer coordinating to the Ni(II) center. The EXAFS analysis of Cys35Ala Ni(II)-RcnR is therefore consistent with a Ni(N/O)5 site, where the number of histidine ligands is not clear. This might be due to the large distribution in Ni-NHis distances (static disorder) that occurs as a result of the loss of C35, a possibility that is consistent with the range of Ni-N/O distances observed (1.87–2.31 Å).
The analysis of first coordination sphere EXAFS data for Co(II)-RcnR also reveals the presence of a S-donor ligand. The addition of a single S-donor to a shell of five N/O-donors greatly improves the GOF compared to a fit containing six N/O donor ligands (67%, Table 1). Again, data obtained in 300mM NaCl or NaBr containing buffers gave indistinguishable results, confirming the assignment of an S-donor ligand. The total number of ligands (six) agrees well with the XANES analysis (vide supra). Analysis of the spectrum using multiple-scattering parameters to account for histidine ligation is consistent with the presence of ~ 2 histidine ligands (15% improvement in GOF). The structure that emerges from the EXAFS analysis for WT Co(II)-RcnR is Co(His)2(Cys)(N/O)3, a result that is similar to the Ni site structure in WT Ni(II)-RcnR. Since there is only one Cys ligand present in EcRcnR, the two metals both bind Cys35 in six-coordinate sites that also contain at least two imidazole ligands. The largest difference apparent in the EXAFS spectra of the two metal sites is the M-S distance, which is short for Co(II) (2.24(2) Å) and long for Ni(II) (2.54(2) Å).
The EXAFS arising from first coordination sphere scattering atoms in Cys35Ala Co(II)-RcnR center is best modeled by six N/O-donors at two different distances (Table 1). Inclusion of a S-donor ligand causes the fit to diverge. Multiple-scattering analysis of the Co(II) site is consistent with the presence of 2 ± 1 imidazole ligands. Thus, the perturbation in the metal site for the Cys35Ala mutants is distinct. In the case of Ni(II), the site is five-coordinate, reflecting the loss of the S-donor. For Co(II), the site binds an unknown sixth N/O-donor ligand. Both Cys35Ala sites have poorly refined data for histidine ligation.
EPR
The analysis of the XAS data from both Ni(II)- and Co(II)-RcnR are consistent with six-coordinate, M(Cys)(His)2(N/O)3 complexes, but differ strikingly in the M(II)-S distance found for the Cys ligand (2.24(2) Å for Co(II) and 2.54(2) Å for Ni(II)). Six-coordinate Ni(II) complexes are invariably high-spin, S = 1 complexes, and the M-ligand distances found for the Ni(II)-RcnR complex are consistent with this electronic configuration.49 Both high-spin (S = 3/2) and low-spin (S = 1/2) Co(II) complexes are common, but are easily distinguished by EPR spectroscopy.50 The EPR spectrum of Co(II)-RcnR collected at 12 K shows features that are typical of an S = 3/2 Co(II) center (Supporting Information, Figure S7). Integration of the EPR spectrum shows an absorption curve that lies on a flat baseline, indicating that no saturation effects are seen. The experimental spectrum can be simulated by a high-spin, S = 3/2 Co center with Ms = 1/2, D ≫ hν (50 cm−1 was used), gx,y = 2.210, gz = 2.195, and E/D = 0.07. These values are typical for high-spin 5- or 6-coordinate Co(II) in protein ligand environments.51
Identification of Metal Sensing Determinants by Amino Acid Substitutions
Site-directed mutagenesis of the rcnR gene (pJI114) was carried out to gain functional insight into the amino acids that form the metal-binding site, as suggested by spectroscopic measurements and sequence conservation. The regulation of RcnA expression by the RcnR mutants was tested in vivo using the previously described LacZ assay.9 A mutation that reduced metal binding should generate a constitutively active repressor and result in low LacZ activity, even in the presence of Ni(II) or Co(II). Importantly, any mutation that caused the protein to be poorly expressed, unstable, or unable to bind DNA would lead to high LacZ activity in both the presence and absence of these metal ions. Mutated RcnR residues included all five histidine residues (3 are highly conserved), a subset of conserved Glu and Asp residues, and the highly conserved Cys35 (see Supporting Information). An alanine insertion mutation (A2*) will result in an expressed protein with N-terminal sequence NH2-Ala2*Ser3His4 after processing, instead of NH2-Ser2His3, thereby disrupting the spacing between His3 and the NH2-terminus. This mutation was constructed to test the role of amino-terminal coordination in metal-responsiveness based on the precedent of N-terminal Ni-coordination seen with Ni-SOD.52, 53
Ni(II)-responsiveness
Two mutations (Ala2* and His3Leu) completely abolished Ni-responsive LacZ expression. A third mutation (His64Leu) showed only partial induction (44%) compared to wild type. Mutants at two positions (Cys35Ala and His60Ala) that lost Co(II)-responsiveness (see below), maintained sensitivity to Ni(II), suggesting a key structural difference in the metal-mediated inhibition of DNA-binding by Ni(II) vs. Co(II). The response of Cys35Ala to Ni(II) was unexpected based on the XAS analysis for this protein, which showed the loss of S-coordination. A Cys35Leu mutation was non-responsive to Ni(II), which could result from steric perturbation of the Ni(II)-binding site. Additional mutations of His60 to Leu and Asn also maintained Ni-sensitivity, suggesting that this His residue is not a Ni-ligand, in contrast to the results for Co(II) (see below). Only the mutation of His60 to Arg completely abolished nickel responsiveness, most likely due to steric effects from the large, positively charged Arg sidechain. Mutation of Asp7, Asp30, His33, Glu34, Glu63, His67, Asp77, Asp79, Asp86, or Tyr88 had no effect on Ni(II)-responsiveness, eliminating these residues as possible Ni-ligands.
Co(II)-responsiveness
Mutant RcnR constructs were tested for LacZ activity in the presence of 200 □M CoCl2. LacZ activity is increased ~20-fold under these experimental conditions when wild-type RcnR is present (Figure 1). The Ala2*, His3Leu, Cys35Ala, His60Ala/Asn/Leu/Arg and His64Leu mutants were non-responsive (< 5% of wild-type) to added Co(II) and showed constitutive, low LacZ activity. These mutations potentially account for five of the six cobalt ligands determined by XAS. As with Ni(II), mutation of Asp7, Asp30, His33, Glu34, Glu63, His67, Asp77, Asp79, Asp86, or Tyr88 had little or no effect on Co(II)-dependent LacZ expression compared to wild-type RcnR.
UV-visible Absorption Spectroscopy of RcnR mutants
UV-visible spectroscopy of mutant RcnR proteins was used to explore the relationship between M(II) coordination and the LacZ assay data, in particular the differences between Cys35, His60 and His64 in Ni(II) and Co(II) coordination. Individual mutations were constructed in the RcnR expression vector. Mutant proteins were overexpressed and purified the same as for wild-type RcnR, with similar yields. UV-visible spectra for M(II)-substituted RcnRs (1:1 metal:RcnR) are shown in the Supplemental Information (Figure S8). The extinction coefficients of the absorbance maxima for each M(II)-RcnR variant are listed in Table 2. The fully Ni(II) and Co(II) responsive D30N RcnR mutant (Figure 6) served as a control protein that exhibited little perturbation of the UV-visible spectra of the M(II) substituted proteins.
Table 2.
UV-visible spectral features for M(II)-substituted RcnRs
| RcnR variant | Ni(II) | Co(II) | ||
|---|---|---|---|---|
| λ (nm) | ε (M−1 cm−1) | λ (nm) | ε (M−1 cm−1) | |
| Wild-type | 235 | 3937 | 238 | 4675 |
| 240 | 4609 | |||
| 280 | 1778 | 314 | 2664 | |
| 286 | 1713 | 549 | shoulder | |
| A2* | 240 | 10555 | 239 | 12200 |
| 428 | 136 | 286 | shoulder | |
| 322 | 4681 | |||
| 557 | shoulder | |||
| H3L | none | 238 | 2733 | |
| 296 | 2270 | |||
| 597 | 194 | |||
| 619 | 214 | |||
| D30N | 234 | 4420 | 242 | 4100 |
| 280 | 1709 | 312 | 2500 | |
| C35A | 240 | 8308 | 238 | 4598 |
| 456 | 76 | 272 | 1678 | |
| 325 | 850 | |||
| 491 | 86 | |||
| C35L | 240 | 6052 | 239 | 3626 |
| 452 | 48 | 346 | shoulder | |
| H60L | 237 | 3462 | 238 | 9539 |
| 281 | 2407 | 307 | 5134 | |
| 287 | 2429 | 450 | shoulder | |
| 586 | shoulder | |||
| H60R | 238 | 6840 | 240 | 14280 |
| 290 | shoulder | 284 | 14145 | |
| 450 | 45 | 550 | shoulder | |
| H64L | 237 | 3666 | 239 | 10148 |
| 278 | 2546 | 289 | 6922 | |
| 380 | 40 | 550 | shoulder | |
| 600 | 19 | |||
Figure 6.
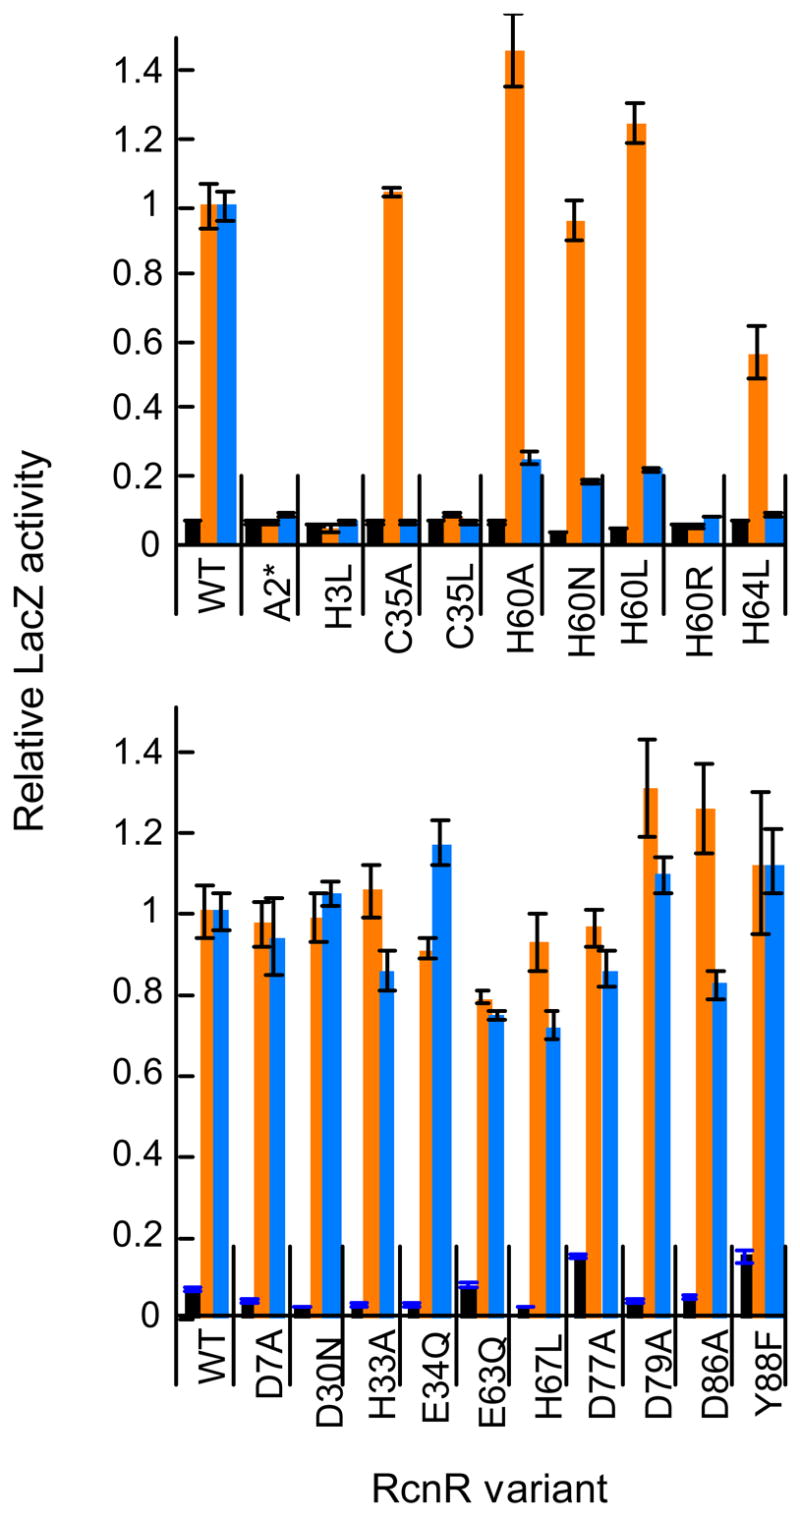
Effect of side-chain substitution of conserved residues on RcnR function in vivo. Top: Mutants that affect either Co(II) or Ni(II) responsiveness. Bottom: Mutants that do not affect Ni(II) and Co(II) responsiveness. β-galactosidase activity was measured for the PrcnA–lacZ reporter construct encoding wild-type or mutant rcnR genes (Supplemental Table S8) in E. coli strain PC563 grown anaerobically in LB media in the absence (black bars), or presence of 1mM NiCl2 (orange bars) or 200 μM CoCl2 (blue bars). Each mutant is normalized to wild-type activity with either NiCl2 or CoCl2. A relative activity of 1 corresponds to about 168 Miller units with Ni(II) and 209 Miller units for Co(II). All data are normalized to WT + Ni(II) for ease of comparison. Error bars show the standard deviation of the LacZ activity of 3 separate samples. Mutations were constructed in pJI114 as described in the Experimental Section.
Ni(II)-substituted mutants
WT Ni-RcnR exhibited minimal absorbance features between 400 – 700 nm, as expected of a 6-coordinate metal site that lacks d-d electronic transitions. Decreases in Ni(II)-coordination number are expected to increase absorbance in the visible range. An alteration in the interaction with Cys35 is expected to shift the energy or magnitude of the 280 nm S→ Ni LMCT peak. All RcnR mutants, except H3L, bound ~ 1 equivalent of Ni/RcnR monomer (Supporting Information Figure S9). H3L RcnR showed no features in the difference UV-visible spectrum indicative of bound Ni(II) atoms. For both C35A and C35L RcnR, the 280 nm S→ Ni LMCT feature was absent, while the 235 nm feature remains. Additionally, both of these mutants have a feature at ~450 nm which can be attributed to a Ni(II) d-d transition. These data indicate that both mutants have 4- or 5-coordinate sites, the latter being consistent with the XAS analysis of C35A Ni(II)-RcnR. The Ni(II)-A2*-RcnR spectrum contained a feature at 420 nm (ε420=136 M−1 cm−1) that is of similar intensity to one observed for the square-planar Ni(II)-site of E. coli NikR,54 and a similar geometry may be adopted for A2* Ni(II)-RcnR. This mutant also lacked the 280 nm S→ M LMCT feature, suggesting loss of Cys-coordination. The H64L Ni(II)-RcnR spectrum contained two weak features at 380 nm and 600 nm not seen for WT. These features are consistent with a 6-coordinate Ni(II) site55 that is clearly distinct from WT Ni(II)-RcnR. Except for A2* and H3L, each mutant shows a significant shift in the 280 nm S→ M LMCT feature. Together, these data strongly indicate that the NH2-group of the amino-terminus and the side-chains of His3, Cys35 and His64 coordinate nickel. When these residues were disrupted, the proteins adopted altered coordination geometries (4, A2*; 5, C35A; 6, H64L), or cannot bind Ni at all (H3L). In contrast, the H60L Ni(II)-RcnR spectrum showed neither an increase in the intensity of d-d features nor a significant perturbation of the 280 nm peak, suggesting that this residue is not involved in Ni coordination. These data are consistent with the LacZ data for the H60L/N mutants. Only when His60 was substituted with the bulky, charged Arg sidechain was the UV-visible Ni(II) spectrum affected, with features suggesting a five-coordinate metal-site. The effect of the H60R mutation on Ni(II)-responsiveness indicates this residue is near the metal-site but does not contribute to Ni(II) coordination.
Co(II)-substituted mutants
Unlike Ni(II)-RcnR UV-Vis spectra, the d-d transitions of wild-type and mutant Co(II)-RcnR proteins were difficult to resolve due to the extended tail of the S→ Co LMCT (Figure 3; ~315 nm). However, other differences can be observed for Co(II)-substituted RcnR mutants (see Supplemental Information). These changes, combined with alterations to the S→ Co LMCT feature, are diagnostic of changes in Co(II) coordination. As with WT RcnR, all mutant proteins tested bound ~1 equivalent of Co(II) per RcnR monomer (see Supplementary Information). The C35A and C35L Co(II)-RcnR spectra lacked the strong absorbance feature at 315 nm. These data confirm the assignment of this peak as S→ Co LMCT. They also provide further support for C35 as a Co ligand, in agreement with the XAS analysis of C35A Co(II)-RcnR. H3L RcnR still bound Co(II), although the Co(II) affinity appeared significantly weaker than for wild-type based on the sigmoidal shape of the titration curve. This mutant also showed distinct UV-visible spectral features in the d-d transition region with peaks at 597 nm (ε=194 M−1 cm−1) and 619 nm (ε=214 M−1 cm−1). These values are most consistent with a 5-coordinate Co(II) complex.56
Spectra for A2*, H60L, and H64L Co(II)-RcnR were not as distinctly different from WT, but each showed a large increase in absorbance for the S→ Co transition and a shifts in energy for this transition (A2*, longer wavelength; H60L and H64L, shorter wavelengths). Changes were also observed between 500–700 nm, but these differences are difficult to resolve due to overlap with other features. It is likely that the mutant sites remain 6 coordinate, but with a variable sixth ligand as seen by XAS for C35A Co(II)-RcnR. While a precise characterization of these mutant sites cannot be made, it is clear that the mutations have altered the Co(II) site, and further supports the model of Co(II)-coordination by the NH2-terminus, H3, C35, H60 and H64 suggested by the LacZ assay data.
Discussion
RcnR plays a pivotal role in intracellular sensing of Ni(II) and Co(II) ions in E. coli, where it must specifically interact with these metal ions when they are deemed to be in excess. The identification of the metal-binding ligands by a combination of XAS and mutagenesis experiments provides a starting point for understanding the allosteric regulation of RcnR activity by Ni(II) and Co(II). The characterization of the Ni(II) and Co(II) binding sites also permits a comparison of RcnR with NikR, the other nickel responsive regulator in E. coli, as well as Ni(II)/Co(II) responsive regulators in other organisms. The results of this work, in combination with the prior study of the Cu(I)-responsive CsoR,12 establish a framework for understanding the ligand selectivity of other members of the RcnR/CsoR family of transcription factors.
Ni(II) and Co(II) bind to RcnR with 1:1 stoichiometry and upper limits on the dissociation constants of 25 nM and 5 nM, respectively. These affinities make RcnR sensitive to low levels of free nickel and cobalt ions (lower limit ~ 1 nM) in E. coli that, in the absence of other effects, would lead to relatively rapid induction of rcnA expression in response to excess metal. Both Ni(II) and Co(II) increase the stability of the RcnR tetramer without altering its oligomeric state or producing large-scale changes in secondary structure. The identity of the subunit interface required for RcnR tetramerization is unknown. The structure of M. tuberculosis CsoR revealed a dimeric species,12 from which a reasonable structural homology model of RcnR can be constructed. The solution and crystal structure data presented for CsoR emphasized the dimeric form of the protein, but there was also evidence for a tetrameric species. In particular, two distinct dimer-dimer interfaces are present in the unit cell, either of which may be relevant to tetramer formation by RcnR, or may simply result from packing in the crystal lattice. CsoR also has a 30-amino acid C-terminal extension not visible in the crystal structure that may influence the multimeric state of the protein. RcnR dimers may occur in the cell, where its concentration is likely an order of magnitude less than those used in the analytical ultracentrifugation experiments. Differences in oligomeric state between the two proteins may impact the mode of DNA-binding and recognition, which is currently unknown. Nonetheless, the metal-binding properties of both CsoR and RcnR can be fully explained by examining only the dimeric assembly of the protein monomers.
The XAS analyses for Co(II)- and Ni(II)-RcnR reveal similar, but not identical, six-coordinate binding sites for each metal. XANES analyses indicate a pseudo-octahedral geometry for both metal ions, and EXAFS analyses are consistent with a similar set of six ligands: Cys(His)2(N/O)3 (Figure 5 and Table 1). The major difference seen between the Co(II) and Ni(II) centers is the M-S distance, which is long for Ni(II)-RcnR (2.54 Å) and short for Co(II)-RcnR (2.24 Å). The 2.54 Å Ni-S distance is higher than the mean distance for unidentate S-donor ligands of all types (2.47 Å),49 and at the high end of the distances found in the small number of structurally characterized high-spin, six-coordinate Ni(II) thiolate complexes that are known. Six-coordinate Ni(II) complexes are invariably high-spin (S = 1), which accounts for longer Ni-ligand distances in these complexes. The lability of the high-spin S = 1 configuration also likely accounts for the fact that only a few high-spin nickel thiolates have been characterized, and these feature chelating thiolate ligands.41, 42 For example, diaquabisdimethylaminothioquadratonickel(II) (NiS2N2O5C12H20) contains an average Ni-S distance of 2.469(1) Å,41 tetraethylammonium tris2-thiopyridiniumnickelate(II) (Ni(SC5H4N)3) contains Ni-S distances ranging from 2.518(1) Å to 2.541(1) Å,42 and tetraphenylphosphinium tris2-thiopyrramidiniumnickelate(II) (Ni(SC4H3N2)3•CH3CN contains Ni-S bond distances ranging from 2.460(2) to 2.545(2) Å.42 The Ni-S distance in Ni(II)-RcnR is clearly distinct from the short Ni-S distances found in planar, S = 0, NiS4 complexes (mean Ni-S = 2.18 Å).49 The Ni-N average distances observed for Ni(II)-RcnR (1.98 and 2.11 Å) are also consistent with the high-spin configuration and fall in the range observed for structurally characterized high-spin Ni(II)N6 complexes (mean Ni-N = 2.07 Å).49 Thus the metal-ligand distances found for the WT Ni(II)-RcnR complex are consistent with a high-spin (S = 1) complex. Co(II)-RcnR has an EPR spectrum that is typical of a high-spin, S = 3/2 center,51 and clearly different from the low-spin, S = 1/2, complexes that have been characterized.57 The metal-ligand distances found for six-coordinate Co(II) thiolates are variable [2.338(1) Å to 2.585(1) Å],58, 59 a reflection of the S = 3/2, d7 electronic configuration, which lacks an unfilled π-symmetry orbital in contrast to d8 Ni(II). An example of a structurally characterized six-coordinate Co(II) thiolate complex with a confirmed S = 3/2 ground state (μeff = 4.83 μB) is dimethanolbis-dimethylaminothioquadratatocobalt(II) (CoS2N2O5C12H20), which features an average Co(II)-S distance of 2.500(1) Å.60 The Co-S distance found for Co(II)-RcnR lies at the lower end of the range of Co(II)-S distances observed. The difference between the Co(II)-S and Ni(II)-S distances in RcnR suggests that either the Co(II)-S bond is supported by a π-interaction that is absent for Ni(II), or that the protein conformation allows stronger Co(II)-S binding. A likely consequence of the shorter Co(II)-S interaction is a different protein conformation resulting from Co(II) vs Ni(II) binding, which is discussed further below.
The structural characterization of the Ni(II) and Co(II)-binding sites of RcnR allows a comparison with Ni(II) and Co(II) sites in other metalloregulators from E. coli and other bacteria. This study also completes structural characterization of the three known Ni(II)-binding sites involved in transcriptional regulation in E. coli. The two nickel-responsive transcriptional regulators from E. coli, RcnR and NikR, operate in a sequential fashion in response to increasing intracellular nickel9. NikR binds to DNA in the presence of Ni(II) and represses the transcription of the genes encoding the NikABCDE uptake permease. In contrast, RcnR-dependent repression of rcnA is maintained until nikABCDE expression is fully repressed, then increasing Ni(II) releases RcnR from DNA. NikR contains two Ni(II) binding sites, termed high- and low-affinity. The high-affinity Ni(II)-binding site (Kd ~ 1 pM)7, 35 is a low-spin (S = 0), four-coordinate planar complex with His3Cys coordination61, 62 that is essential for biological function.63 Changes in high-affinity Ni(II)-site occupancy are thought to tune nikABCDE expression according to Ni-enzyme expression levels.9, 63 The low-affinity Ni-sites (Kd 5 nM)64 are six-coordinate but do not employ thiolate coordination.8 Low-affinity site occupancy increases DNA-binding affinity (Kd ~ 5 pM),35, 64 and results in full repression of nikABCDE expression.63 The Ni(II)-site in RcnR is high-spin and six-coordinate with an affinity similar to six-coordinate site of NikR, but their relative numbers in the cell are probably quite different – the NikR low-affinity sites occur only when bound to DNA so there are 2 per cell (considering there is only one known NikR DNA-binding site in the chromosome) while the number of RcnR sites is likely 1–2 orders of magnitude greater based on the range of intracellular concentrations observed for different repressor proteins in E. coli.35, 65–67
The differences in the electronic structures of the three sites have several ramifications for the physical and functional properties of the Ni(II) sites. First, the M-ligand bond distances are quite different, seen most dramatically in the Ni-SCys distances for NikR61 (2.13 Å) and RcnR (2.54 Å). These differences reflect the increased ionic radius of the high-spin ion that occurs when σ* levels are populated. The mechanism for ligand exchange reactions for the two types of Ni(II) centers are also expected to differ. High-spin Ni(II) centers typically undergo ligand exchange via the ligand-dissociation, which is favored by the high-spin electronic configuration. In contrast, four-coordinate planar complexes undergo ligand exchange via a mechanism involving association of the incoming ligand, and therefore depend strongly on the nature of the nucleophile involved.68 Thus, the NikR high-affinity site, which is not easily accessible in the protein, is not prone to easy nickel release once the metal is bound. A specific mechanism, such as a conformational change, might be required to release nickel. The occupancy of the high-affinity site of NikR is inversely correlated with nickel-enzyme expression9, 63 and its function is consistent with conservation of biosynthetic resources rather than stress. In contrast, the six-coordinate Ni(II) sites of NikR and RcnR appear to be designed for spontaneous metal release in response to decreasing metal ion concentration, as both of these sites function to respond to fluctuations in intracellular nickel concentrations that occur under stress conditions.9, 63
The use of a single cysteine thiolate ligation in NikR and RcnR would seem to be an ideal choice for a metal ion electronic structure sensor. The thiolate sulfur is both a σ- and π-donor and is therefore able to discriminate between metal ions by “sensing” the occupancy of both sets of metal d-orbitals. Considering the Co(II) and Ni(II)-substituted forms of RcnR and NikR, low spin Ni(II) has filled □-symmetry d-orbitals and the highest energy σ̃ orbital (dx2-y2) is directed at the ligands and is unoccupied. This electronic structure leads to a very short in-plane Ni-S distance (2.13 Å). In contrast, for high-spin Ni(II), there is still no vacancy in the π-symmetry orbitals, but the σ-symmetry orbitals are both singly occupied, resulting in a much longer Ni(II)-SCys distance. For Co(II), the π-symmetry orbitals have one vacancy, opening up a possible π-interaction, resulting in an intermediate M-S distance (2.26 Å). Thus, the use of a single cysteine ligand in metallosensors is a useful mechanism for interrogating the electronic structure of the bound metal ion, a critical aspect of generating the appropriate metal-specific allosteric response.
Mutation of RcnR identified specific residues involved in metal binding and support the ligand set determined from EXAFS analysis. The mutant data reveal that Ni(II) and Co(II) use distinct, but overlapping, ligand spheres to regulate RcnR DNA-binding activity. The mutation of His3 showed the most severe effects on metal-binding, virtually eliminating UV-vis spectral features for Ni(II) and substantially decreasing Co(II)-binding affinity. The involvement of the N-terminus in the metal binding site is supported by the CsoR structure, where the amino terminus is near the Cu(I)-binding site (Figure 7).12 The extension of the N-terminus by one amino acid (A2* mutant) also impaired Ni(II) and Co(II) binding and responsiveness. The involvement of the N-terminal amino group and the side-chain of the second residues is similar to that observed for Ni-SOD.52, 53 In this case, the deprotonated main chain amide of residue 2 also coordinates the Ni atom, suggesting that RcnR also uses main chain coordination by the amide of His3 for Ni(II) and Co(II) binding. Both Ni(II) and Co(II) are known to bind Gly-His and deprotonate the main chain amide to form a stable coordination complex,69, 70 providing a chemical precedent for our model. The A2* mutation likely impairs Ni(II)-responsiveness by forming a square-planar ATCUN motif (Xaa-Xaa-His).70, 71 The tripartite coordination of Ni(II) and Co(II) by the two N-terminal residues of RcnR is a key aspect of its selectivity towards metals with preferences for higher coordination numbers.
Figure 7.
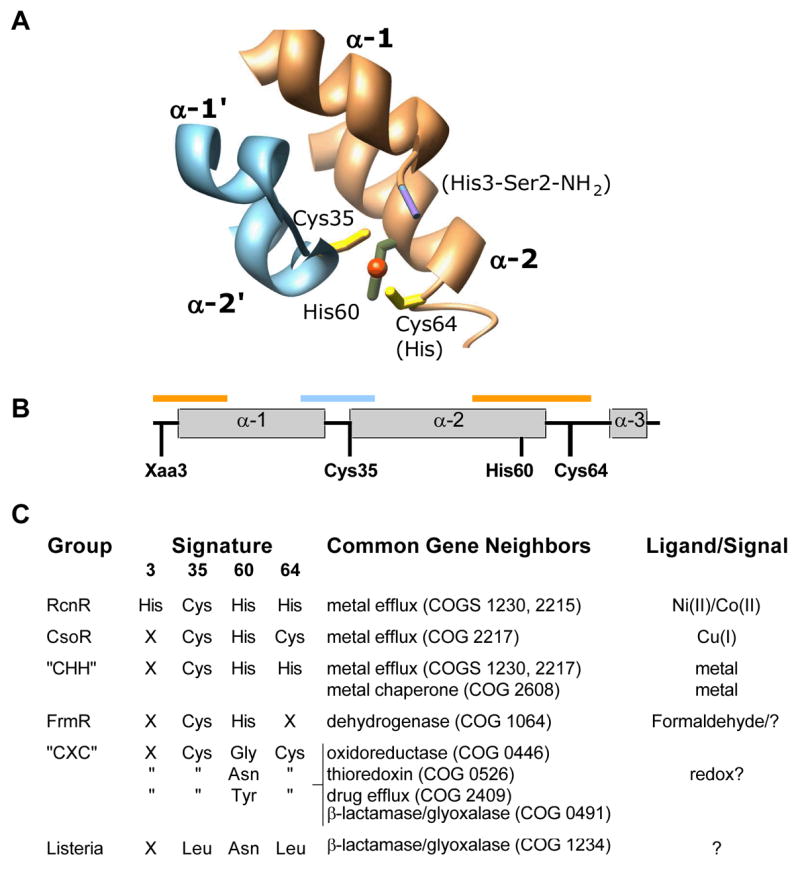
Fingerprinting the RcnR/CsoR family. (A) Image of Cu(I)-CsoR (PDB ID 2HH7) showing the residues (RcnR numbering) that coordinate the cuprous ion (orange sphere). The two different subunits of the CsoR dimer are shown in light blue and orange. Text in parentheses refers to the identity of RcnR Ni/Co coordinating residues. (B) Scheme of the CsoR primary structure showing the positions of the fingerprint amino acids identified by bioinformatics analysis. The orange and blue bars correspond to the regions of structure shown in panel A. (C) Summary of the sequence fingerprint, gene neighborhood, and ligand predictions of different classes within the CsoR/RcnR family. See Supporting Information for more detail.
His64 also contributes to the responsiveness of Co(II) and Ni(II). The slightly different effect of the His64Leu mutation on the metal response for Ni(II) and Co(II) is consistent with expectations arising from differences in electronic structures of the metal-coordination complexes. This residue at this position in CsoR is Cys suggesting that changes in this residue position will be important for metal selectivity and responsiveness regardless of coordination number.
The differential contributions of Cys35 and His60 to Co(II)- and Ni(II)-responsiveness suggest that these residues play different roles in the structural response of the RcnR to metal-binding. The spectroscopic studies of RcnR demonstrate that Cys35 is a ligand for both metals. The basis for the absence of an effect of the Cys35Ala mutation on Ni(II) responsiveness is currently unclear. Cys35 may play a more prominent role in metal-selectivity rather than the allosteric response to metal binding. In contrast to Cys35, the mutation of His60 has little effect on the spectroscopic properties of the Ni(II) site. This position is invariant in RcnR and CsoR proteins so its dispensability with regard to Ni(II) response is unexpected, but might reflect another difference between the ligands used to bind Ni(II) and Co(II).
The minimal structure that emerges from the combination of XAS and mutagenesis analysis, M(Cys)(His)2(NH2-Ser)(N/O)2, clearly identifies five metal ligands (the NH2-terminus, the His3 amide, and the sidechains of His3, Cys35, and His64) for both Ni(II) and Co(II), and a sixth, His60, for Co(II). The difference between EXAFS and mutagenesis, combined with structural homology, in assigning the number of His ligands is not unreasonable owing to the effect of His conformation on fitting these residues to EXAFS data.72 A sequence alignment of the predicted RcnR proteins (see Supporting Information) does not reveal a highly conserved sixth residue with a side chain likely to function in metal binding (Asp, Glu, Met, His, Cys). Mutation of several candidate residues, including those closest to the M(II)-binding site, did not cause any changes in Co(II) or Ni(II) responsiveness, leaving the identity of the sixth Ni(II) unresolved. The mutagenesis approach will only identify side chain ligands so a Ni(II) coordination sphere completed by a second main chain amide will require additional experimental approaches for identification. Alternately, the coordination sphere could be completed by a ligand from the solvent (aqua or hydroxo) but not a halide ion, based on the XAS data.
The regulation of DNA-binding through allosteric changes communicated between metal- and DNA-binding sites is commonly observed in metalloregulator proteins.1 Giedroc and coworkers have shown for the Zn-responsive CzrA and SmtB proteins that two residues of the tetrahedral metal-binding site are critical for transmitting the metal-binding state of the site to the rest of the protein.73, 74 The other two residues are primarily important for maintaining the tetrahedral coordination geometry. These observations suggest that within a particular structural class of metalloregulator, one or more master residues are critical for allostery. RcnR and CsoR share three conserved ligand positions (35, 60, and 64), suggesting that one or more of these residues may be essential for the allosteric response to metal binding. The regulation of RcnR by Co(II) and Ni(II) binding is coupled to a change in stability. For Co(II) and Ni(II), the ligand-binding sites utilize three distinct regions of the protein primary sequence and link these elements together (Figure 7). The stability change could include a rearrangement of secondary structure elements relative to the metal-free protein, or alter the orientation of monomers/domains relative to one another as seen for the iron-responsive regulator DtxR.75 Either of these mechanisms is consistent with the absence of a change in RcnR secondary structure upon metal binding. The unaltered sensitivity of the Cys35Ala and His60 mutants to Ni(II), suggests either that these residues are not important for the allosteric response, or more than one allosteric network exists in this protein family. The Cys35 mutant data suggest that Ni(II) dependent allostery originates from intramonomer metal coordination, in contrast to Co(II)-RcnR and Cu(I)-CsoR where this residue is essential for activity. There is no functional requirement to preserve a single allosteric mechanism for the metal-dependent inhibition of DNA-binding for a particular metalloregulator. The primary requirement of this class of metalloregulator is that metal binding reduces DNA-binding affinity. Thus, Ni(II)-RcnR and Co(II)-RcnR are likely distinct structural entities whose common feature is an inability to bind DNA with appreciable affinity.
The requirement for thiolate coordination in Co(II)-discrimination by RcnR is currently a singular occurrence. RcnR is functionally analogous to M. tuberculosis NmtR and KmtR, which also utilize six-coordinate geometry to bind Ni(II) and Co(II) between two monomer chains.6, 76, 77 However, KmtR and NmtR use only N- and O-ligands for metal coordination. Neither protein utilizes the NH2-terminal, main chain amide, and thiolate coordination environment proposed here for RcnR. Additionally, mutational studies of putative metal-binding ligands in both proteins have shown identical effects, or lack thereof, on Ni and Co-responsiveness.77 KmtR has only recently been identifed,77 so the physiological requirement for two functionally similar Ni/Co responsive regulators in the same organism is not fully appreciated. However, the mutagenesis studies of NmtR and KmtR demonstrate that, despite their structural homology, the structural location of the metal-binding sites in each protein is distinct. This difference also manifests itself in the metal-binding affinities of the two proteins, wherein KmtR has a higher relative affinity for Ni(II) and Co(II) than NmtR.77
NmtR and KmtR, like RcnR, are members of a large family of metalloregulators (ArsR/SmtB) that show distinct metal-binding specificities that correlate with differences in coordination number. Interestingly, the Zn/Co responsive Staphylococcus aureus6 CzrA protein uses a four-coordinate tetrahedral site. The higher coordination number observed in NmtR is achieved by the recruitment of two His ligands from a short C-terminal extension in the protein that is not present in CzrA,76 similar to the recruitment of N-terminal residues for Ni/Co coordination by RcnR. The MerR family uses a variable loop region between two helices to increase coordination number and alter metal-specificity.78 These observations suggest that increases in metal site coordination number within a structural family generally require recruitment of ligands from distinct regions of the protein that are more tolerant to amino acid insertions and deletions, such as loops and the amino and carboxy termini.
The RcnR/CsoR family contains several distinct functional classes that likely respond to very different types of allosteric effectors. Ensuring ligand-binding specificity would require adaptation of the general binding site that has been identified from these studies of RcnR and those of CsoR. CsoR coordinates Cu(I) with three ligands (Cys35, His60, Cys64, using RcnR numbering),12, 79 while RcnR responds biologically to metals that require higher coordination spheres by recruiting ligands from the N-terminal region, which is not used by CsoR for metal coordination, as well as a residue changes at position 64. The identification of four RcnR residues that when mutated drastically affect metal binding and metal-responsiveness suggests that RcnR/CsoR-like sequences can be analyzed to make predictions about ligand-binding specificities. For example, sequences containing His/Cys/His/His residues at positions 3, 35, 60 and 64 (RcnR numbering) respectively, are likely Ni(II) and Co(II) responsive regulators (Fig. 7). Proteins with Xaa/Cys/His/Cys residues (Xaa = non-conserved residue) are likely Cu(I) responsive regulators. Thus, the residues at these four positions provide a fingerprint that likely correlate with the ligand-binding specificity of a particular protein class in the largely uncharacterized RcnR/CsoR superfamily.
Using these minimal sequence criteria, ~450 unique sequences of the RcnR/CsoR family (COG 1937) were categorized into six different groups (Figure 7). CsoR-like regulators (Xaa/Cys/His/Cys) are the most abundant class, with 242 sequences. Of the remaining sequences, 72 (47 sequences with <95% identity; see Supporting Information)) are predicted to be Ni/Co responsive transcriptional regulators. All sequences with this pattern are expected to express a protein with only one residue preceding His3,38 suggesting a strong bias towards the N-terminal coordination motif proposed here. All of the proposed rcnR genes have a neighboring gene that encodes a putative metal efflux protein (Figure 7), likely responsible for Ni/Co export. Position 3 in other groups varies widely and may not play a role in ligand binding in these other proteins. Thus, the RcnR class may be unique because it has recruited residues from the N-terminal region to aid in metal recognition.
Formaldehyde-responsive FrmRs80 (12 sequences) can be singled out based on their fingerprint (Xaa/Cys/His/Xaa fingerprint) and proximity to formaldehyde dehydrogenase genes. The structural basis for formaldehyde responsiveness by FrmR is not known, and the involvement of a metal-ligand has not been explored. Additional sequence fingerprints for uncharacterized proteins were also detected, and predictions can be made about ligand specificities based on gene neighborhood analysis. For example, 92 genes encoding the Xaa/Cys/(Tyr, Asn, or Gly)/Cys proteins are preferentially near genes with functions related to antibiotic or oxidative stress responses, suggesting that not all RcnR/CsoR regulators are metal responsive. Some organisms, such as Deinococcus geothermalis,81 have multiple RcnR/CsoR family members, emphasizing the need for precise structural control of ligand binding specificity. Further biochemical and biological studies will be required to identify the signals for each type of regulator. Once these signals are identified, the structural basis for ligand recognition and allosteric regulation can be characterized in detail.
Supplementary Material
Supporting Information Available: Concentration dependence of RcnR stability. Plots of analytical ultracentrifugation data. UV-visible spectra IAM-modified RcnR and RcnR mutants. Metal titrations of RcnR mutants. Fourier-filtered and Fourier transform spectra for metal-substituted RcnR. EPR spectrum of Co(II) substituted RcnR. Sequence alignment of RcnR family. Sequence alignment of representative RcnR/CsoR family groups. Tables of EXAFS fits for M(II)-complexes. Tables of strains, plasmids, and oligonucleotides. This material is available free of charge via the Internet at http://pubs.acs.org
Acknowledgments
This work was supported by NSF grant MCB0520877 to PTC, NIH grant GM-69696 to MJM, and NIH National Research Service Award T32 GM08515 (SL). We thank the Chivers lab for helpful discussions, Haoran Li for technical assistance with LacZ assays, Johnna Roose for her AAS expertise, Mike Bradley for help with sequence analysis, Profs. Brian Bennett and Paul Lahti for help with the simulation of the Co(II)-RcnR spectrum and helpful discussions. XAS data collection was carried out at the Stanford Synchrotron Radiation Laboratory, a national user facility operated by Stanford University on behalf of the U. S.
Department of Energy, Office of Basic Energy Sciences. The SSRL Structural and Molecular Biology Program is supported by the Department of Energy, Office of Biological and Environmental Research, and by the National Institutes of Health, National Center for Research Resources, Biomedical Technology Program.
References
- 1.Giedroc DP, Arunkumar AI. Dalton Trans. 2007;(29):3107–20. doi: 10.1039/b706769k. [DOI] [PubMed] [Google Scholar]
- 2.Outten FW, Outten CE, Hale J, O’Halloran TV. J Biol Chem. 2000;275(40):31024–9. doi: 10.1074/jbc.M006508200. [DOI] [PubMed] [Google Scholar]
- 3.Xiong A, Jayaswal RK. J Bacteriol. 1998;180(16):4024–9. doi: 10.1128/jb.180.16.4024-4029.1998. [DOI] [PMC free article] [PubMed] [Google Scholar]
- 4.Borremans B, Hobman JL, Provoost A, Brown NL, van Der Lelie D. J Bacteriol. 2001;183(19):5651–8. doi: 10.1128/JB.183.19.5651-5658.2001. [DOI] [PMC free article] [PubMed] [Google Scholar]
- 5.Outten CE, O’Halloran TV. Science. 2001;292(5526):2488–92. doi: 10.1126/science.1060331. [DOI] [PubMed] [Google Scholar]
- 6.Pennella MA, Shokes JE, Cosper NJ, Scott RA, Giedroc DP. Proc Natl Acad Sci U S A. 2003;100(7):3713–8. doi: 10.1073/pnas.0636943100. [DOI] [PMC free article] [PubMed] [Google Scholar]
- 7.Wang SC, Dias AV, Bloom SL, Zamble DB. Biochemistry. 2004;43(31):10018–28. doi: 10.1021/bi049405c. [DOI] [PubMed] [Google Scholar]
- 8.Leitch S, Bradley MJ, Rowe JL, Chivers PT, Maroney MJ. J Am Chem Soc. 2007 doi: 10.1021/ja068505y. [DOI] [PubMed] [Google Scholar]
- 9.Iwig JS, Rowe JL, Chivers PT. Mol Microbiol. 2006;62(1):252–62. doi: 10.1111/j.1365-2958.2006.05369.x. [DOI] [PubMed] [Google Scholar]
- 10.Rodrigue A, Effantin G, Mandrand-Berthelot MA. J Bacteriol. 2005;187(8):2912–6. doi: 10.1128/JB.187.8.2912-2916.2005. [DOI] [PMC free article] [PubMed] [Google Scholar]
- 11.Busenlehner LS, Pennella MA, Giedroc DP. FEMS Microbiol Rev. 2003;27(2–3):131–43. doi: 10.1016/S0168-6445(03)00054-8. [DOI] [PubMed] [Google Scholar]
- 12.Liu T, Ramesh A, Ma Z, Ward SK, Zhang L, George GN, Talaat AM, Sacchettini JC, Giedroc DP. Nat Chem Biol. 2007;3(1):60–8. doi: 10.1038/nchembio844. [DOI] [PubMed] [Google Scholar]
- 13.Ballantine SP, Boxer DH. J Bacteriol. 1985;163(2):454–9. doi: 10.1128/jb.163.2.454-459.1985. [DOI] [PMC free article] [PubMed] [Google Scholar]
- 14.Sawers RG, Ballantine SP, Boxer DH. J Bacteriol. 1985;164(3):1324–31. doi: 10.1128/jb.164.3.1324-1331.1985. [DOI] [PMC free article] [PubMed] [Google Scholar]
- 15.Wu LF, Mandrand-Berthelot MA, Waugh R, Edmonds CJ, Holt SE, Boxer DH. Mol Microbiol. 1989;3(12):1709–18. doi: 10.1111/j.1365-2958.1989.tb00156.x. [DOI] [PubMed] [Google Scholar]
- 16.Wu LF, Navarro C, Mandrand-Berthelot MA. Gene. 1991;107(1):37–42. doi: 10.1016/0378-1119(91)90294-l. [DOI] [PubMed] [Google Scholar]
- 17.Lawrence JG, Roth JR. Genetics. 1996;142(1):11–24. doi: 10.1093/genetics/142.1.11. [DOI] [PMC free article] [PubMed] [Google Scholar]
- 18.Roth JR, Lawrence JG, Bobik TA. Annu Rev Microbiol. 1996;50:137–81. doi: 10.1146/annurev.micro.50.1.137. [DOI] [PubMed] [Google Scholar]
- 19.Cadieux N, Bradbeer C, Reeger-Schneider E, Koster W, Mohanty AK, Wiener MC, Kadner RJ. J Bacteriol. 2002;184(3):706–17. doi: 10.1128/JB.184.3.706-717.2002. [DOI] [PMC free article] [PubMed] [Google Scholar]
- 20.de Veaux LC, Clevenson DS, Bradbeer C, Kadner RJ. J Bacteriol. 1986;167(3):920–7. doi: 10.1128/jb.167.3.920-927.1986. [DOI] [PMC free article] [PubMed] [Google Scholar]
- 21.Gibson MM, Bagga DA, Miller CG, Maguire ME. Mol Microbiol. 1991;5(11):2753–62. doi: 10.1111/j.1365-2958.1991.tb01984.x. [DOI] [PubMed] [Google Scholar]
- 22.Wu LF, Navarro C, de Pina K, Quenard M, Mandrand MA. Environ Health Perspect. 1994;102(Suppl 3):297–300. doi: 10.1289/ehp.94102s3297. [DOI] [PMC free article] [PubMed] [Google Scholar]
- 23.Ranquet C, Ollagnier-de-Choudens S, Loiseau L, Barras F, Fontecave M. J Biol Chem. 2007;282(42):30442–30451. doi: 10.1074/jbc.M702519200. [DOI] [PubMed] [Google Scholar]
- 24.Chung CT, Niemela SL, Miller RH. Proc Natl Acad Sci U S A. 1989;86(7):2172–5. doi: 10.1073/pnas.86.7.2172. [DOI] [PMC free article] [PubMed] [Google Scholar]
- 25.Ho SN, Hunt HD, Horton RM, Pullen JK, Pease LR. Gene. 1989;77(1):51–9. doi: 10.1016/0378-1119(89)90358-2. [DOI] [PubMed] [Google Scholar]
- 26.Hendrickson WA, Horton JR, LeMaster DM. Embo J. 1990;9(5):1665–72. doi: 10.1002/j.1460-2075.1990.tb08287.x. [DOI] [PMC free article] [PubMed] [Google Scholar]
- 27.Creighton TE. Disulphide bonds between cysteine residues. In: Creighton TE, editor. Protein structure - a practical approach. Oxford University Press; Oxford: 1989. pp. 155–167. [Google Scholar]
- 28.Riddles PW, Blakeley RL, Zerner B. Methods Enzymol. 1983;91:49–60. doi: 10.1016/s0076-6879(83)91010-8. [DOI] [PubMed] [Google Scholar]
- 29.Siemann S, Brewer D, Clarke AJ, Dmitrienko GI, Lajoie G, Viswanatha T. Biochim Biophys Acta. 2002;1571(3):190–200. doi: 10.1016/s0304-4165(02)00258-1. [DOI] [PubMed] [Google Scholar]
- 30.Hunt J, Neece S, Ginsburg A. Anal Biochem. 1985;146:150–157. doi: 10.1016/0003-2697(85)90409-9. [DOI] [PubMed] [Google Scholar]
- 31.Laue TM, Shah BD, Ridgeway TM, Pelletier SL. Analytical Ultracentrifugation in Biochemistry and Polymer Science. Royal Society of Chemistry; Cambridge, U.K: 1992. pp. 90–125. [Google Scholar]
- 32.Vistica J, Dam J, Balbo A, Yikilmaz E, Mariuzza RA, Rouault TA, Schuck P. Anal Biochem. 2004;326(2):234–56. doi: 10.1016/j.ab.2003.12.014. [DOI] [PubMed] [Google Scholar]
- 33.Myers JK, Pace CN, Scholtz JM. Biochemistry. 1997;36(36):10923–9. doi: 10.1021/bi9707180. [DOI] [PubMed] [Google Scholar]
- 34.Rohl CA, Chakrabartty A, Baldwin RL. Protein Sci. 1996;5(12):2623–37. doi: 10.1002/pro.5560051225. [DOI] [PMC free article] [PubMed] [Google Scholar]
- 35.Chivers PT, Sauer RT. Chem Biol. 2002;9(10):1141–8. doi: 10.1016/s1074-5521(02)00241-7. [DOI] [PubMed] [Google Scholar]
- 36.Santoro MM, Bolen DW. Biochemistry. 1988;27(21):8063–8. doi: 10.1021/bi00421a014. [DOI] [PubMed] [Google Scholar]
- 37.Choe M, Reznikoff WS. J Bacteriol. 1991;173(19):6139–46. doi: 10.1128/jb.173.19.6139-6146.1991. [DOI] [PMC free article] [PubMed] [Google Scholar]
- 38.Frottin F, Martinez A, Peynot P, Mitra S, Holz RC, Giglione C, Meinnel T. Mol Cell Proteomics. 2006;5(12):2336–49. doi: 10.1074/mcp.M600225-MCP200. [DOI] [PubMed] [Google Scholar]
- 39.Brown DC, Collins KD. J Biol Chem. 1991;266(3):1597–604. [PubMed] [Google Scholar]
- 40.May SW, Kuo JY. Biochemistry. 1978;17(16):3333–8. doi: 10.1021/bi00609a025. [DOI] [PubMed] [Google Scholar]
- 41.Ragunathan KG, Bharadwaj PK. Journal of the Chemical Society-Dalton Transactions. 1992;(15):2417–2422. [Google Scholar]
- 42.Rosenfield SG, Berends HP, Gelmini L, Stephan DW, Mascharak PK. Inorg Chem. 1987;26(17):2792–2797. [Google Scholar]
- 43.Golynskiy MV, Gunderson WA, Hendrich MP, Cohen SM. Biochemistry. 2006;45(51):15359–72. doi: 10.1021/bi0607406. [DOI] [PMC free article] [PubMed] [Google Scholar]
- 44.Kwan CY, Putney JW., Jr J Biol Chem. 1990;265(2):678–84. [PubMed] [Google Scholar]
- 45.Grynkiewicz G, Poenie M, Tsien RY. J Biol Chem. 1985;260(6):3440–50. [PubMed] [Google Scholar]
- 46.Scott RA. Measurement of metal-ligand distances by EXAFS. In: Hirs CHW, Timasheff SN, editors. Enzyme Structure Part J. Vol. 117. Academic Press; 1985. pp. 414–459. [Google Scholar]
- 47.Colpas GJ, Maroney MJ, Bagyinka C, Kumar M, Willis WS, Suib SL, Baidya N, Mascharak PK. Inorganic Chemistry. 1991;30(5):920–928. [Google Scholar]
- 48.Padden KM, Krebs JF, MacBeth CE, Scarrow RC, Borovik AS. J Am Chem Soc. 2001;123(6):1072–9. doi: 10.1021/ja003282b. [DOI] [PubMed] [Google Scholar]
- 49.Melnik M, Sramko T, Dunajjurco M, Sirota A, Jona E, Holloway CE. Reviews in Inorganic Chemistry. 1995;15(1–2):139–144. [Google Scholar]
- 50.Bennett B. EPR of Cobalt-Substituted Zinc Enzymes. In: Hanson GR, Berliner LJ, editors. Metals in Biology: Applications of High Resolution EPR to Metalloenzymes. Vol. 29 Springer; New York: 2007. [Google Scholar]
- 51.Crawford PA, Yang KW, Sharma N, Bennett B, Crowder MW. Biochemistry. 2005;44(13):5168–5176. doi: 10.1021/bi047463s. [DOI] [PubMed] [Google Scholar]
- 52.Wuerges J, Lee JW, Yim YI, Yim HS, Kang SO, Carugo KD. Proc Natl Acad Sci U S A. 2004;101(23):8569–74. doi: 10.1073/pnas.0308514101. [DOI] [PMC free article] [PubMed] [Google Scholar]
- 53.Barondeau DP, Kassmann CJ, Bruns CK, Tainer JA, Getzoff ED. Biochemistry. 2004;43(25):8038–47. doi: 10.1021/bi0496081. [DOI] [PubMed] [Google Scholar]
- 54.Chivers PT, Sauer RT. J Biol Chem. 2000;275(26):19735–41. doi: 10.1074/jbc.M002232200. [DOI] [PubMed] [Google Scholar]
- 55.Glennon JD, Sarkar B. Biochem J. 1982;203(1):15–23. doi: 10.1042/bj2030015. [DOI] [PMC free article] [PubMed] [Google Scholar]
- 56.Outten C, Tobin D, Penner-Hahn JTVOH. Biochemistry. 2001;40:10417–10423. doi: 10.1021/bi0155448. [DOI] [PubMed] [Google Scholar]
- 57.Brennan BA, Alms G, Nelson MJ, Durney LT, Scarrow RC. Journal of the American Chemical Society. 1996;118(38):9194–9195. [Google Scholar]
- 58.Fun HK, Raj SS, Zhu XH, Chen XF, Zuo JL, You XZ. Acta Cryst. 1999;C55:896–899. [Google Scholar]
- 59.Yu P, Zhuang B, Huang L, Pan B. Acta Crystallographica Section C. 1996;52(3):630–632. [Google Scholar]
- 60.Heinl U, Hinse P, Frolich R, Mattes R. Zeitschrift fur anorganische und allgemeine Chemie. 2002;628:770–778. [Google Scholar]
- 61.Carrington PE, Chivers PT, Al-Mjeni F, Sauer RT, Maroney MJ. Nat Struct Biol. 2003;10(2):126–30. doi: 10.1038/nsb890. [DOI] [PubMed] [Google Scholar]
- 62.Schreiter ER, Sintchak MD, Guo Y, Chivers PT, Sauer RT, Drennan CL. Nat Struct Biol. 2003;10(10):794–9. doi: 10.1038/nsb985. [DOI] [PubMed] [Google Scholar]
- 63.Rowe JL, Starnes GL, Chivers PT. J Bacteriol. 2005;187(18):6317–23. doi: 10.1128/JB.187.18.6317-6323.2005. [DOI] [PMC free article] [PubMed] [Google Scholar]
- 64.Bloom SL, Zamble DB. Biochemistry. 2004;43(31):10029–38. doi: 10.1021/bi049404k. [DOI] [PubMed] [Google Scholar]
- 65.Gilbert W, Muller-Hill B. Proc Natl Acad Sci U S A. 1966;56(6):1891–1898. doi: 10.1073/pnas.56.6.1891. [DOI] [PMC free article] [PubMed] [Google Scholar]
- 66.Gunsalus RP, Miguel AG, Gunsalus GL. J Bacteriol. 1986;167(1):272–8. doi: 10.1128/jb.167.1.272-278.1986. [DOI] [PMC free article] [PubMed] [Google Scholar]
- 67.Kolodrubetz D, Schleif R. J Mol Biol. 1981;149(1):133–9. doi: 10.1016/0022-2836(81)90265-5. [DOI] [PubMed] [Google Scholar]
- 68.Wilkins RG. Kinetics and Mechanism of Reactions of Transition Metal Complexes. VCH Publishers, Inc; New York: 1991. [Google Scholar]
- 69.Farkas E, Sovago I, Gergely A. J Chem Soc Dalton Trans. 1983:1545–51. [Google Scholar]
- 70.Sovago I, Osz K. Dalton Trans. 2006;(32):3841–54. doi: 10.1039/b607515k. [DOI] [PubMed] [Google Scholar]
- 71.Harford C, Sarkar B. Accounts of Chemical Research. 1997;30(3):123–130. [Google Scholar]
- 72.Ferreira GC, Franco R, Mangravita A, George GN. Biochemistry. 2002;41(15):4809–18. doi: 10.1021/bi015814m. [DOI] [PubMed] [Google Scholar]
- 73.Eicken C, Pennella MA, Chen X, Koshlap KM, VanZile ML, Sacchettini JC, Giedroc DP. J Mol Biol. 2003;333(4):683–95. doi: 10.1016/j.jmb.2003.09.007. [DOI] [PubMed] [Google Scholar]
- 74.Pennella MA, Arunkumar AI, Giedroc DP. J Mol Biol. 2006;356(5):1124–36. doi: 10.1016/j.jmb.2005.12.019. [DOI] [PubMed] [Google Scholar]
- 75.Pohl E, Holmes RK, Hol WG. J Biol Chem. 1998;273(35):22420–7. doi: 10.1074/jbc.273.35.22420. [DOI] [PubMed] [Google Scholar]
- 76.Cavet JS, Meng W, Pennella MA, Appelhoff RJ, Giedroc DP, Robinson NJ. J Biol Chem. 2002;277(41):38441–8. doi: 10.1074/jbc.M207677200. [DOI] [PubMed] [Google Scholar]
- 77.Campbell DR, Chapman KE, Waldron KJ, Tottey S, Kendall S, Cavallaro G, Andreini C, Hinds J, Stoker NG, Robinson NJ, Cavet JS. J Biol Chem. 2007;282(44):32298–310. doi: 10.1074/jbc.M703451200. [DOI] [PMC free article] [PubMed] [Google Scholar]
- 78.Changela A, Chen K, Xue Y, Holschen J, Outten C, O’Halloran T, Mondragon A. Science. 2003;301:1383–1387. doi: 10.1126/science.1085950. [DOI] [PubMed] [Google Scholar]
- 79.Smaldone GT, Helmann JD. Microbiology. 2007;153(Pt 12):4123–8. doi: 10.1099/mic.0.2007/011742-0. [DOI] [PMC free article] [PubMed] [Google Scholar]
- 80.Herring CD, Blattner FR. J Bacteriol. 2004;186(20):6714–20. doi: 10.1128/JB.186.20.6714-6720.2004. [DOI] [PMC free article] [PubMed] [Google Scholar]
- 81.Makarova KS, Omelchenko MV, Gaidamakova EK, Matrosova VY, Vasilenko A, Zhai M, Lapidus A, Copeland A, Kim E, Land M, Mavrommatis K, Pitluck S, Richardson PM, Detter C, Brettin T, Saunders E, Lai B, Ravel B, Kemner KM, Wolf YI, Sorokin A, Gerasimova AV, Gelfand MS, Fredrickson JK, Koonin EV, Daly MJ. PLoS ONE. 2007;2(9):e955. doi: 10.1371/journal.pone.0000955. [DOI] [PMC free article] [PubMed] [Google Scholar]
Associated Data
This section collects any data citations, data availability statements, or supplementary materials included in this article.
Supplementary Materials
Supporting Information Available: Concentration dependence of RcnR stability. Plots of analytical ultracentrifugation data. UV-visible spectra IAM-modified RcnR and RcnR mutants. Metal titrations of RcnR mutants. Fourier-filtered and Fourier transform spectra for metal-substituted RcnR. EPR spectrum of Co(II) substituted RcnR. Sequence alignment of RcnR family. Sequence alignment of representative RcnR/CsoR family groups. Tables of EXAFS fits for M(II)-complexes. Tables of strains, plasmids, and oligonucleotides. This material is available free of charge via the Internet at http://pubs.acs.org